| Param | Original file | Final file |
|---|---|---|
| Filename | modeM0/AS1G07_031T01_9000001402_09852cztM0_level2.evt | modeM0/AS1G07_031T01_9000001402_09852cztM0_level2_quad_clean.evt |
| Size (bytes) | 213,462,720 | 37,992,960 |
| Size | 203.6 MB | 36.2 MB |
| Events in quadrant A | 1,485,514 | 233,328 |
| Events in quadrant B | 1,566,840 | 240,026 |
| Events in quadrant C | 1,519,256 | 234,841 |
| Events in quadrant D | 1,685,274 | 226,069 |
| Mode SS | |||
|---|---|---|---|
| Quadrant | BADHDUFLAG | Total packets | Discarded packets |
| A | 0 | 64 | 0 |
| B | 0 | 64 | 0 |
| C | 0 | 64 | 0 |
| D | 0 | 64 | 0 |
| Mode M9 | |||
|---|---|---|---|
| Quadrant | BADHDUFLAG | Total packets | Discarded packets |
| A | 0 | 10 | 0 |
| B | 0 | 10 | 0 |
| C | 0 | 10 | 0 |
| D | 0 | 10 | 0 |
| Mode M0 | |||
|---|---|---|---|
| Quadrant | BADHDUFLAG | Total packets | Discarded packets |
| A | 0 | 6299 | 2 |
| B | 0 | 6541 | 1 |
| C | 0 | 6380 | 3 |
| D | 0 | 6900 | 1 |
| Quadrant | Total seconds | Saturated seconds | Saturation percentage |
|---|---|---|---|
| A | 3024 | 15 | 0.496032% |
| B | 3024 | 30 | 0.992063% |
| C | 3023 | 13 | 0.430036% |
| D | 3024 | 22 | 0.727513% |
Noise dominated data is calculated using 1-second bins in cleaned event files. If a bin has >2000 counts, and if more than 50% of those come from <1% of pixels, then it is considered to be noise-dominated and hence unusable.
| Quadrant | # 1 sec bins | Bins with >0 counts | Bins with >2000 counts | High rate bins dominated by noise | Noise dominated (total time) | Noise dominated (detector-on time) | Marked lightcurve |
|---|---|---|---|---|---|---|---|
| A | 4109 | 3025 | 0 | 0 | 0.00% | 0.00% | 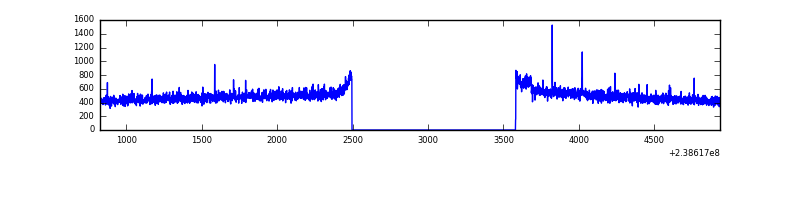 |
| B | 4109 | 3025 | 1 | 1 | 0.02% | 0.03% | 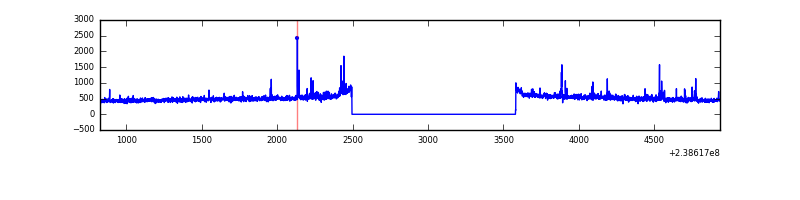 |
| C | 4109 | 3025 | 5 | 5 | 0.12% | 0.17% | 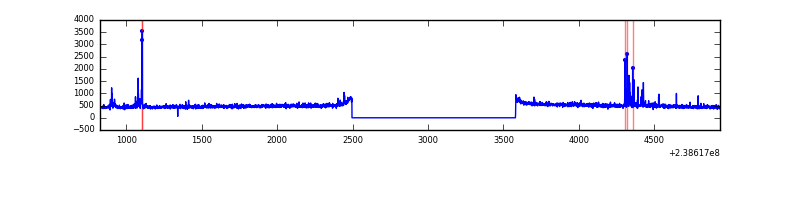 |
| D | 4109 | 3025 | 8 | 8 | 0.19% | 0.26% | 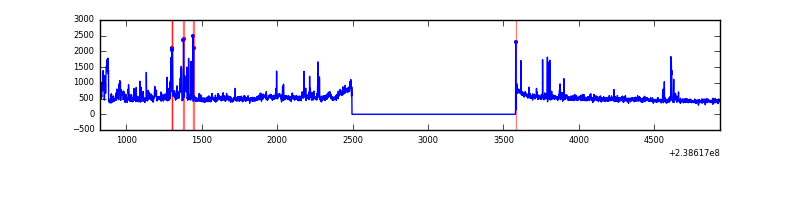 |
Top three noisy pixels from each quadrant. If the there are fewer than three noisy pixels in the level2.evt file, extra rows are filled as -1
| Pixel properties | Quadrant properties | ||||||
|---|---|---|---|---|---|---|---|
| Quadrant | DetID | PixID | Counts | Sigma | Mean | Median | Sigma |
| A | 13 | 251 | 7416 | 88.85 | 382 | 374 | 79.3 |
| A | 0 | 226 | 3552 | 40.1 | 382 | 374 | 79.3 |
| A | 12 | 194 | 3194 | 35.58 | 382 | 374 | 79.3 |
| B | 4 | 81 | 24947 | 330.21 | 383 | 375 | 74.4 |
| B | 0 | 214 | 18747 | 246.89 | 383 | 375 | 74.4 |
| B | 4 | 239 | 16238 | 213.18 | 383 | 375 | 74.4 |
| C | 4 | 254 | 59302 | 664.99 | 372 | 376 | 88.6 |
| C | 0 | 207 | 3817 | 38.83 | 372 | 376 | 88.6 |
| C | 13 | 61 | 2833 | 27.73 | 372 | 376 | 88.6 |
| D | 1 | 52 | 161522 | 1706.76 | 369 | 358 | 94.4 |
| D | 8 | 195 | 57903 | 609.41 | 369 | 358 | 94.4 |
| D | 2 | 14 | 21085 | 219.5 | 369 | 358 | 94.4 |
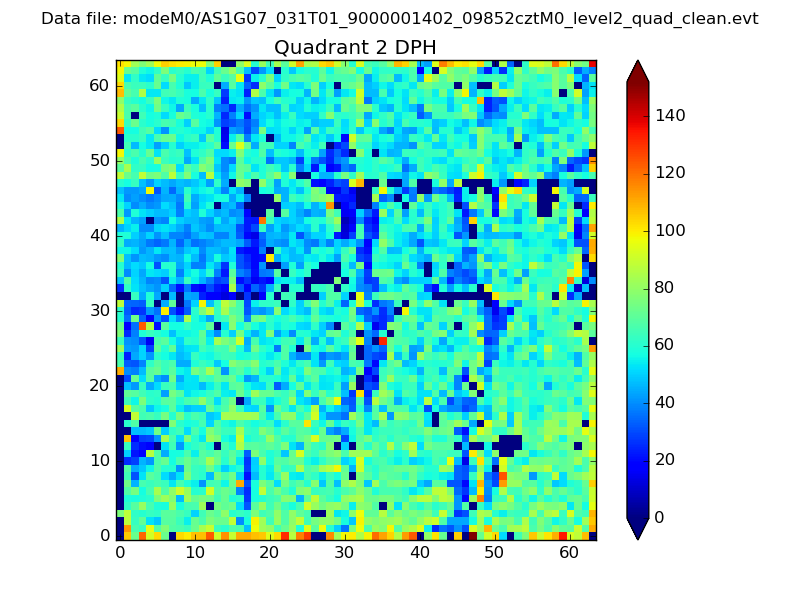
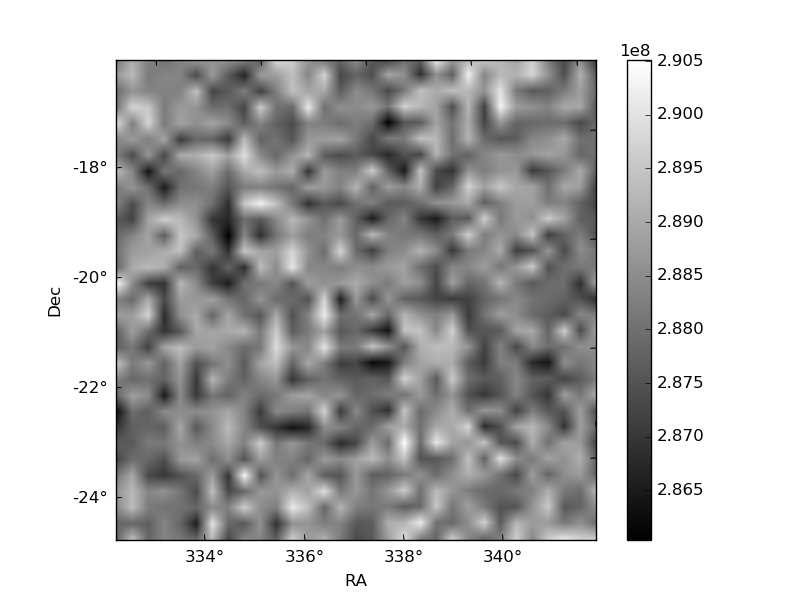
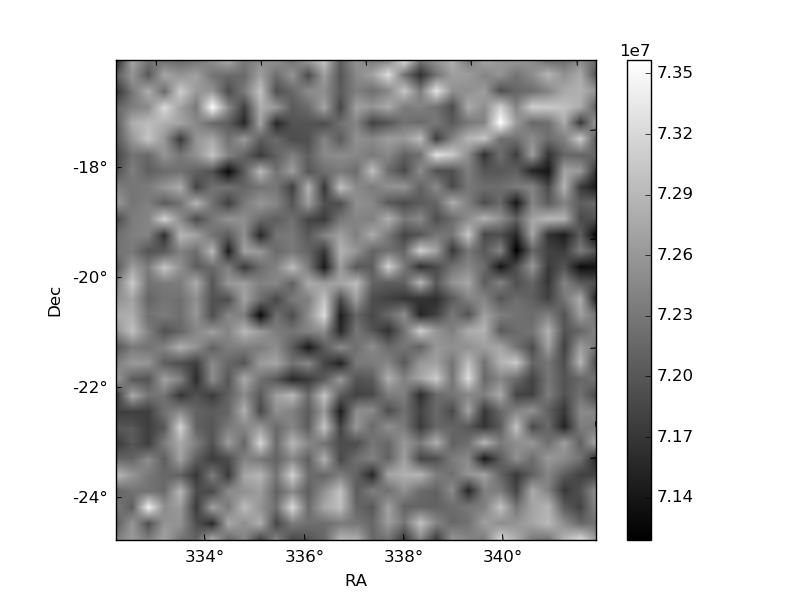
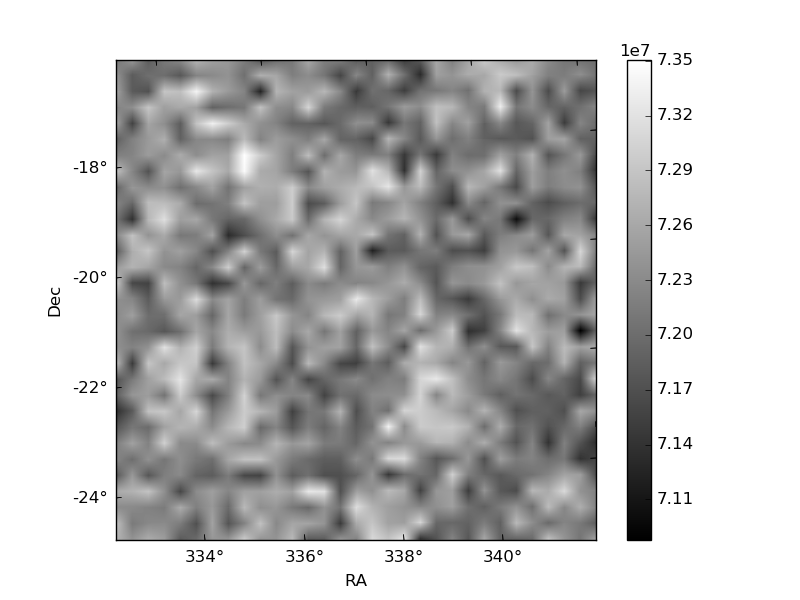
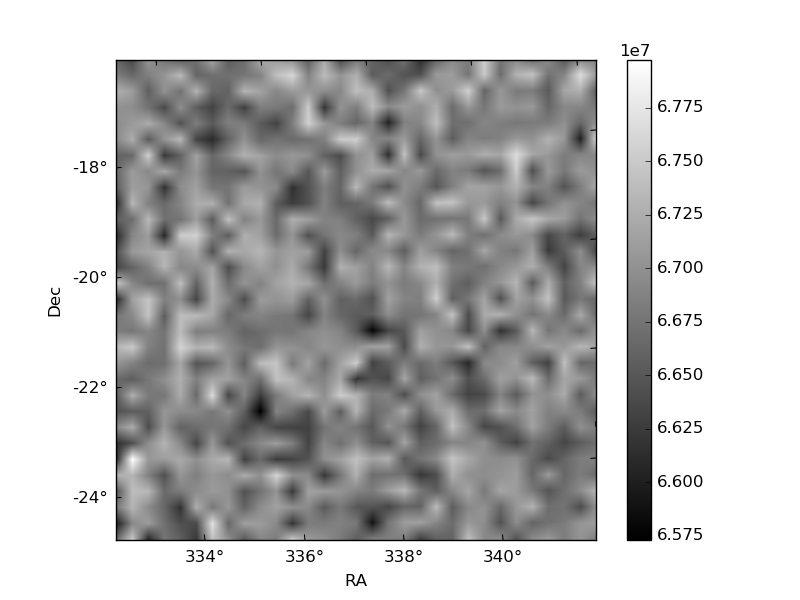
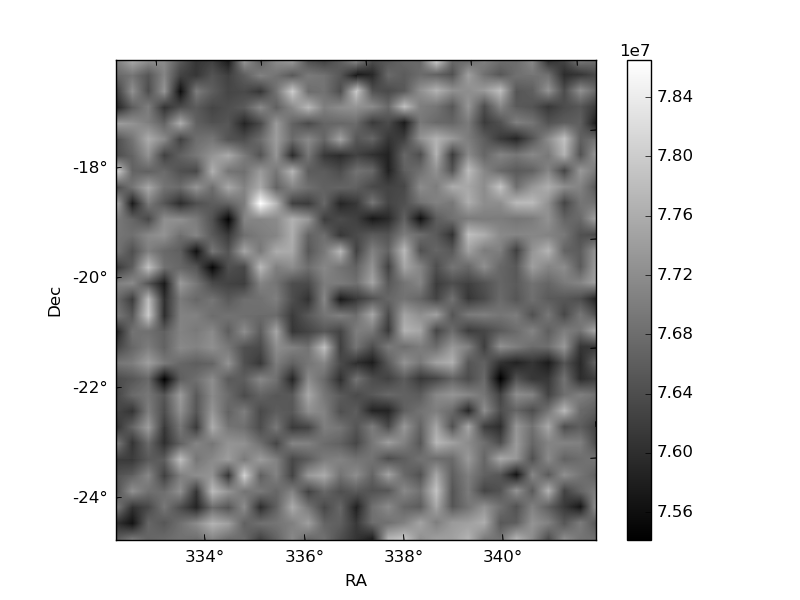
Histogram calculated using DETX and DETY for each event in the final _common_clean file
| Quadrant A | 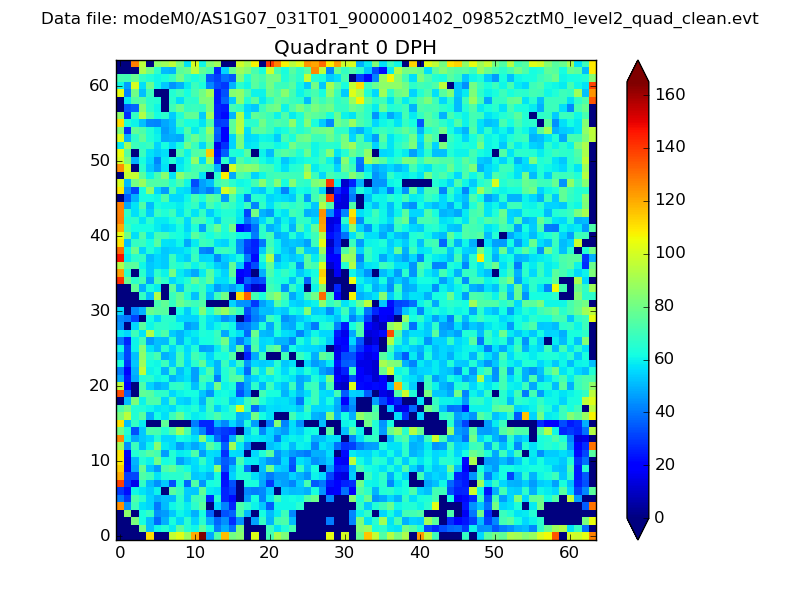 |
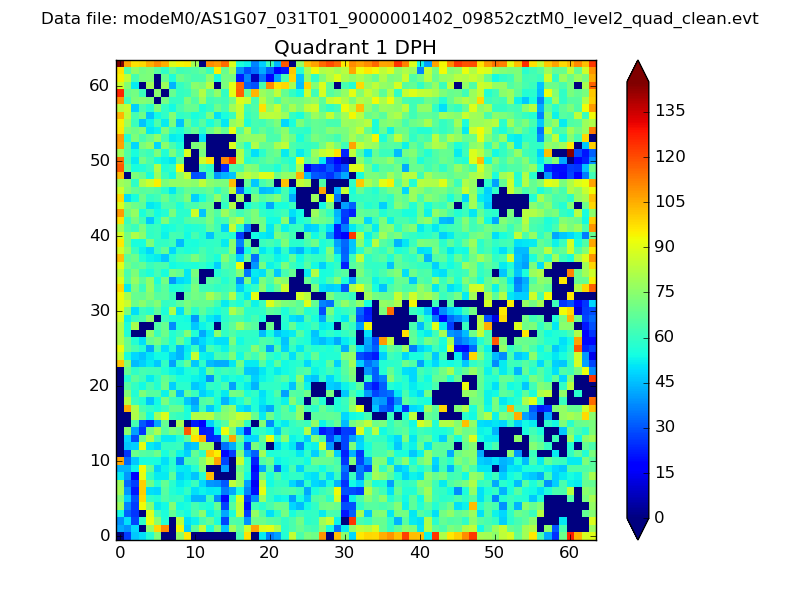 |
Quadrant B |
|---|---|---|---|
| Quadrant D | 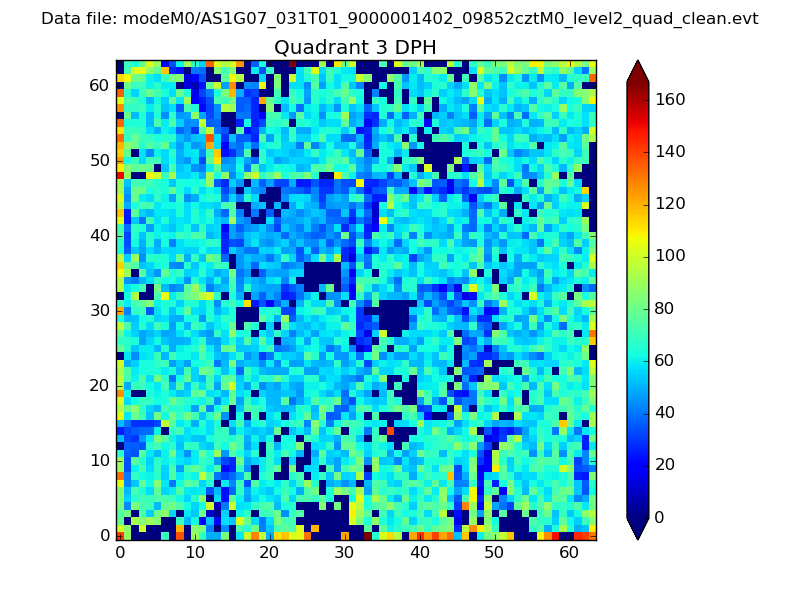 |
 |
Quadrant C |
| Plot type | Count rate plots | Images |
|---|---|---|
| Comparison with Poisson distribution Blue bars denote a histogram of data divided into 1 sec bins. Red curve is a Poisson curve with rate = median count rate of data. |
 |
 |
| Quadrant-wise count rates Data is divided into 100 sec bins |
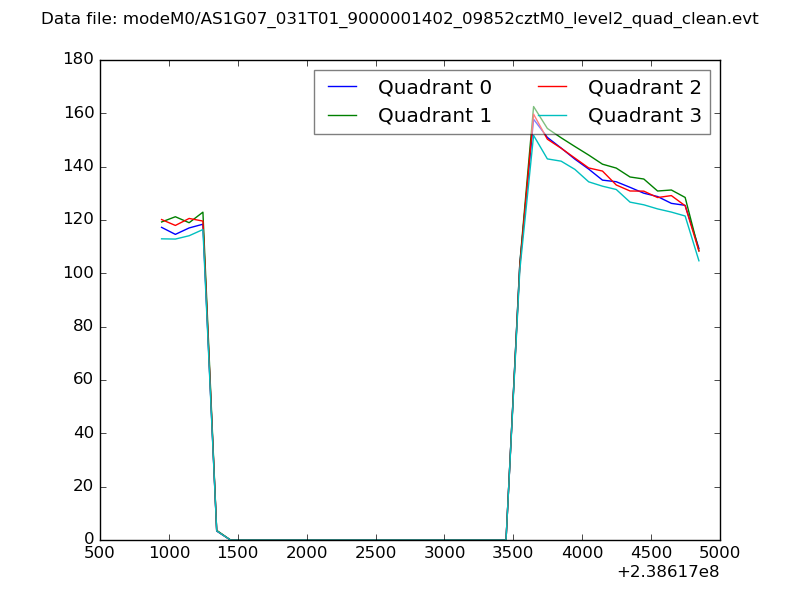 |
|
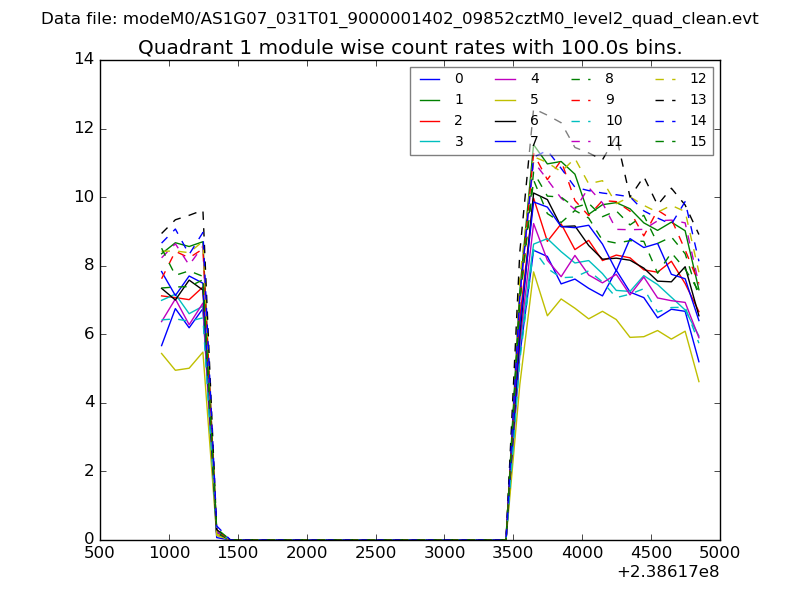
| Module-wise count rates for Quadrant A Data is divided into 100 sec bins |
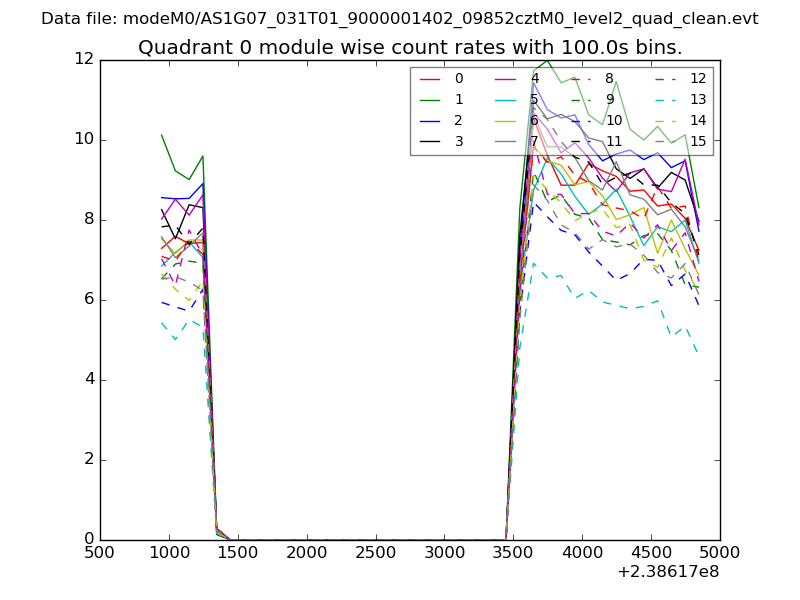 |
 |
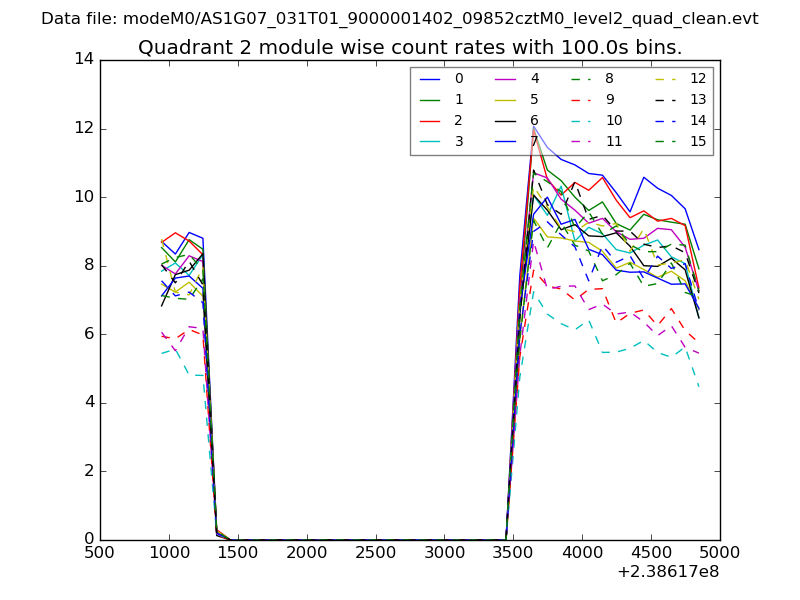
| Module-wise count rates for Quadrant B Data is divided into 100 sec bins |
 |
 |
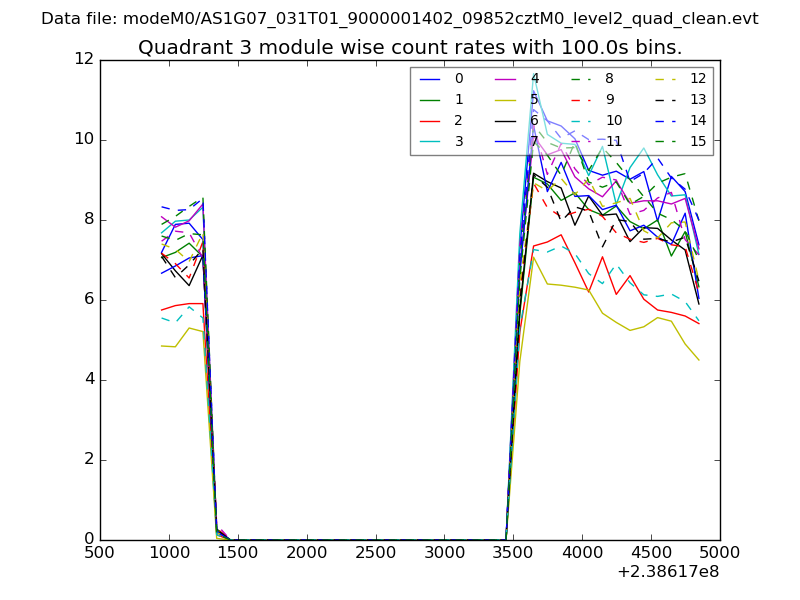
| Module-wise count rates for Quadrant C Data is divided into 100 sec bins |
 |
 |
| Module-wise count rates for Quadrant D Data is divided into 100 sec bins |
 |
 |
| Parameter | Plot |
|---|---|
| CZT HV Monitor | 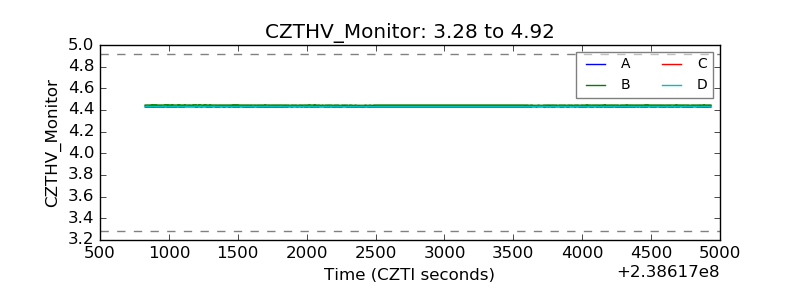 |
| D_VDD | 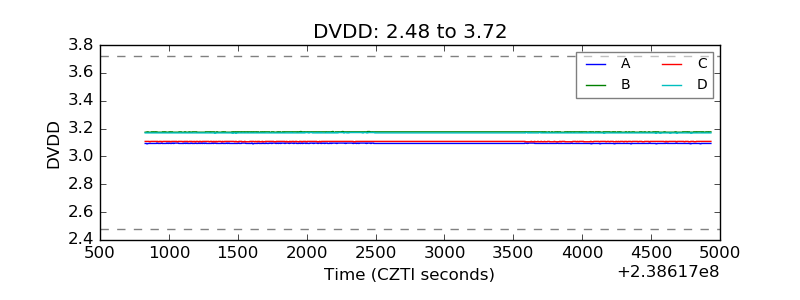 |
| Temperature 1 | 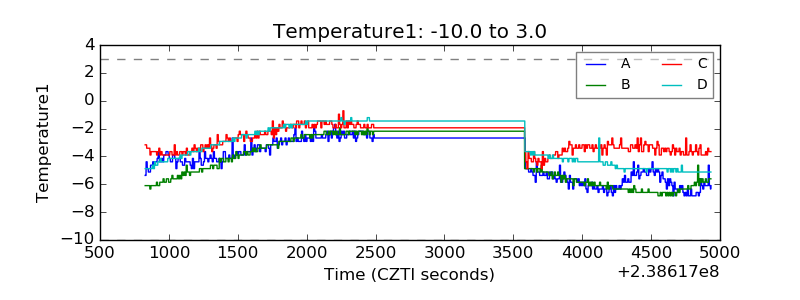 |
| Veto HV Monitor |  |
| Veto LLD | 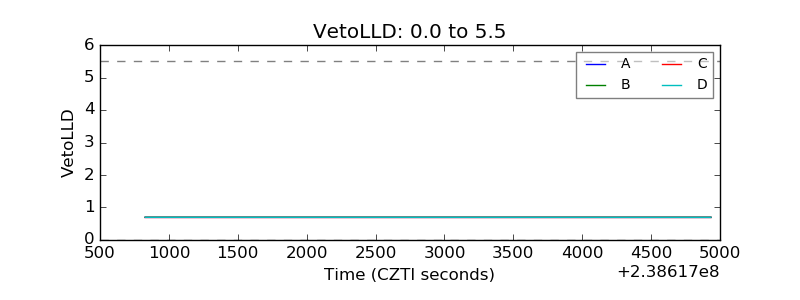 |
| Alpha Counter | 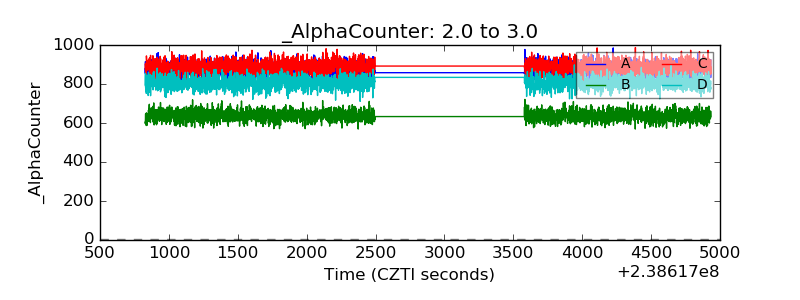 |
| _CPM_Rate | 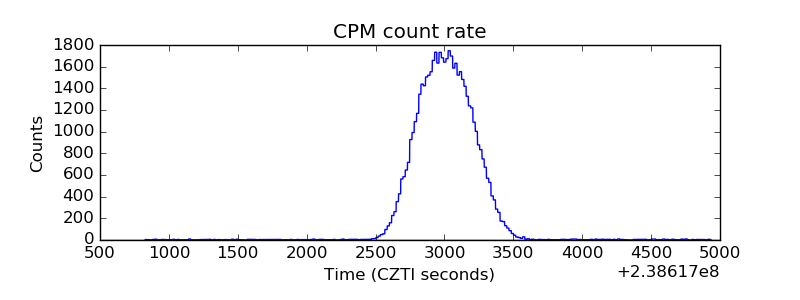 |
| CZT Counter | 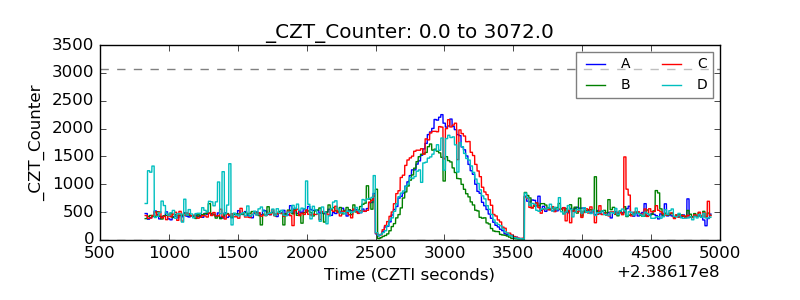 |
| +2.5 Volts monitor |  |
| +5 Volts monitor |  |
| _ROLL_ROT | 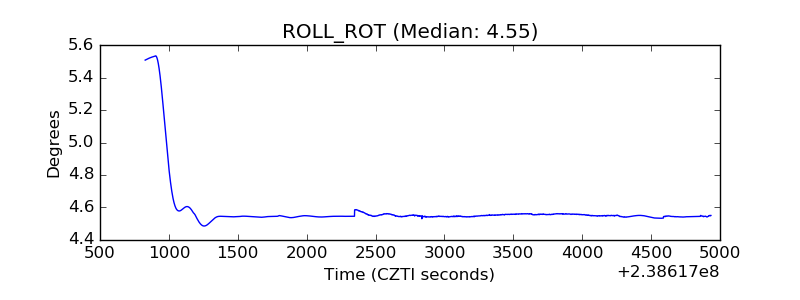 |
| _Roll_DEC | 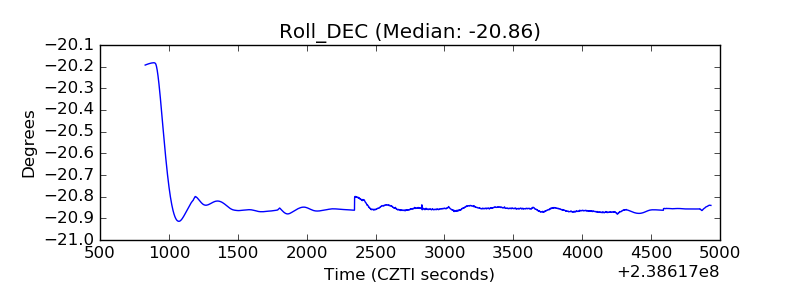 |
| _Roll_RA | 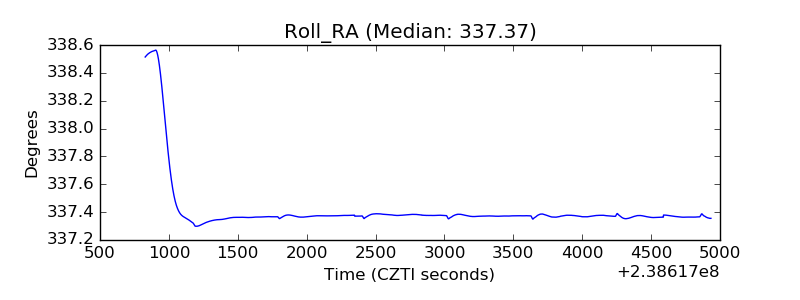 |
| Veto Counter | 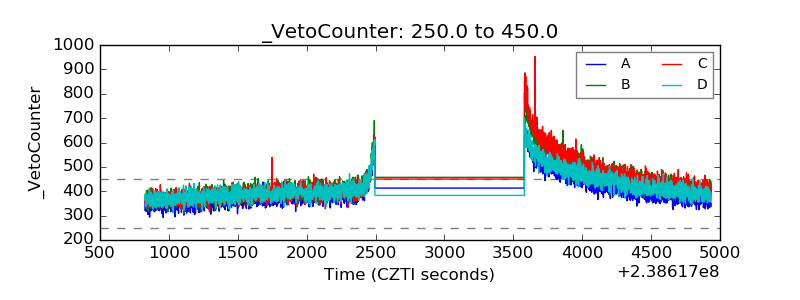 |