| Param | Original file | Final file |
|---|---|---|
| Filename | modeM0/AS1G07_031T01_9000001402_09855cztM0_level2.evt | modeM0/AS1G07_031T01_9000001402_09855cztM0_level2_quad_clean.evt |
| Size (bytes) | 413,735,040 | 89,769,600 |
| Size | 394.6 MB | 85.6 MB |
| Events in quadrant A | 2,738,141 | 577,927 |
| Events in quadrant B | 3,031,013 | 591,815 |
| Events in quadrant C | 2,965,380 | 582,116 |
| Events in quadrant D | 3,401,178 | 562,001 |
| Mode SS | |||
|---|---|---|---|
| Quadrant | BADHDUFLAG | Total packets | Discarded packets |
| A | 0 | 126 | 16 |
| B | 0 | 126 | 8 |
| C | 0 | 126 | 8 |
| D | 0 | 126 | 8 |
| Mode M9 | |||
|---|---|---|---|
| Quadrant | BADHDUFLAG | Total packets | Discarded packets |
| A | 0 | 21 | 0 |
| B | 0 | 20 | 0 |
| C | 0 | 21 | 2 |
| D | 0 | 21 | 3 |
| Mode M0 | |||
|---|---|---|---|
| Quadrant | BADHDUFLAG | Total packets | Discarded packets |
| A | 0 | 12813 | 789 |
| B | 0 | 13690 | 840 |
| C | 0 | 13478 | 812 |
| D | 0 | 15046 | 920 |
| Quadrant | Total seconds | Saturated seconds | Saturation percentage |
|---|---|---|---|
| A | 5786 | 13 | 0.224680% |
| B | 5778 | 49 | 0.848044% |
| C | 5797 | 43 | 0.741763% |
| D | 5788 | 188 | 3.248100% |
Noise dominated data is calculated using 1-second bins in cleaned event files. If a bin has >2000 counts, and if more than 50% of those come from <1% of pixels, then it is considered to be noise-dominated and hence unusable.
| Quadrant | # 1 sec bins | Bins with >0 counts | Bins with >2000 counts | High rate bins dominated by noise | Noise dominated (total time) | Noise dominated (detector-on time) | Marked lightcurve |
|---|---|---|---|---|---|---|---|
| A | 7386 | 6107 | 2 | 2 | 0.03% | 0.03% |  |
| B | 7386 | 6112 | 15 | 15 | 0.20% | 0.25% | 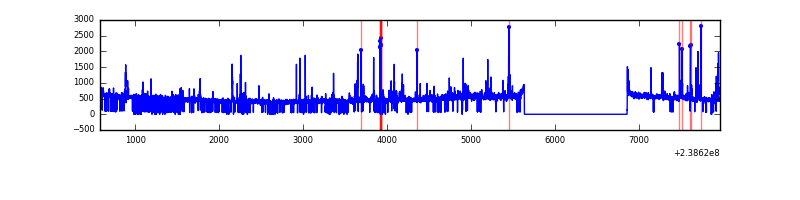 |
| C | 7386 | 6116 | 19 | 19 | 0.26% | 0.31% | 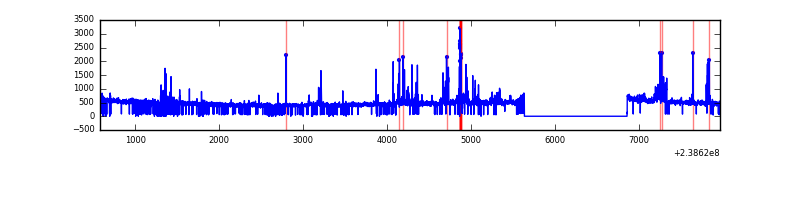 |
| D | 7386 | 6107 | 119 | 119 | 1.61% | 1.95% | 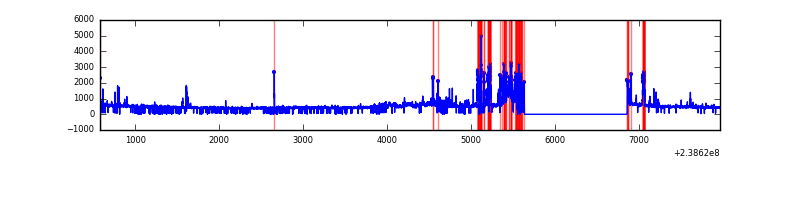 |
Top three noisy pixels from each quadrant. If the there are fewer than three noisy pixels in the level2.evt file, extra rows are filled as -1
| Pixel properties | Quadrant properties | ||||||
|---|---|---|---|---|---|---|---|
| Quadrant | DetID | PixID | Counts | Sigma | Mean | Median | Sigma |
| A | 15 | 174 | 29548 | 203.54 | 698 | 684 | 141.8 |
| A | 13 | 251 | 10543 | 69.52 | 698 | 684 | 141.8 |
| A | 0 | 226 | 6286 | 39.5 | 698 | 684 | 141.8 |
| B | 4 | 81 | 194626 | 1452.25 | 706 | 688 | 133.5 |
| B | 0 | 214 | 44202 | 325.84 | 706 | 688 | 133.5 |
| B | 12 | 111 | 14668 | 104.69 | 706 | 688 | 133.5 |
| C | 4 | 254 | 250209 | 1551.99 | 691 | 696 | 160.8 |
| C | 0 | 207 | 13412 | 79.09 | 691 | 696 | 160.8 |
| C | 13 | 61 | 5211 | 28.08 | 691 | 696 | 160.8 |
| D | 10 | 253 | 262000 | 1557.56 | 672 | 656 | 167.8 |
| D | 8 | 195 | 151583 | 899.5 | 672 | 656 | 167.8 |
| D | 12 | 233 | 124919 | 740.58 | 672 | 656 | 167.8 |
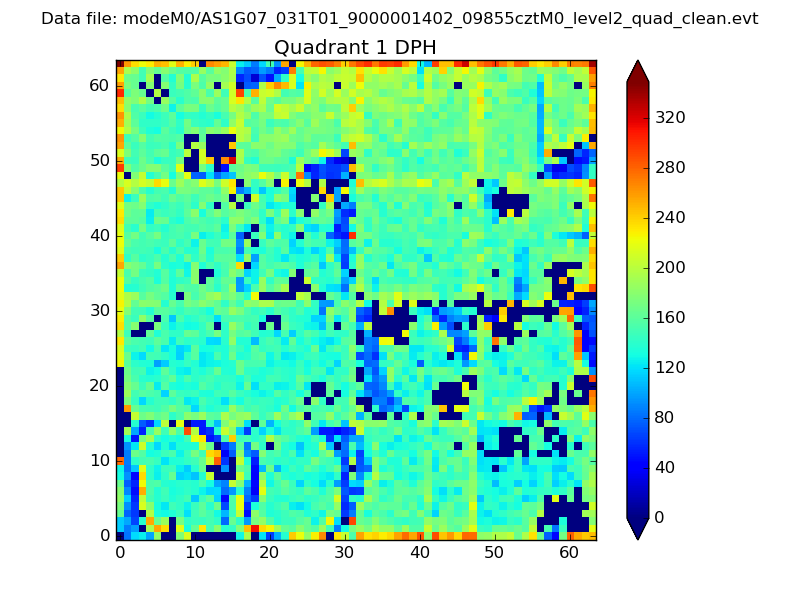
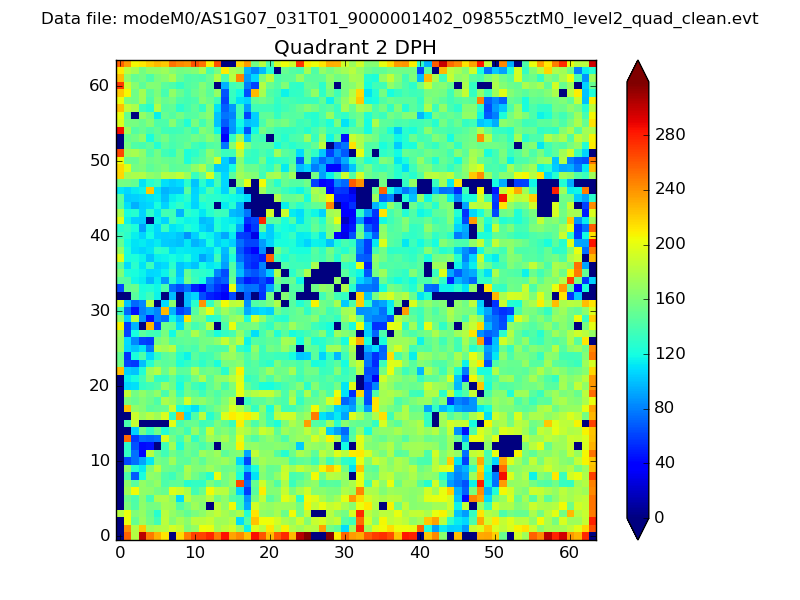
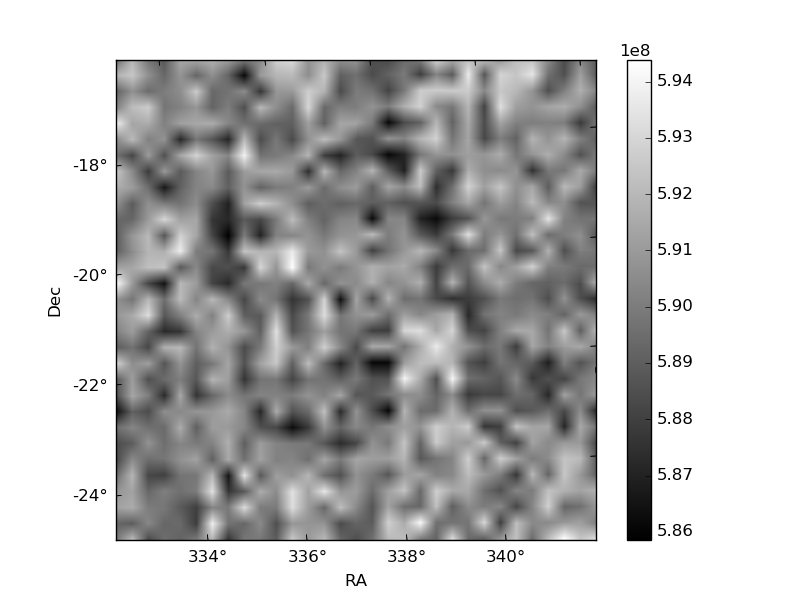
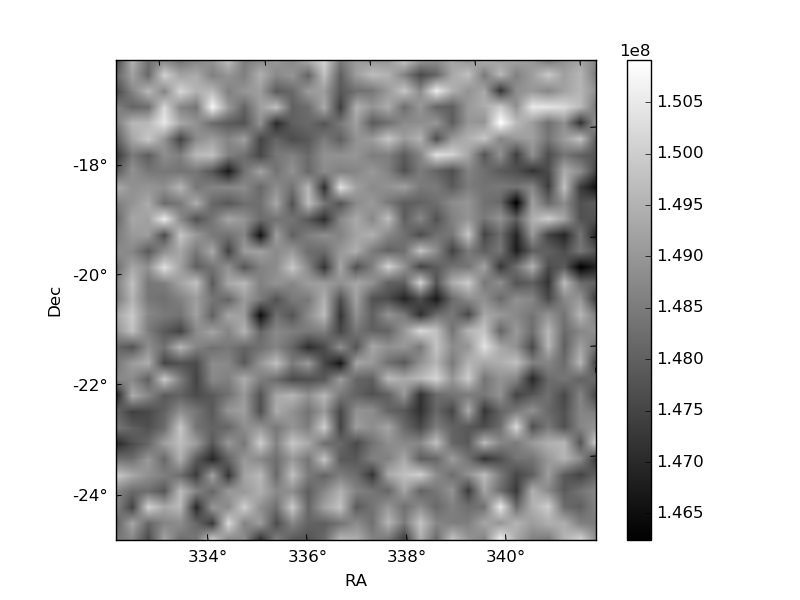
Histogram calculated using DETX and DETY for each event in the final _common_clean file
| Quadrant A | 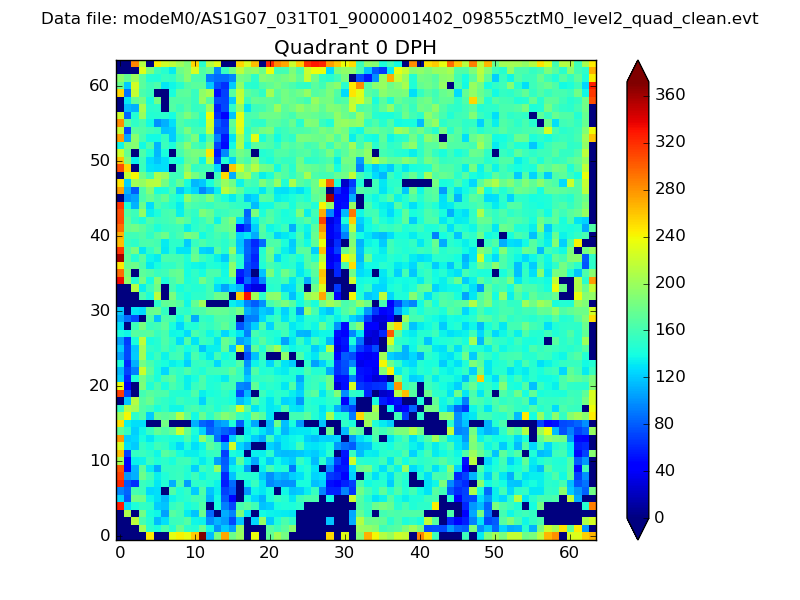 |
 |
Quadrant B |
|---|---|---|---|
| Quadrant D | 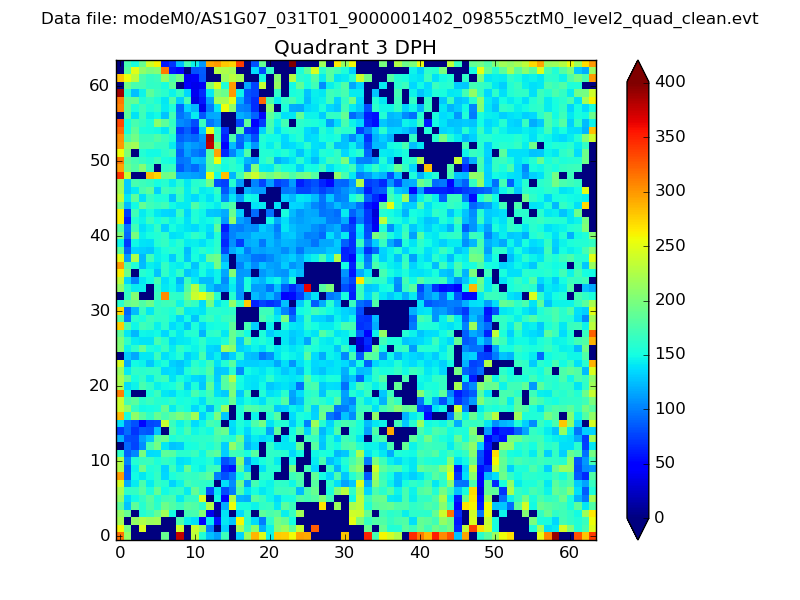 |
 |
Quadrant C |
| Plot type | Count rate plots | Images |
|---|---|---|
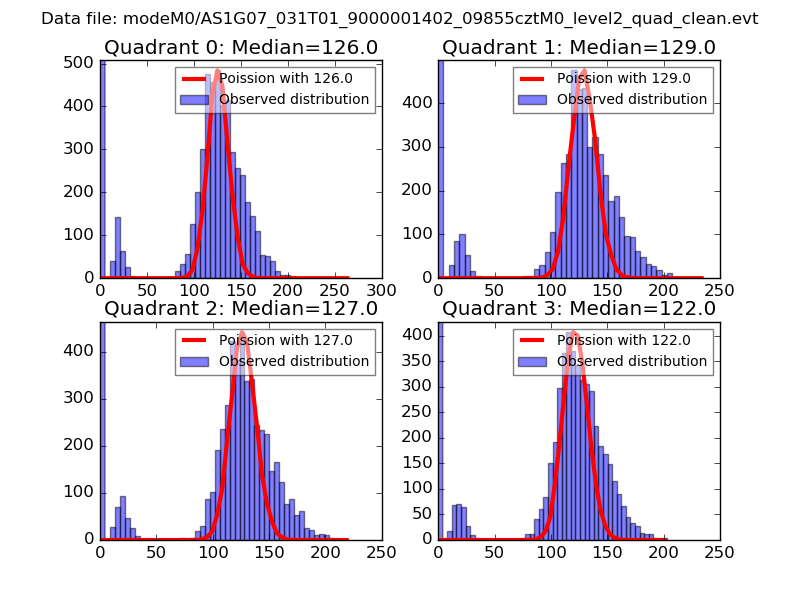
| Comparison with Poisson distribution Blue bars denote a histogram of data divided into 1 sec bins. Red curve is a Poisson curve with rate = median count rate of data. |
 |
 |
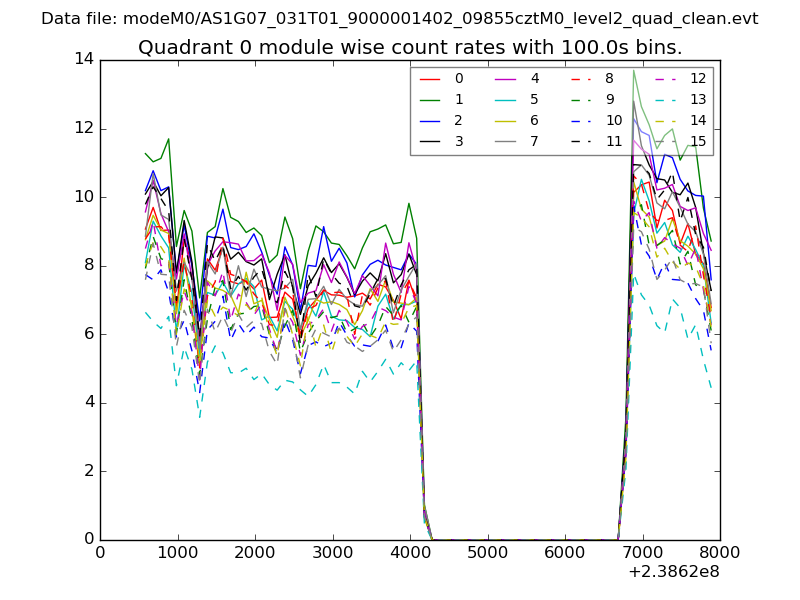
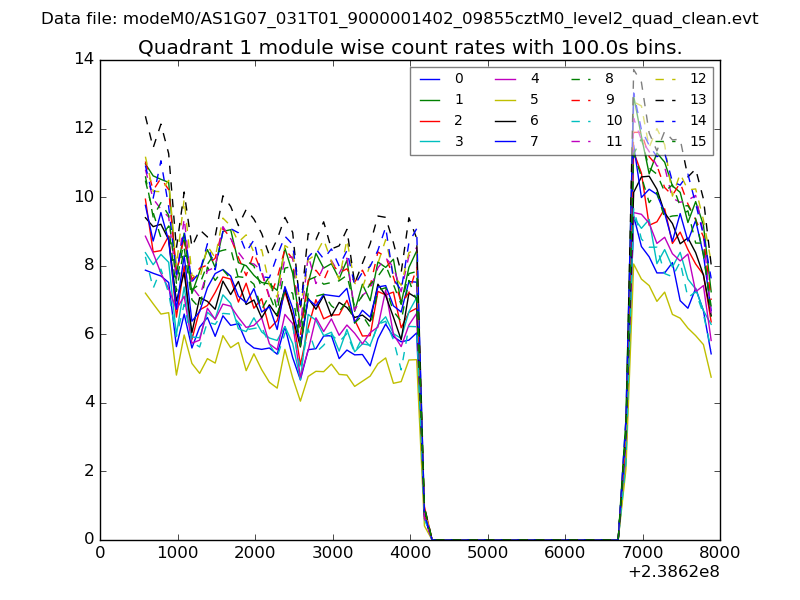
| Quadrant-wise count rates Data is divided into 100 sec bins |
 |
|
| Module-wise count rates for Quadrant A Data is divided into 100 sec bins |
 |
 |
| Module-wise count rates for Quadrant B Data is divided into 100 sec bins |
 |
 |
| Module-wise count rates for Quadrant C Data is divided into 100 sec bins |
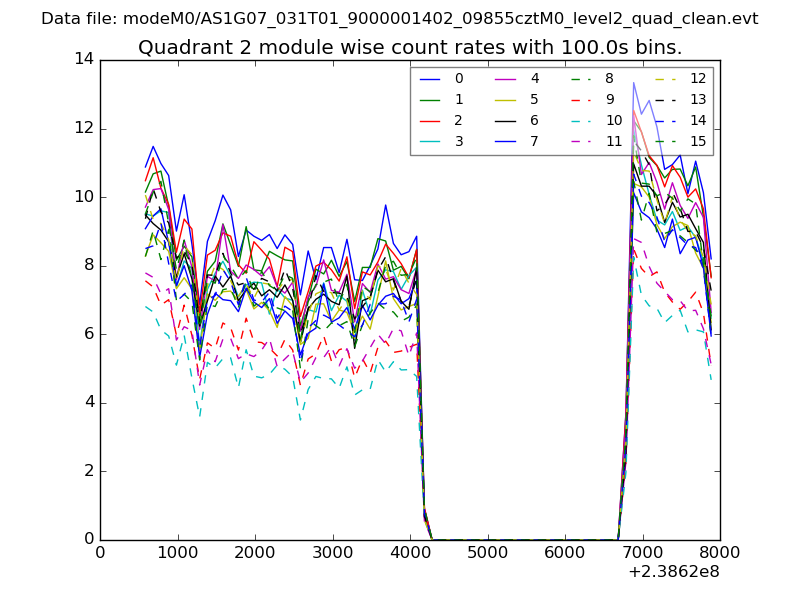 |
 |
| Module-wise count rates for Quadrant D Data is divided into 100 sec bins |
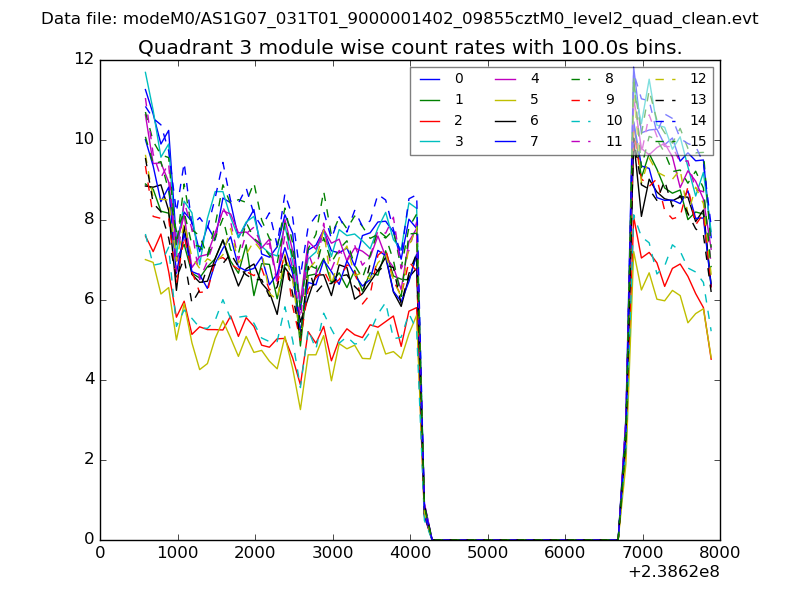 |
 |
| Parameter | Plot |
|---|---|
| CZT HV Monitor | 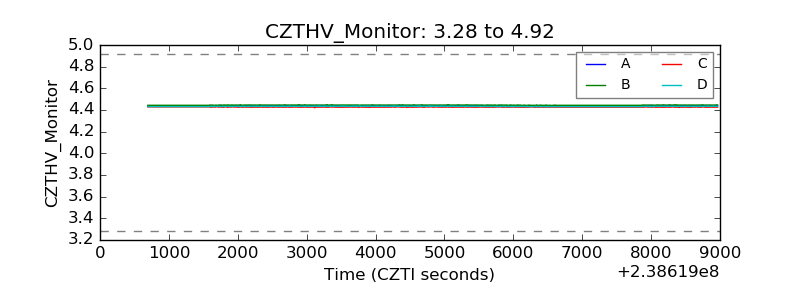 |
| D_VDD | 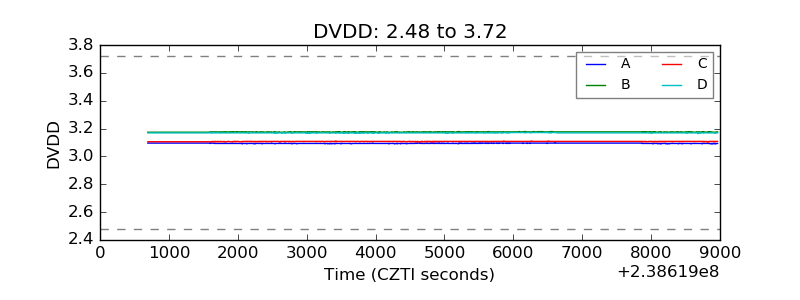 |
| Temperature 1 | 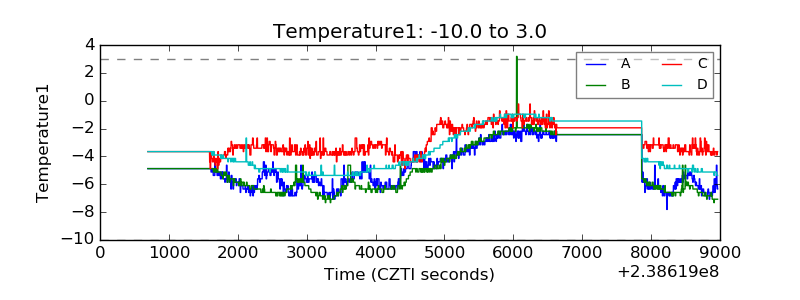 |
| Veto HV Monitor |  |
| Veto LLD | 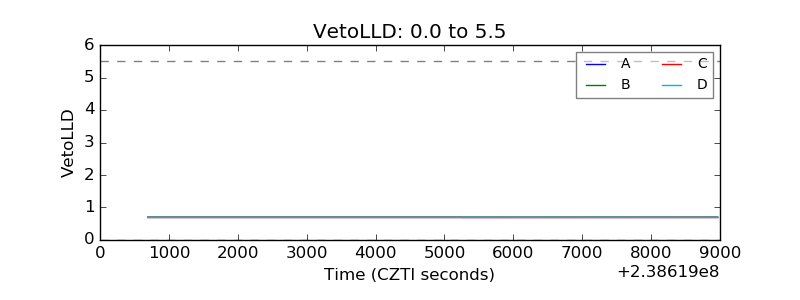 |
| Alpha Counter | 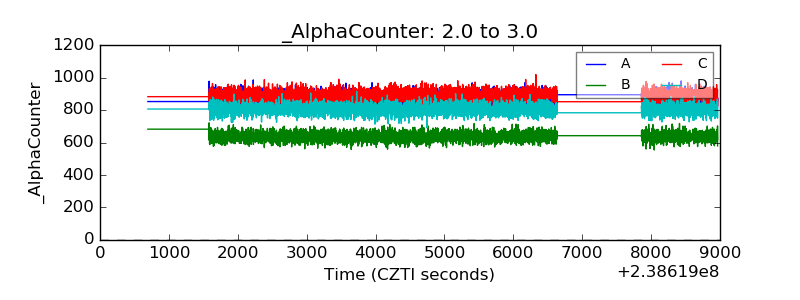 |
| _CPM_Rate | 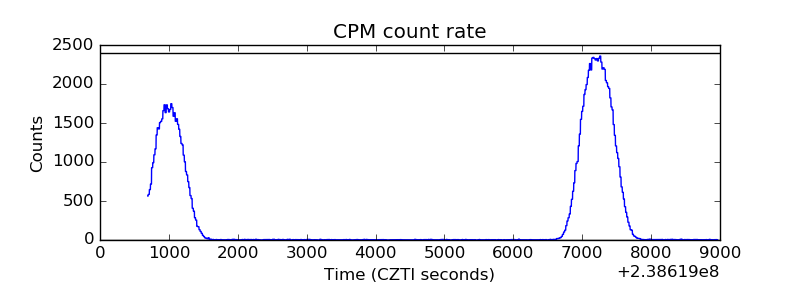 |
| CZT Counter | 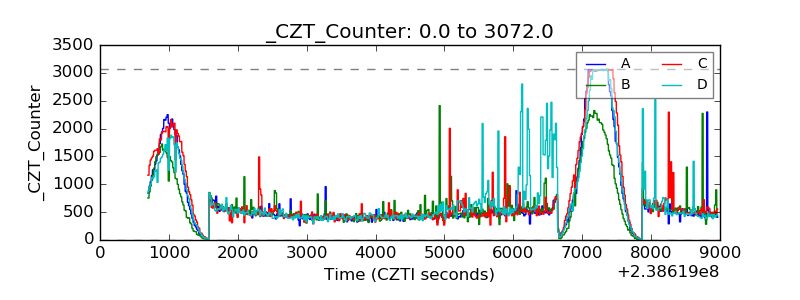 |
| +2.5 Volts monitor |  |
| +5 Volts monitor |  |
| _ROLL_ROT | 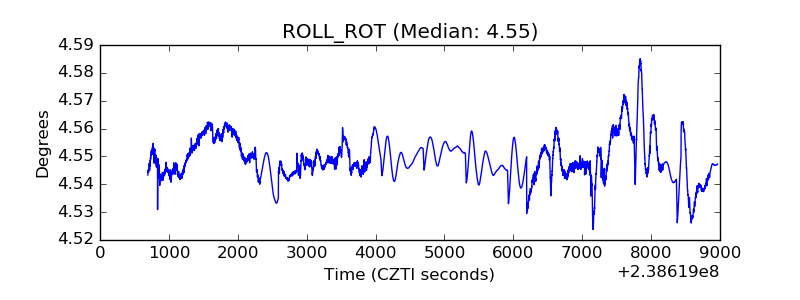 |
| _Roll_DEC | 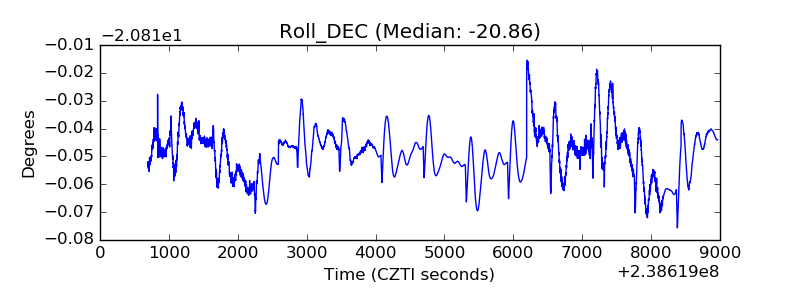 |
| _Roll_RA | 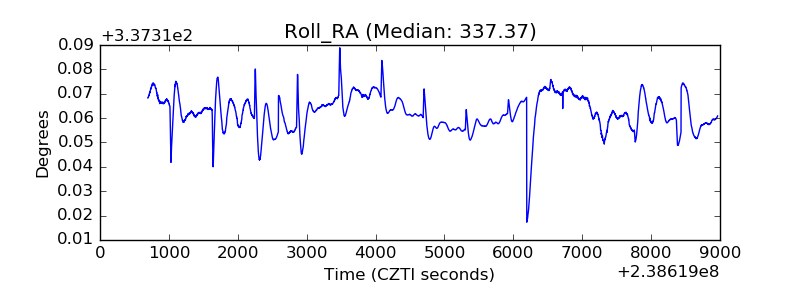 |
| Veto Counter | 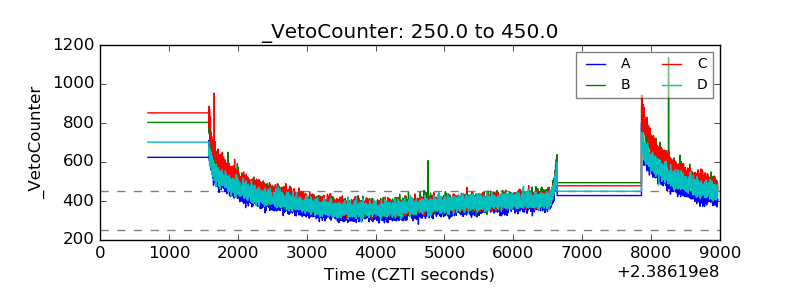 |