| Param | Original file | Final file |
|---|---|---|
| Filename | modeM0/AS1G07_028T01_9000001406cztM0_level2.fits | modeM0/AS1G07_028T01_9000001406cztM0_level2_quad_clean.evt |
| Size (bytes) | 123,586,560 | 136,137,600 |
| Size | 117.9 MB | 129.8 MB |
| Events in quadrant A | 735,530 | 829,907 |
| Events in quadrant B | 713,002 | 840,906 |
| Events in quadrant C | 727,876 | 789,458 |
| Events in quadrant D | 629,336 | 725,013 |
| Mode M0 | |||
|---|---|---|---|
| Quadrant | BADHDUFLAG | Total packets | Discarded packets |
| A | 0 | 27819 | 0 |
| B | 0 | 27993 | 0 |
| C | 0 | 27686 | 0 |
| D | 0 | 28730 | 0 |
| Mode SS | |||
|---|---|---|---|
| Quadrant | BADHDUFLAG | Total packets | Discarded packets |
| A | 0 | 276 | 0 |
| B | 0 | 276 | 0 |
| C | 0 | 276 | 0 |
| D | 0 | 276 | 0 |
| Mode M9 | |||
|---|---|---|---|
| Quadrant | BADHDUFLAG | Total packets | Discarded packets |
| A | 0 | 10 | 0 |
| B | 0 | 10 | 0 |
| C | 0 | 10 | 0 |
| D | 0 | 10 | 0 |
| Quadrant | Total seconds | Saturated seconds | Saturation percentage |
|---|---|---|---|
| A | 13566 | 180 | 1.326847% |
| B | 13566 | 180 | 1.326847% |
| C | 13566 | 125 | 0.921421% |
| D | 13566 | 136 | 1.002506% |
Noise dominated data is calculated using 1-second bins in cleaned event files. If a bin has >2000 counts, and if more than 50% of those come from <1% of pixels, then it is considered to be noise-dominated and hence unusable.
| Quadrant | # 1 sec bins | Bins with >0 counts | Bins with >2000 counts | High rate bins dominated by noise | Noise dominated (total time) | Noise dominated (detector-on time) | Marked lightcurve |
|---|---|---|---|---|---|---|---|
| A | 14626 | 13567 | 0 | 0 | 0.00% | 0.00% |  |
| B | 14626 | 13566 | 0 | 0 | 0.00% | 0.00% |  |
| C | 14626 | 13566 | 0 | 0 | 0.00% | 0.00% |  |
| D | 14626 | 13565 | 0 | 0 | 0.00% | 0.00% |  |
Top three noisy pixels from each quadrant. If the there are fewer than three noisy pixels in the level2.evt file, extra rows are filled as -1
| Pixel properties | Quadrant properties | ||||||
|---|---|---|---|---|---|---|---|
| Quadrant | DetID | PixID | Counts | Sigma | Mean | Median | Sigma |
| A | 0 | 29 | 733 | 10.95 | 190 | 178 | 50.7 |
| A | 14 | 188 | 729 | 10.87 | 190 | 178 | 50.7 |
| A | 14 | 204 | 680 | 9.9 | 190 | 178 | 50.7 |
| B | 2 | 9 | 597 | 10.22 | 187 | 177 | 41.1 |
| B | 3 | 17 | 500 | 7.86 | 187 | 177 | 41.1 |
| B | 14 | 254 | 499 | 7.84 | 187 | 177 | 41.1 |
| C | 2 | 191 | 531 | 6.74 | 191 | 177 | 52.5 |
| C | 1 | 80 | 516 | 6.45 | 191 | 177 | 52.5 |
| C | 12 | 241 | 507 | 6.28 | 191 | 177 | 52.5 |
| D | 1 | 19 | 492 | 6.6 | 178 | 161 | 50.2 |
| D | 6 | 231 | 460 | 5.96 | 178 | 161 | 50.2 |
| D | 3 | 14 | 456 | 5.88 | 178 | 161 | 50.2 |
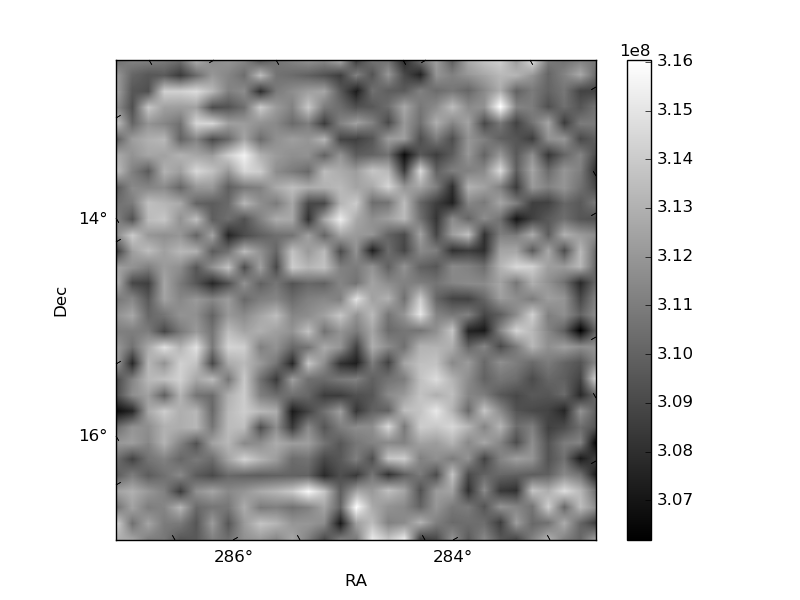
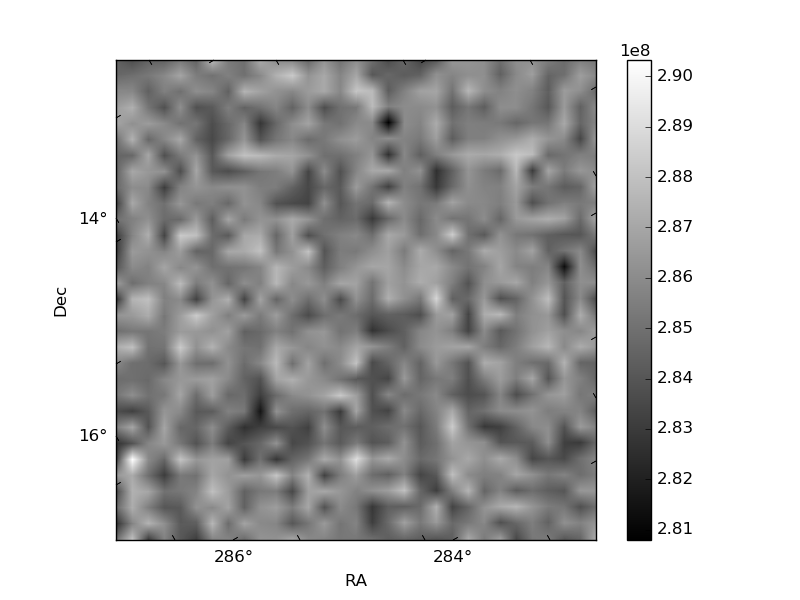
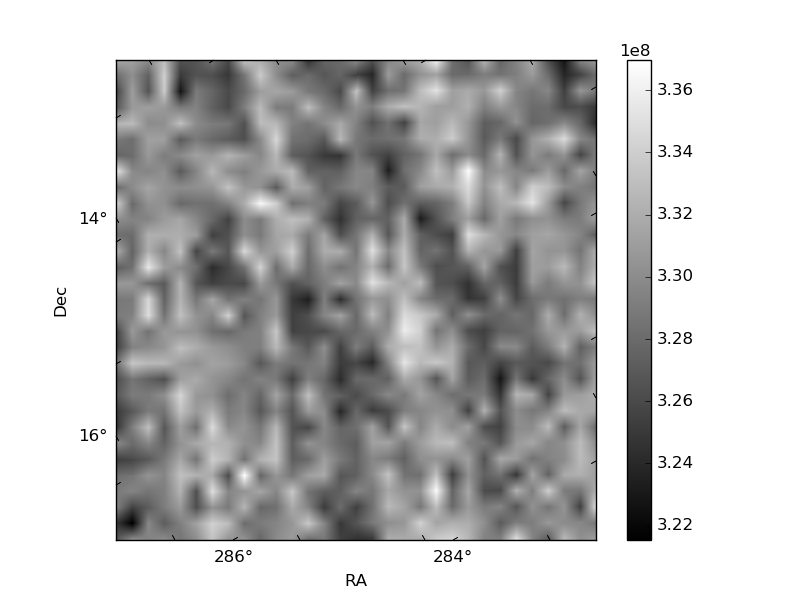
Histogram calculated using DETX and DETY for each event in the final _common_clean file
| Quadrant A |  |
 |
Quadrant B |
|---|---|---|---|
| Quadrant D |  |
 |
Quadrant C |
| Plot type | Count rate plots | Images |
|---|---|---|
| Comparison with Poisson distribution Blue bars denote a histogram of data divided into 1 sec bins. Red curve is a Poisson curve with rate = median count rate of data. |
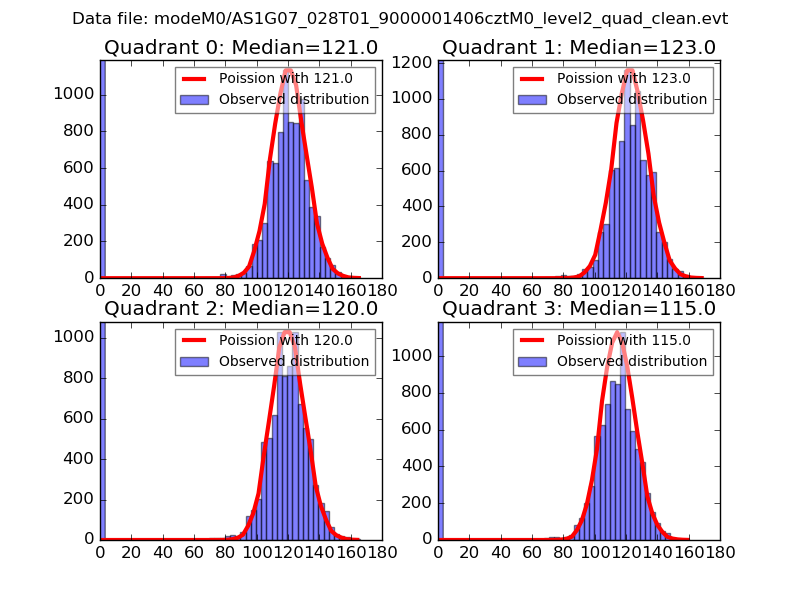 |
 |
| Quadrant-wise count rates Data is divided into 100 sec bins |
 |
|
| Module-wise count rates for Quadrant A Data is divided into 100 sec bins |
 |
 |
| Module-wise count rates for Quadrant B Data is divided into 100 sec bins |
 |
 |
| Module-wise count rates for Quadrant C Data is divided into 100 sec bins |
 |
 |
| Module-wise count rates for Quadrant D Data is divided into 100 sec bins |
 |
 |
| Parameter | Plot |
|---|---|
| CZT HV Monitor | 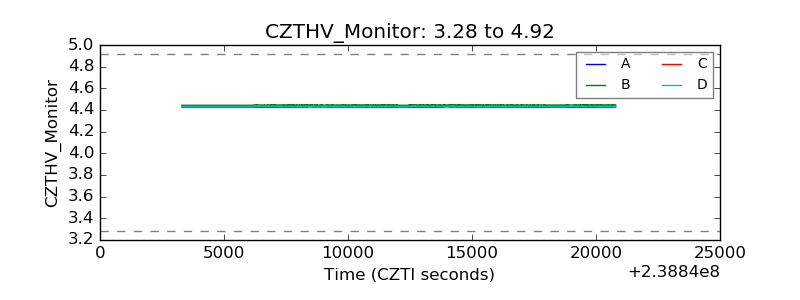 |
| D_VDD | 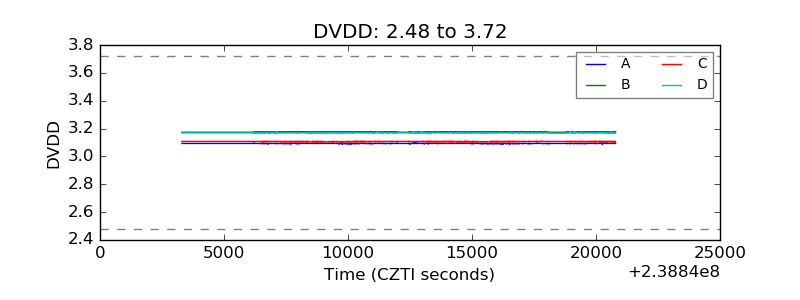 |
| Temperature 1 |  |
| Veto HV Monitor |  |
| Veto LLD |  |
| Alpha Counter |  |
| _CPM_Rate |  |
| CZT Counter |  |
| +2.5 Volts monitor | 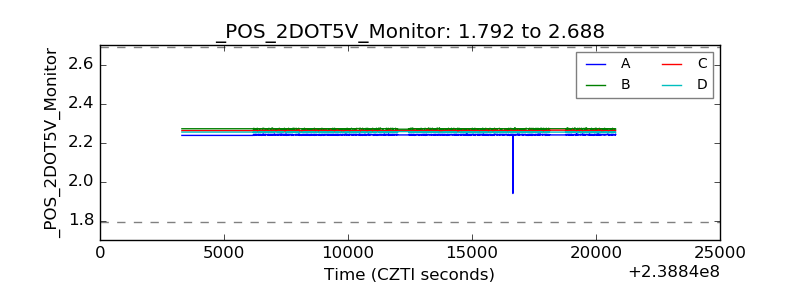 |
| +5 Volts monitor |  |
| _ROLL_ROT |  |
| _Roll_DEC |  |
| _Roll_RA | 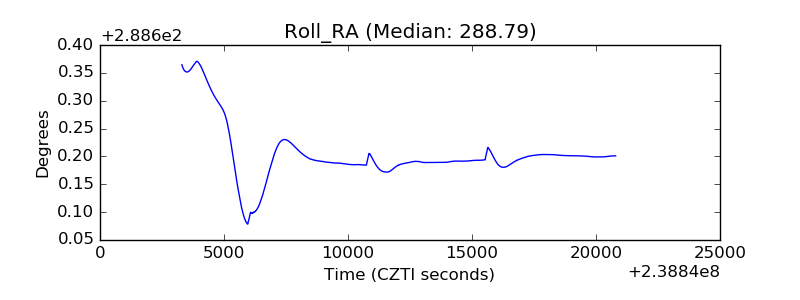 |
| Veto Counter |  |