| Param | Original file | Final file |
|---|---|---|
| Filename | modeM0/AS1G07_046T01_9000001408cztM0_level2.fits | modeM0/AS1G07_046T01_9000001408cztM0_level2_quad_clean.evt |
| Size (bytes) | 400,409,280 | 287,663,040 |
| Size | 381.9 MB | 274.3 MB |
| Events in quadrant A | 2,429,040 | 1,522,460 |
| Events in quadrant B | 2,371,318 | 1,544,855 |
| Events in quadrant C | 2,409,386 | 1,477,946 |
| Events in quadrant D | 2,064,008 | 1,312,583 |
| Mode M0 | |||
|---|---|---|---|
| Quadrant | BADHDUFLAG | Total packets | Discarded packets |
| A | 0 | 87708 | 0 |
| B | 0 | 87621 | 0 |
| C | 0 | 85465 | 0 |
| D | 0 | 93857 | 0 |
| Mode SS | |||
|---|---|---|---|
| Quadrant | BADHDUFLAG | Total packets | Discarded packets |
| A | 0 | 856 | 0 |
| B | 0 | 848 | 0 |
| C | 0 | 852 | 0 |
| D | 0 | 850 | 0 |
| Mode M9 | |||
|---|---|---|---|
| Quadrant | BADHDUFLAG | Total packets | Discarded packets |
| A | 0 | 89 | 0 |
| B | 0 | 92 | 0 |
| C | 0 | 89 | 0 |
| D | 0 | 90 | 0 |
| Quadrant | Total seconds | Saturated seconds | Saturation percentage |
|---|---|---|---|
| A | 41556 | 427 | 1.027529% |
| B | 41517 | 422 | 1.016451% |
| C | 41476 | 224 | 0.540071% |
| D | 41504 | 705 | 1.698631% |
Noise dominated data is calculated using 1-second bins in cleaned event files. If a bin has >2000 counts, and if more than 50% of those come from <1% of pixels, then it is considered to be noise-dominated and hence unusable.
| Quadrant | # 1 sec bins | Bins with >0 counts | Bins with >2000 counts | High rate bins dominated by noise | Noise dominated (total time) | Noise dominated (detector-on time) | Marked lightcurve |
|---|---|---|---|---|---|---|---|
| A | 52028 | 42080 | 0 | 0 | 0.00% | 0.00% | 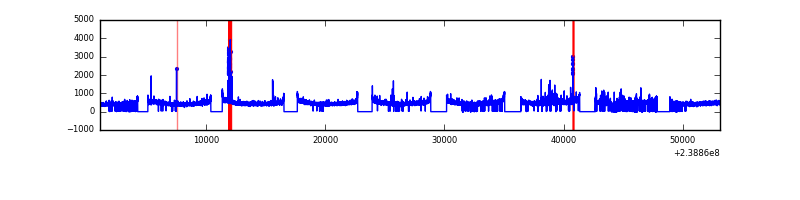 |
| B | 52028 | 42060 | 0 | 0 | 0.00% | 0.00% |  |
| C | 52028 | 42080 | 0 | 0 | 0.00% | 0.00% | 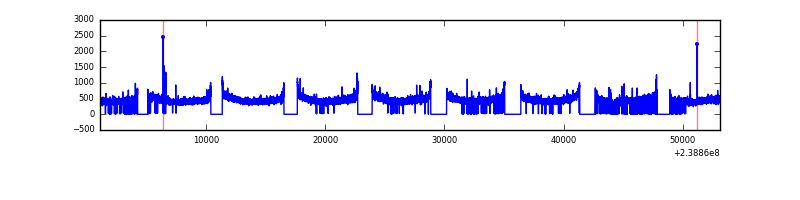 |
| D | 52028 | 42013 | 0 | 0 | 0.00% | 0.00% | 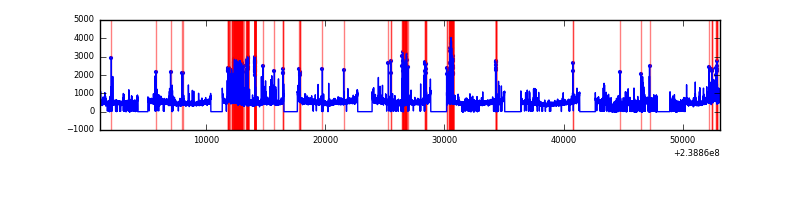 |
Top three noisy pixels from each quadrant. If the there are fewer than three noisy pixels in the level2.evt file, extra rows are filled as -1
| Pixel properties | Quadrant properties | ||||||
|---|---|---|---|---|---|---|---|
| Quadrant | DetID | PixID | Counts | Sigma | Mean | Median | Sigma |
| A | 0 | 29 | 2419 | 11.52 | 630 | 591 | 158.6 |
| A | 7 | 110 | 1979 | 8.75 | 630 | 591 | 158.6 |
| A | 0 | 30 | 1795 | 7.59 | 630 | 591 | 158.6 |
| B | 2 | 9 | 1991 | 11.17 | 623 | 594 | 125.0 |
| B | 3 | 17 | 1593 | 7.99 | 623 | 594 | 125.0 |
| B | 14 | 254 | 1579 | 7.88 | 623 | 594 | 125.0 |
| C | 1 | 81 | 1747 | 6.86 | 636 | 592 | 168.4 |
| C | 1 | 80 | 1745 | 6.85 | 636 | 592 | 168.4 |
| C | 12 | 241 | 1628 | 6.15 | 636 | 592 | 168.4 |
| D | 6 | 231 | 1527 | 6.26 | 588 | 535 | 158.5 |
| D | 6 | 83 | 1468 | 5.89 | 588 | 535 | 158.5 |
| D | 3 | 14 | 1461 | 5.84 | 588 | 535 | 158.5 |
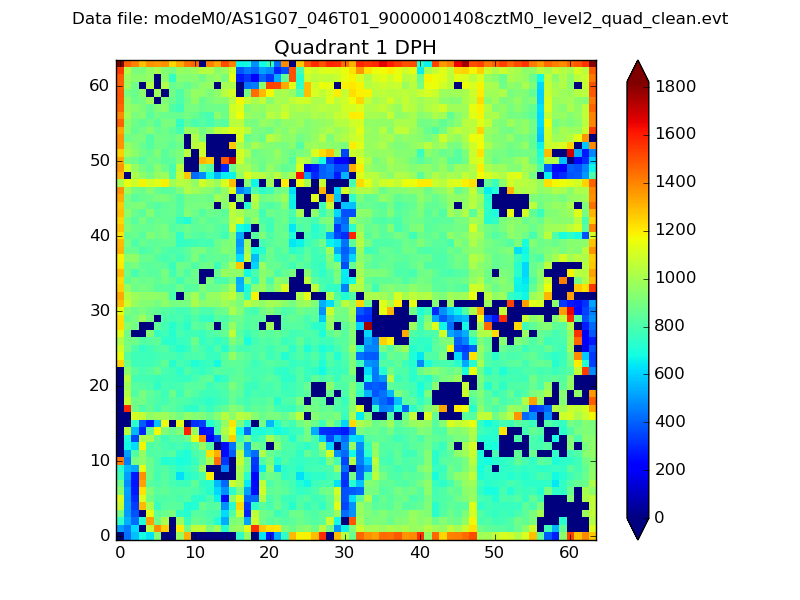
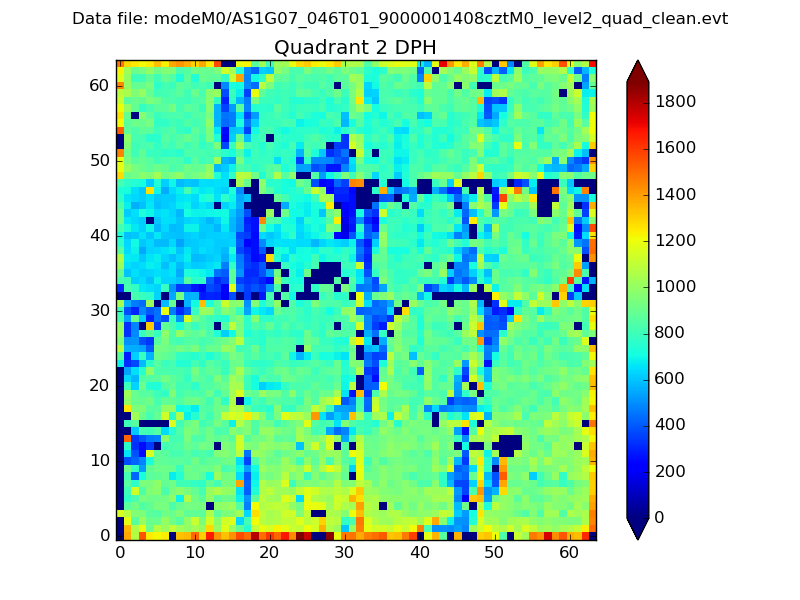
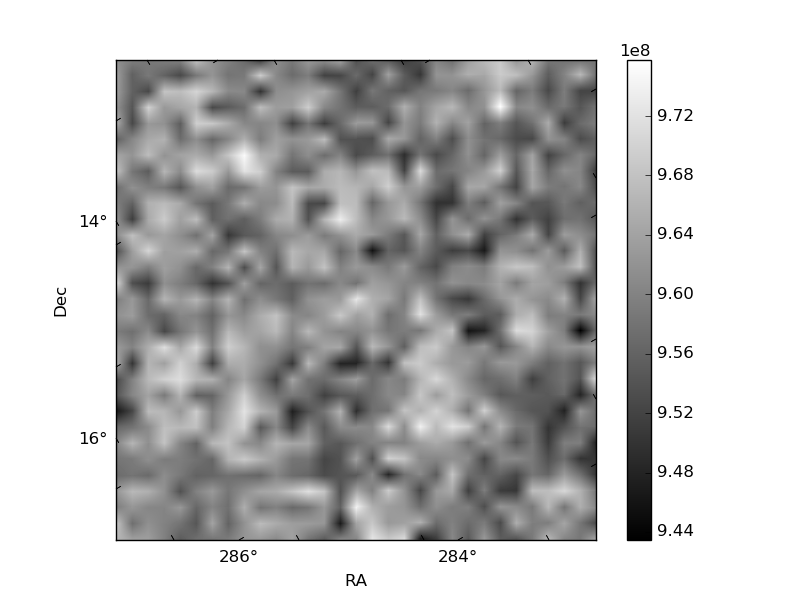
Histogram calculated using DETX and DETY for each event in the final _common_clean file
| Quadrant A | 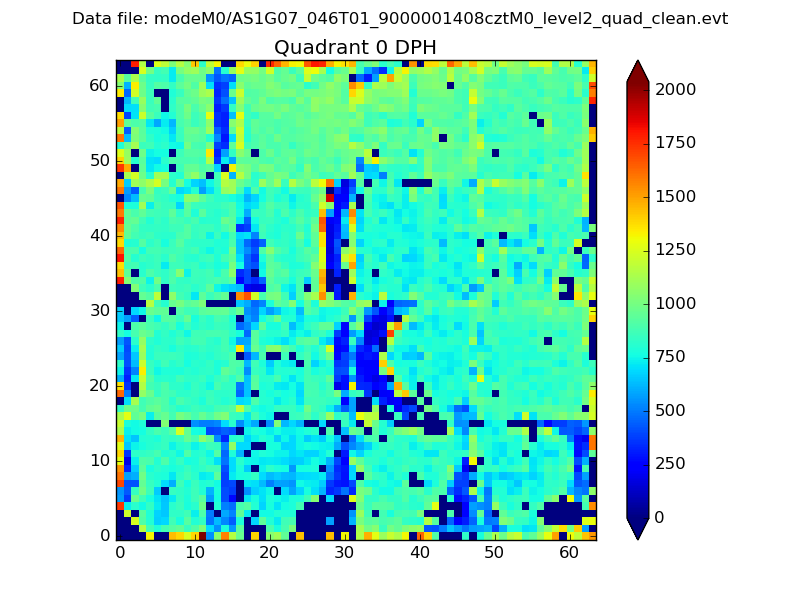 |
 |
Quadrant B |
|---|---|---|---|
| Quadrant D |  |
 |
Quadrant C |
| Plot type | Count rate plots | Images |
|---|---|---|
| Comparison with Poisson distribution Blue bars denote a histogram of data divided into 1 sec bins. Red curve is a Poisson curve with rate = median count rate of data. |
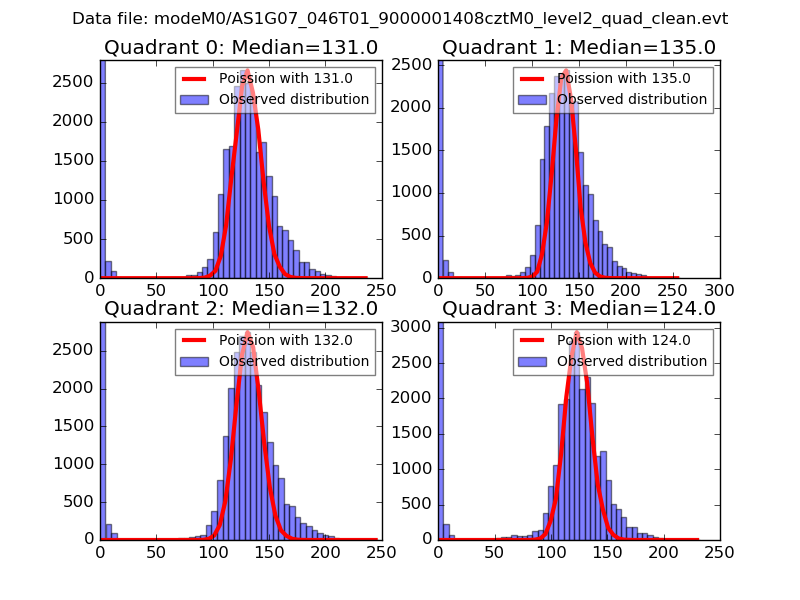 |
 |
| Quadrant-wise count rates Data is divided into 100 sec bins |
 |
|
| Module-wise count rates for Quadrant A Data is divided into 100 sec bins |
 |
 |
| Module-wise count rates for Quadrant B Data is divided into 100 sec bins |
 |
 |
| Module-wise count rates for Quadrant C Data is divided into 100 sec bins |
 |
 |
| Module-wise count rates for Quadrant D Data is divided into 100 sec bins |
 |
 |
| Parameter | Plot |
|---|---|
| CZT HV Monitor |  |
| D_VDD | 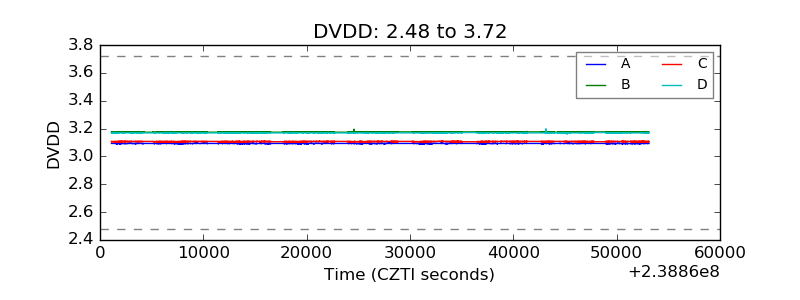 |
| Temperature 1 | 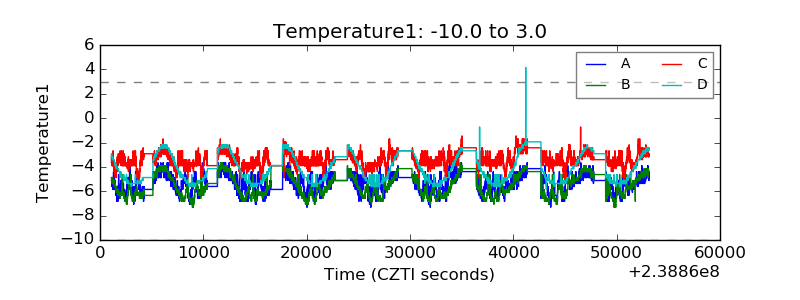 |
| Veto HV Monitor | 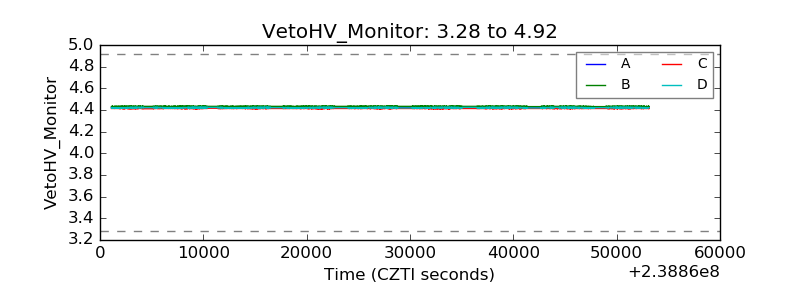 |
| Veto LLD |  |
| Alpha Counter |  |
| _CPM_Rate | 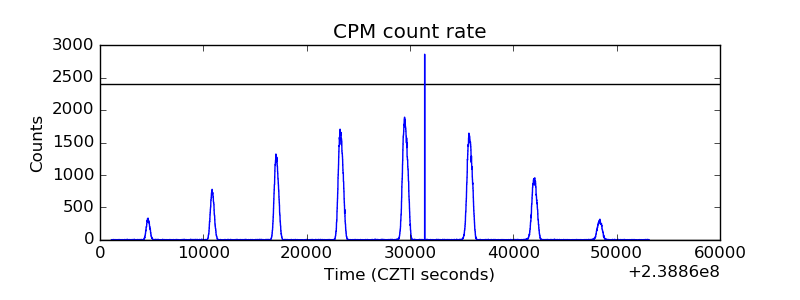 |
| CZT Counter |  |
| +2.5 Volts monitor |  |
| +5 Volts monitor |  |
| _ROLL_ROT |  |
| _Roll_DEC |  |
| _Roll_RA | 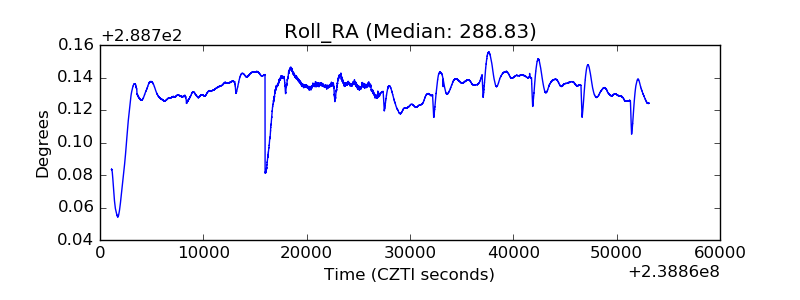 |
| Veto Counter | 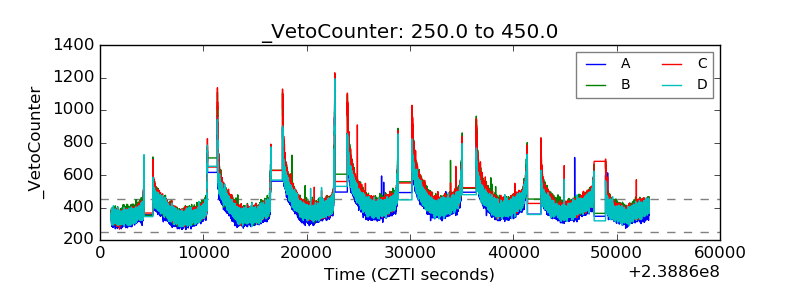 |