| Param | Original file | Final file |
|---|---|---|
| Filename | modeM0/AS1G07_046T01_9000001408_09894cztM0_level2.evt | modeM0/AS1G07_046T01_9000001408_09894cztM0_level2_quad_clean.evt |
| Size (bytes) | 292,651,200 | 59,783,040 |
| Size | 279.1 MB | 57.0 MB |
| Events in quadrant A | 2,020,991 | 379,616 |
| Events in quadrant B | 2,298,297 | 380,771 |
| Events in quadrant C | 1,989,482 | 377,068 |
| Events in quadrant D | 2,252,822 | 362,696 |
| Mode M0 | |||
|---|---|---|---|
| Quadrant | BADHDUFLAG | Total packets | Discarded packets |
| A | 0 | 9289 | 239 |
| B | 0 | 10165 | 330 |
| C | 0 | 9270 | 352 |
| D | 0 | 9706 | 295 |
| Mode SS | |||
|---|---|---|---|
| Quadrant | BADHDUFLAG | Total packets | Discarded packets |
| A | 0 | 92 | 4 |
| B | 0 | 92 | 4 |
| C | 0 | 92 | 2 |
| D | 0 | 92 | 2 |
| Mode M9 | |||
|---|---|---|---|
| Quadrant | BADHDUFLAG | Total packets | Discarded packets |
| A | 0 | 9 | 0 |
| B | 0 | 9 | 0 |
| C | 0 | 9 | 0 |
| D | 0 | 9 | 0 |
| Quadrant | Total seconds | Saturated seconds | Saturation percentage |
|---|---|---|---|
| A | 4438 | 33 | 0.743578% |
| B | 4404 | 79 | 1.793824% |
| C | 4380 | 31 | 0.707763% |
| D | 4420 | 30 | 0.678733% |
Noise dominated data is calculated using 1-second bins in cleaned event files. If a bin has >2000 counts, and if more than 50% of those come from <1% of pixels, then it is considered to be noise-dominated and hence unusable.
| Quadrant | # 1 sec bins | Bins with >0 counts | Bins with >2000 counts | High rate bins dominated by noise | Noise dominated (total time) | Noise dominated (detector-on time) | Marked lightcurve |
|---|---|---|---|---|---|---|---|
| A | 5411 | 4546 | 0 | 0 | 0.00% | 0.00% | 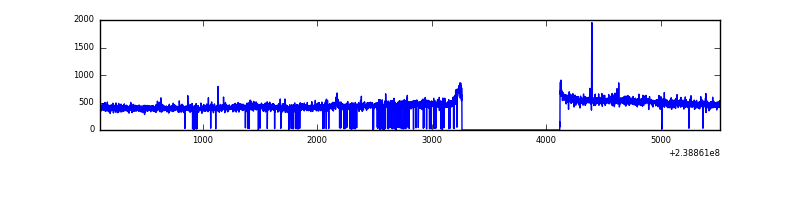 |
| B | 5410 | 4537 | 28 | 28 | 0.52% | 0.62% | 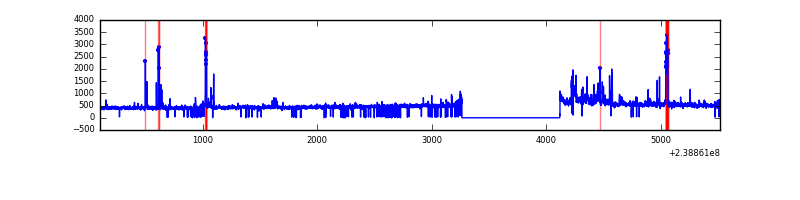 |
| C | 5411 | 4530 | 1 | 1 | 0.02% | 0.02% | 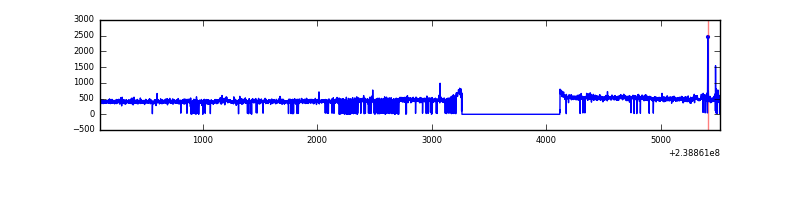 |
| D | 5411 | 4539 | 2 | 2 | 0.04% | 0.04% | 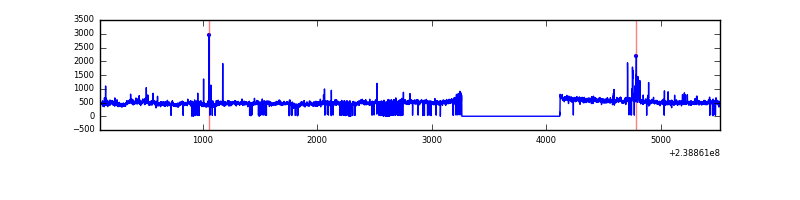 |
Top three noisy pixels from each quadrant. If the there are fewer than three noisy pixels in the level2.evt file, extra rows are filled as -1
| Pixel properties | Quadrant properties | ||||||
|---|---|---|---|---|---|---|---|
| Quadrant | DetID | PixID | Counts | Sigma | Mean | Median | Sigma |
| A | 14 | 111 | 8236 | 71.65 | 521 | 509 | 107.8 |
| A | 0 | 226 | 4734 | 39.18 | 521 | 509 | 107.8 |
| A | 12 | 194 | 4116 | 33.45 | 521 | 509 | 107.8 |
| B | 4 | 81 | 236038 | 2344.71 | 514 | 500 | 100.5 |
| B | 0 | 85 | 53928 | 531.86 | 514 | 500 | 100.5 |
| B | 12 | 111 | 12006 | 114.54 | 514 | 500 | 100.5 |
| C | 10 | 22 | 14705 | 120.28 | 502 | 504 | 118.1 |
| C | 9 | 221 | 12452 | 101.19 | 502 | 504 | 118.1 |
| C | 13 | 61 | 3613 | 26.33 | 502 | 504 | 118.1 |
| D | 8 | 195 | 258483 | 1959.51 | 499 | 488 | 131.7 |
| D | 13 | 104 | 34725 | 260.03 | 499 | 488 | 131.7 |
| D | 2 | 14 | 16184 | 119.21 | 499 | 488 | 131.7 |
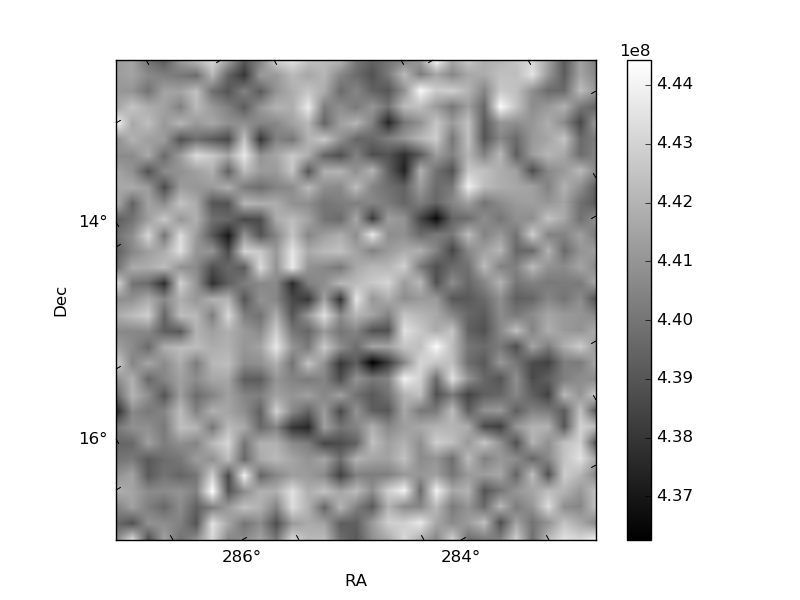
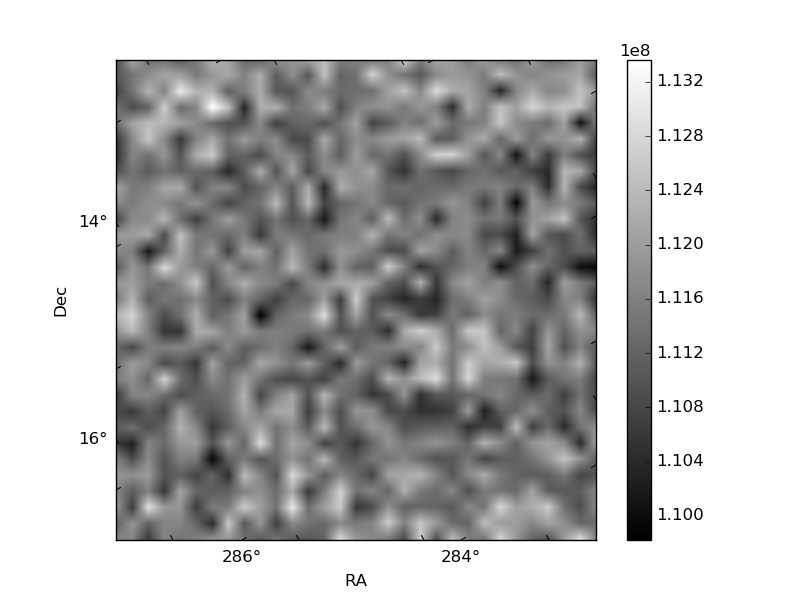
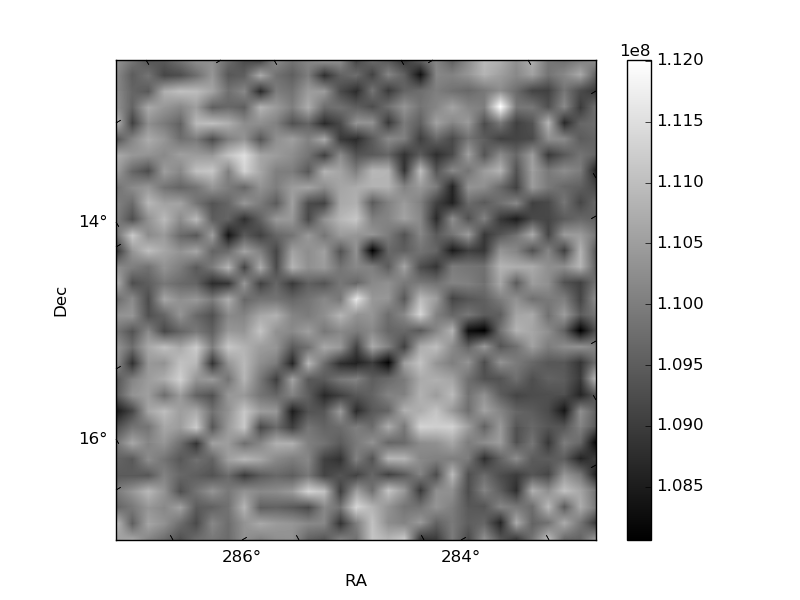
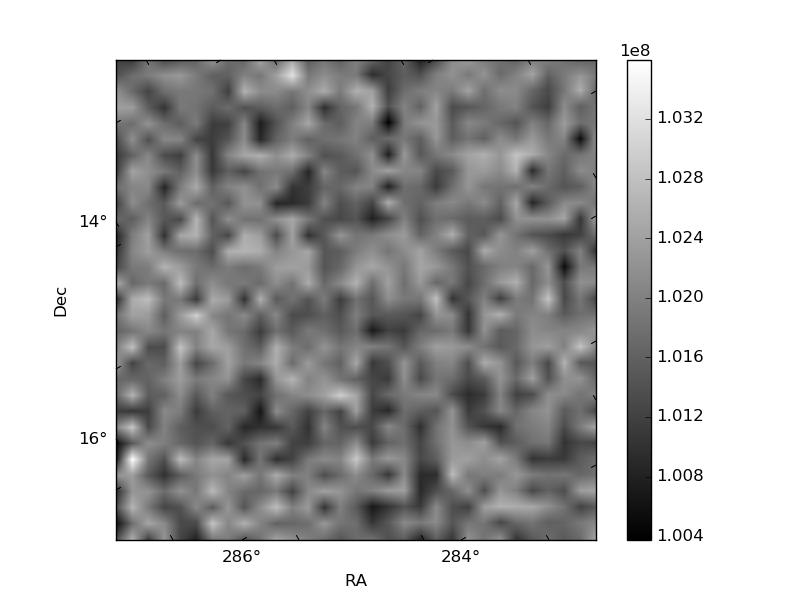
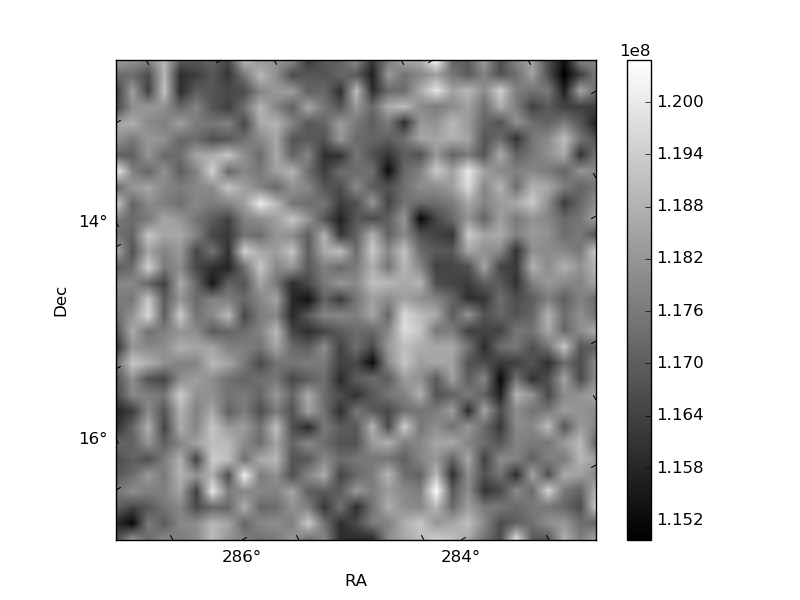
Histogram calculated using DETX and DETY for each event in the final _common_clean file
| Quadrant A | 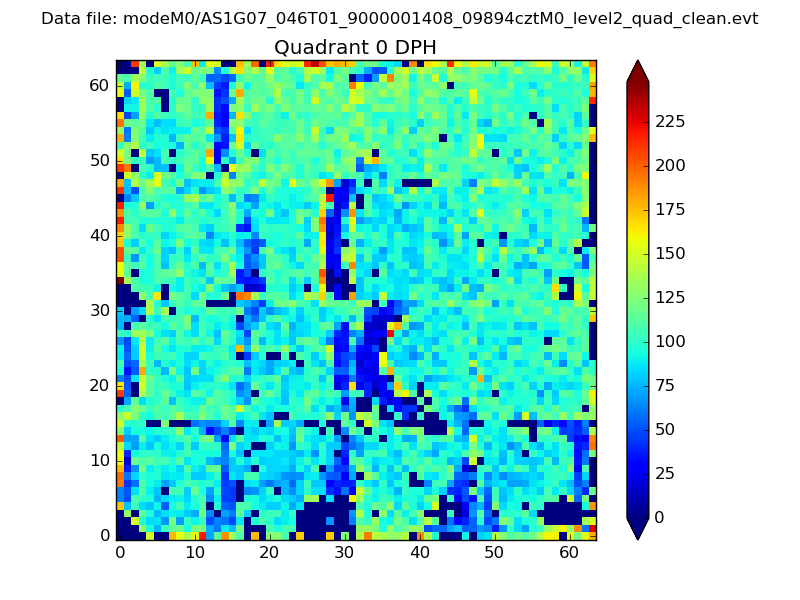 |
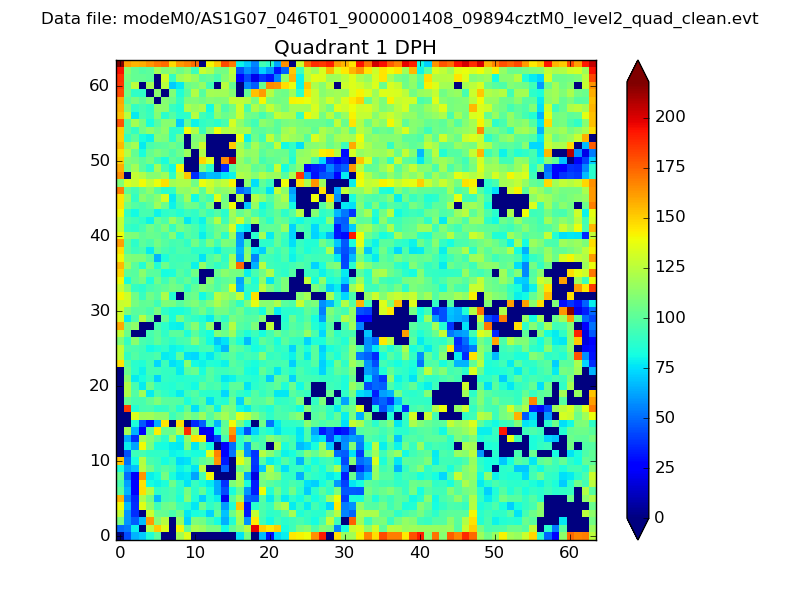 |
Quadrant B |
|---|---|---|---|
| Quadrant D | 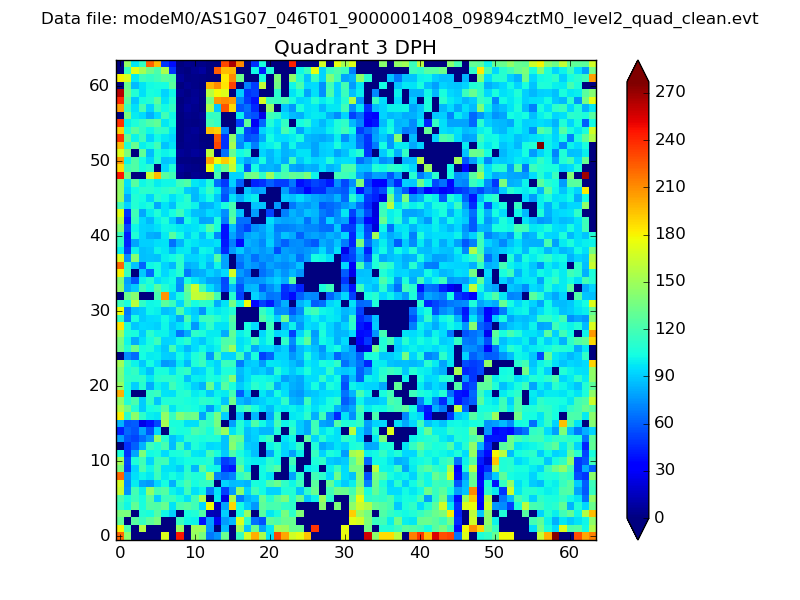 |
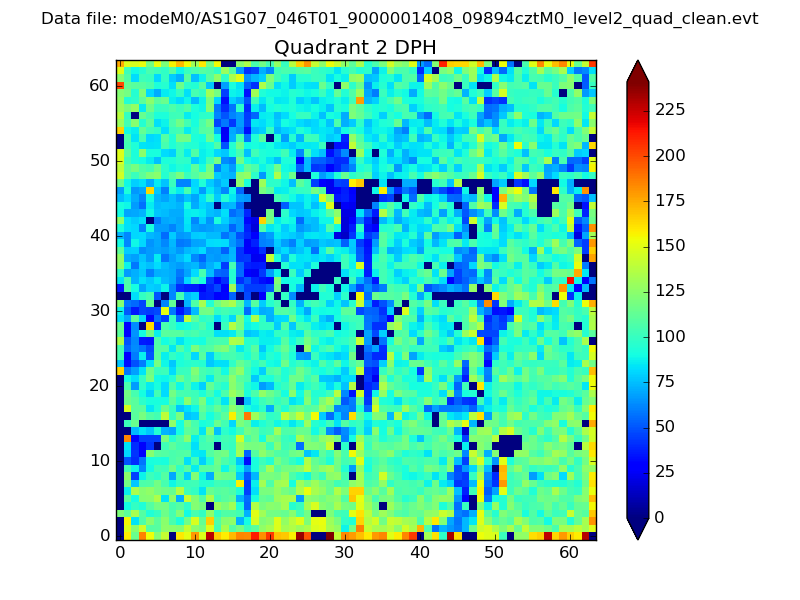 |
Quadrant C |
| Plot type | Count rate plots | Images |
|---|---|---|
| Comparison with Poisson distribution Blue bars denote a histogram of data divided into 1 sec bins. Red curve is a Poisson curve with rate = median count rate of data. |
 |
 |
| Quadrant-wise count rates Data is divided into 100 sec bins |
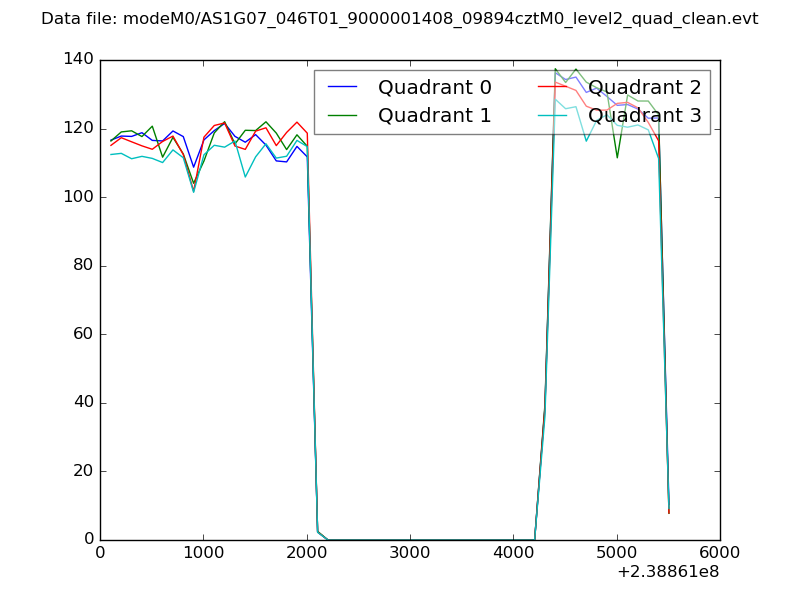 |
|
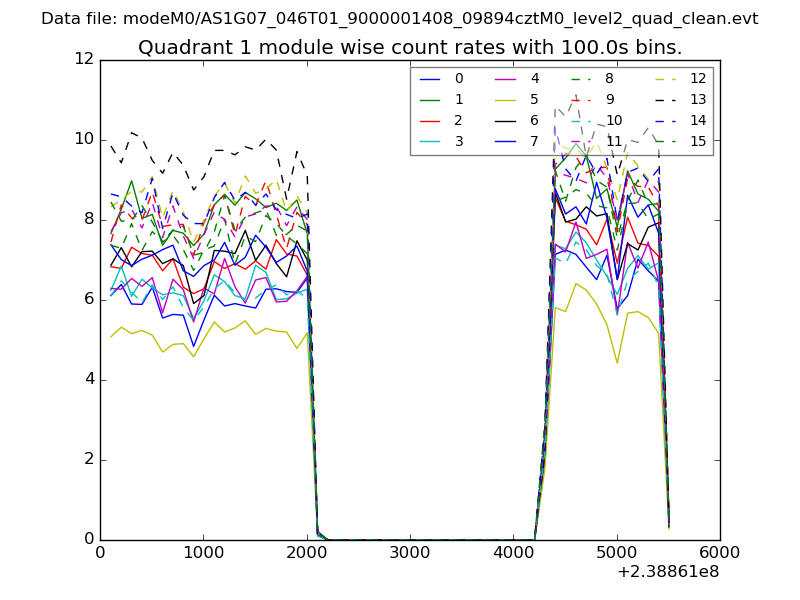
| Module-wise count rates for Quadrant A Data is divided into 100 sec bins |
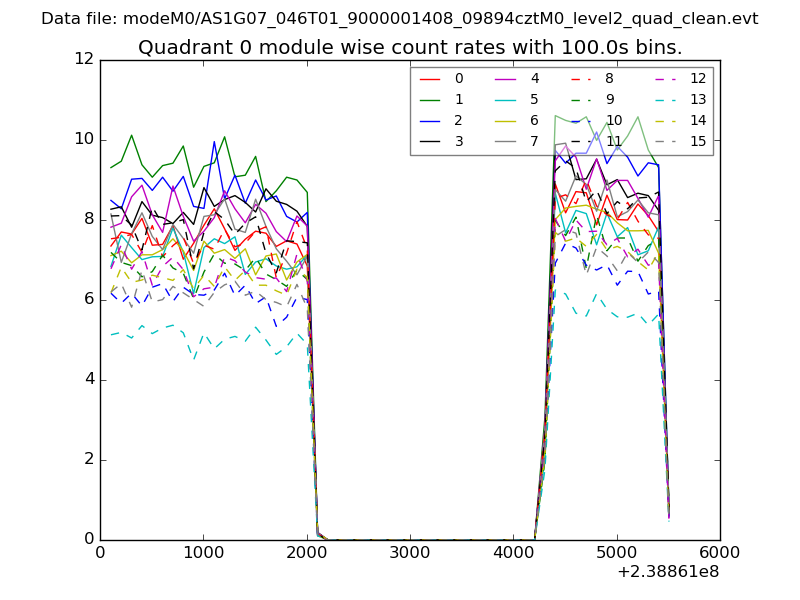 |
 |
| Module-wise count rates for Quadrant B Data is divided into 100 sec bins |
 |
 |
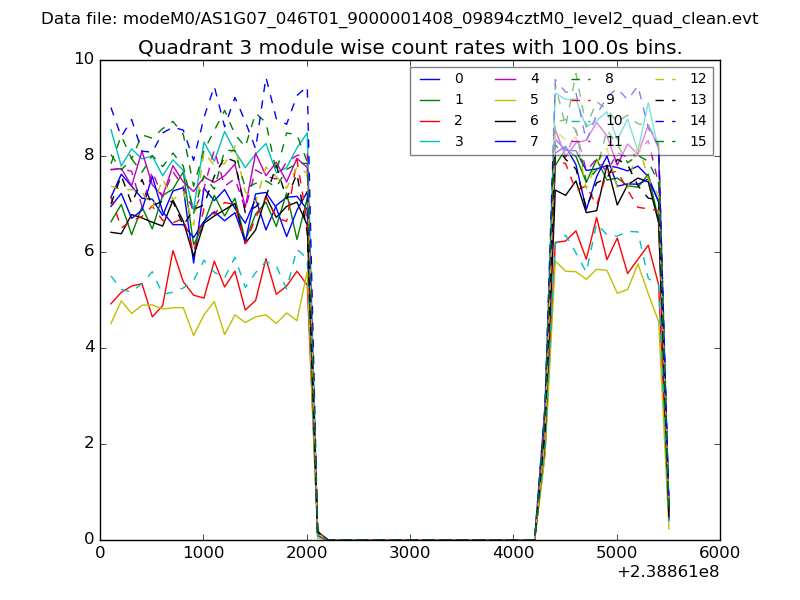
| Module-wise count rates for Quadrant C Data is divided into 100 sec bins |
 |
 |
| Module-wise count rates for Quadrant D Data is divided into 100 sec bins |
 |
 |
| Parameter | Plot |
|---|---|
| CZT HV Monitor | 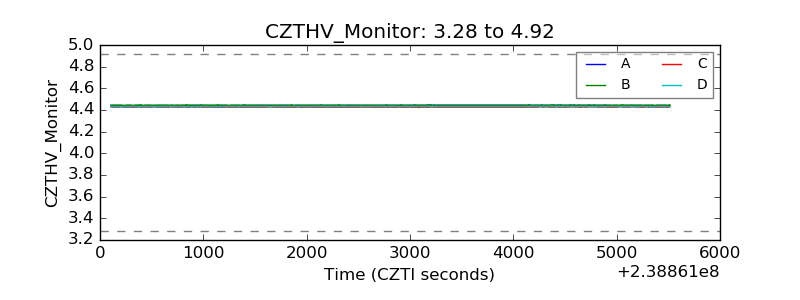 |
| D_VDD | 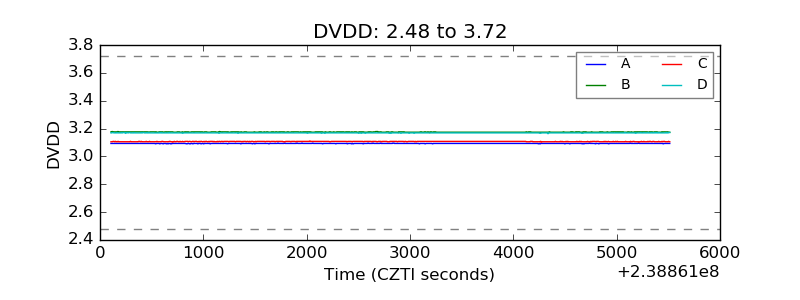 |
| Temperature 1 |  |
| Veto HV Monitor | 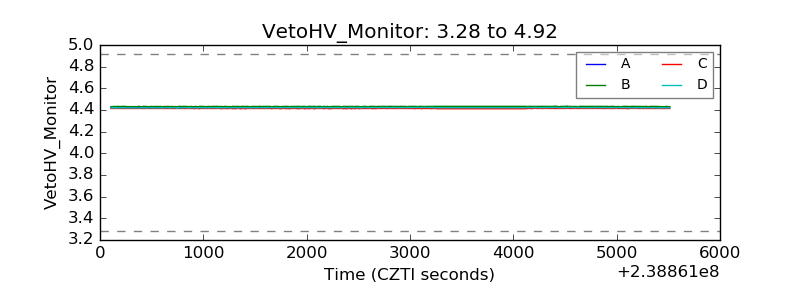 |
| Veto LLD | 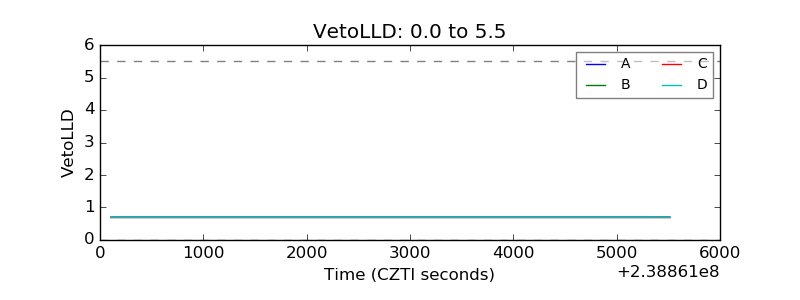 |
| Alpha Counter | 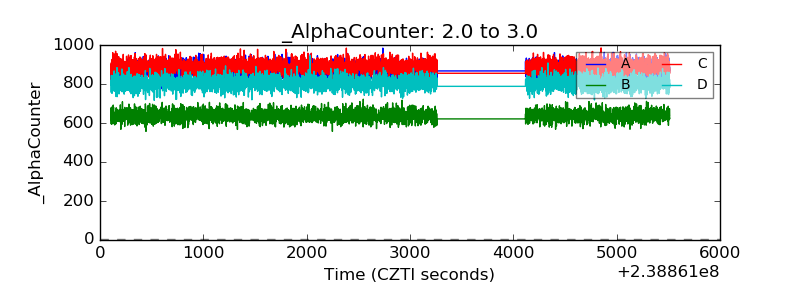 |
| _CPM_Rate | 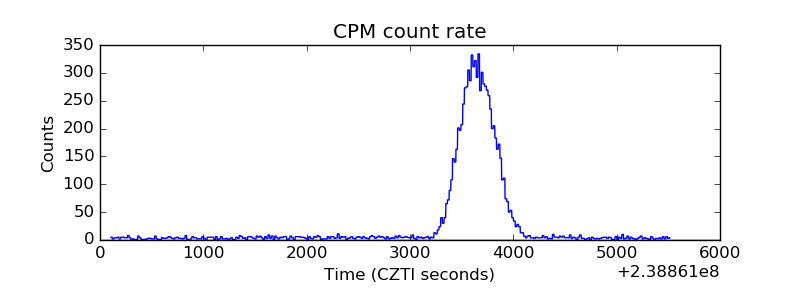 |
| CZT Counter | 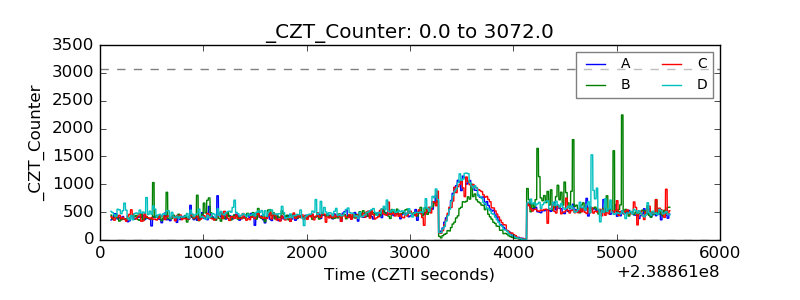 |
| +2.5 Volts monitor |  |
| +5 Volts monitor | 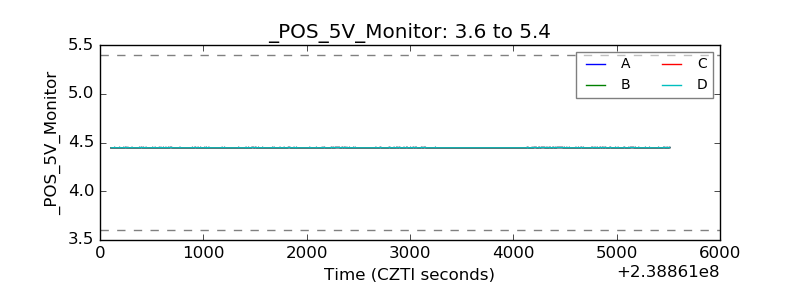 |
| _ROLL_ROT | 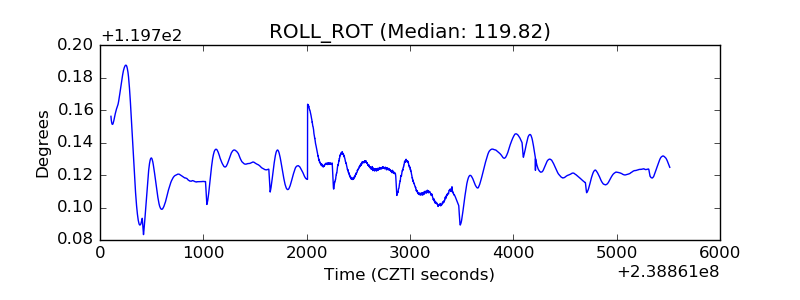 |
| _Roll_DEC | 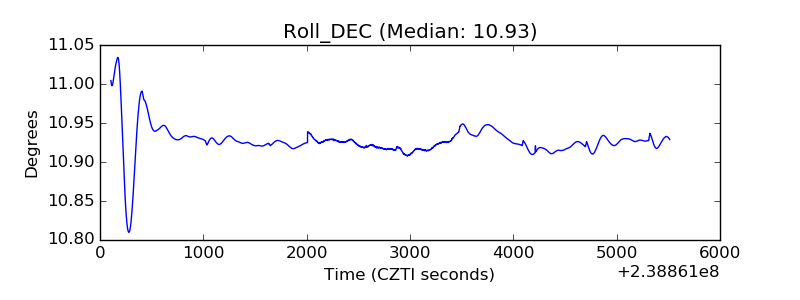 |
| _Roll_RA | 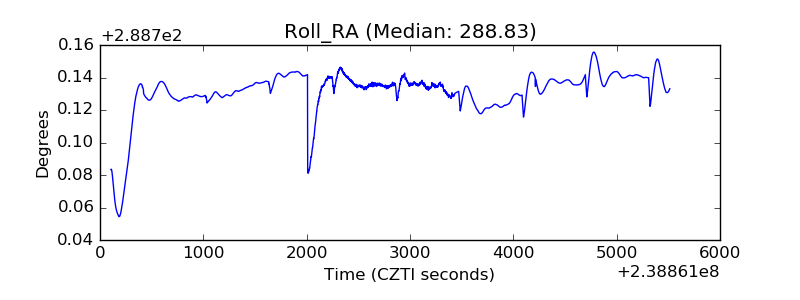 |
| Veto Counter | 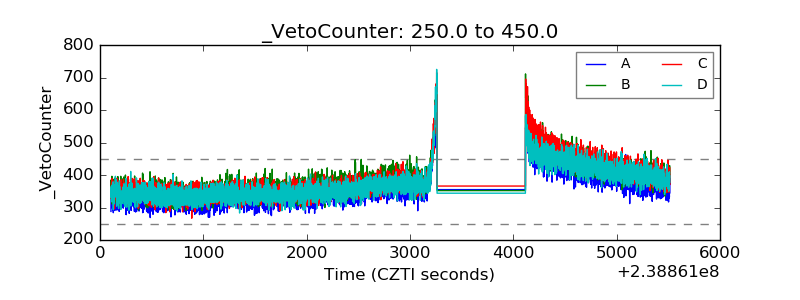 |