| Param | Original file | Final file |
|---|---|---|
| Filename | modeM0/AS1G07_046T01_9000001408_09895cztM0_level2.evt | modeM0/AS1G07_046T01_9000001408_09895cztM0_level2_quad_clean.evt |
| Size (bytes) | 680,451,840 | 136,753,920 |
| Size | 648.9 MB | 130.4 MB |
| Events in quadrant A | 4,771,826 | 862,667 |
| Events in quadrant B | 5,058,545 | 887,419 |
| Events in quadrant C | 4,483,635 | 880,635 |
| Events in quadrant D | 5,622,748 | 825,355 |
| Mode M0 | |||
|---|---|---|---|
| Quadrant | BADHDUFLAG | Total packets | Discarded packets |
| A | 0 | 21211 | 37 |
| B | 0 | 21723 | 36 |
| C | 0 | 20329 | 46 |
| D | 0 | 23176 | 60 |
| Mode SS | |||
|---|---|---|---|
| Quadrant | BADHDUFLAG | Total packets | Discarded packets |
| A | 0 | 202 | 2 |
| B | 0 | 202 | 0 |
| C | 0 | 202 | 0 |
| D | 0 | 202 | 0 |
| Mode M9 | |||
|---|---|---|---|
| Quadrant | BADHDUFLAG | Total packets | Discarded packets |
| A | 0 | 18 | 0 |
| B | 0 | 18 | 0 |
| C | 0 | 18 | 0 |
| D | 0 | 18 | 0 |
| Quadrant | Total seconds | Saturated seconds | Saturation percentage |
|---|---|---|---|
| A | 9894 | 215 | 2.173034% |
| B | 9894 | 180 | 1.819284% |
| C | 9889 | 87 | 0.879765% |
| D | 9889 | 324 | 3.276368% |
Noise dominated data is calculated using 1-second bins in cleaned event files. If a bin has >2000 counts, and if more than 50% of those come from <1% of pixels, then it is considered to be noise-dominated and hence unusable.
| Quadrant | # 1 sec bins | Bins with >0 counts | Bins with >2000 counts | High rate bins dominated by noise | Noise dominated (total time) | Noise dominated (detector-on time) | Marked lightcurve |
|---|---|---|---|---|---|---|---|
| A | 11730 | 9911 | 59 | 59 | 0.50% | 0.60% | 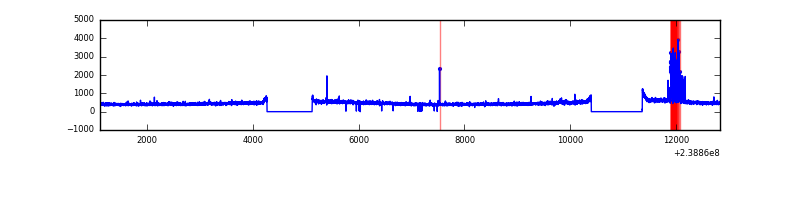 |
| B | 11730 | 9911 | 52 | 52 | 0.44% | 0.52% | 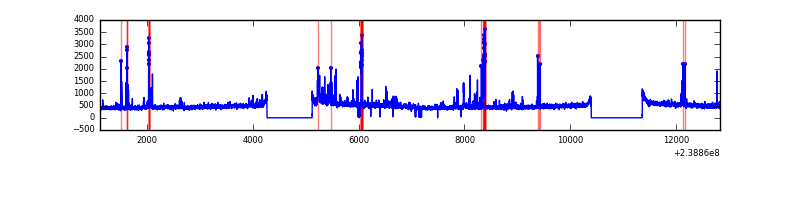 |
| C | 11730 | 9911 | 1 | 1 | 0.01% | 0.01% | 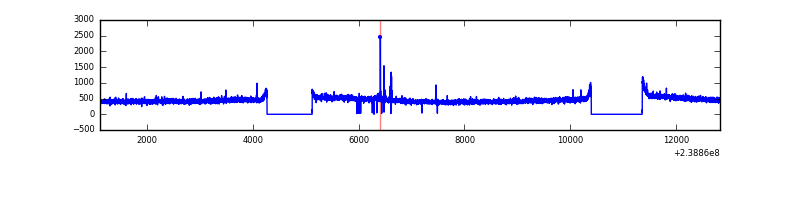 |
| D | 11730 | 9910 | 239 | 239 | 2.04% | 2.41% | 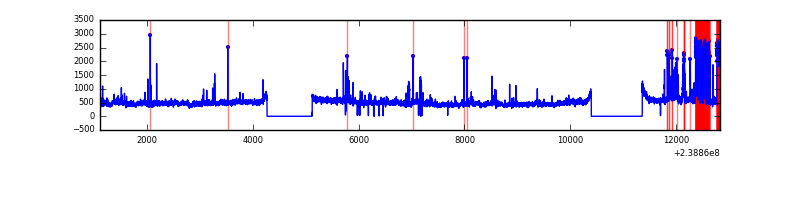 |
Top three noisy pixels from each quadrant. If the there are fewer than three noisy pixels in the level2.evt file, extra rows are filled as -1
| Pixel properties | Quadrant properties | ||||||
|---|---|---|---|---|---|---|---|
| Quadrant | DetID | PixID | Counts | Sigma | Mean | Median | Sigma |
| A | 14 | 111 | 259156 | 1096.77 | 1154 | 1131 | 235.3 |
| A | 8 | 15 | 63754 | 266.19 | 1154 | 1131 | 235.3 |
| A | 15 | 239 | 11024 | 42.05 | 1154 | 1131 | 235.3 |
| B | 4 | 81 | 398849 | 1780.09 | 1162 | 1133 | 223.4 |
| B | 0 | 85 | 90626 | 400.55 | 1162 | 1133 | 223.4 |
| B | 0 | 229 | 28766 | 123.68 | 1162 | 1133 | 223.4 |
| C | 9 | 221 | 22886 | 81.9 | 1140 | 1144 | 265.5 |
| C | 10 | 22 | 15595 | 54.43 | 1140 | 1144 | 265.5 |
| C | 13 | 61 | 8144 | 26.37 | 1140 | 1144 | 265.5 |
| D | 1 | 52 | 677949 | 2322.62 | 1115 | 1092 | 291.4 |
| D | 8 | 195 | 458559 | 1569.79 | 1115 | 1092 | 291.4 |
| D | 2 | 16 | 100856 | 342.34 | 1115 | 1092 | 291.4 |
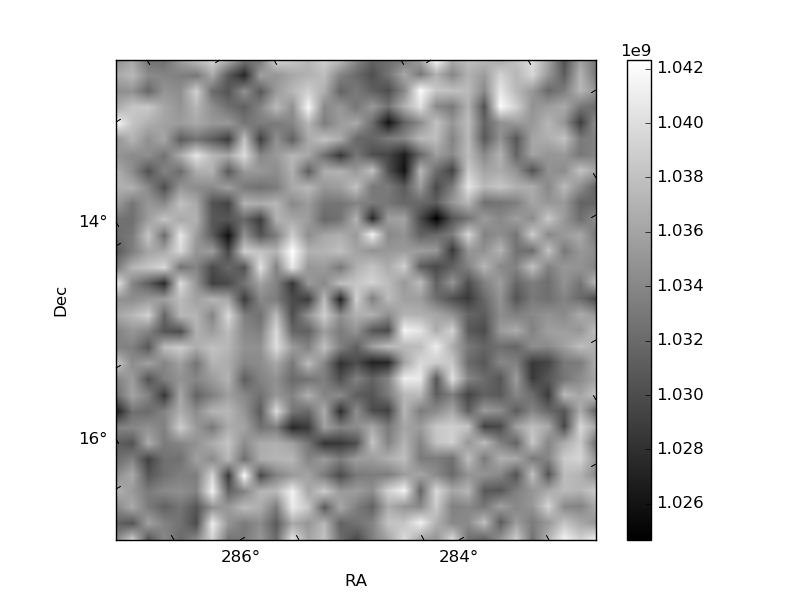
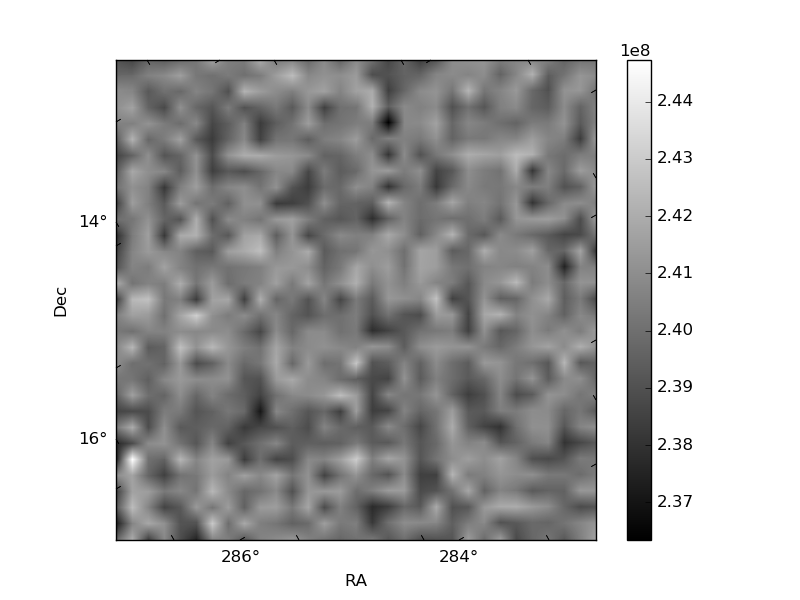
Histogram calculated using DETX and DETY for each event in the final _common_clean file
| Quadrant A |  |
 |
Quadrant B |
|---|---|---|---|
| Quadrant D |  |
 |
Quadrant C |
| Plot type | Count rate plots | Images |
|---|---|---|
| Comparison with Poisson distribution Blue bars denote a histogram of data divided into 1 sec bins. Red curve is a Poisson curve with rate = median count rate of data. |
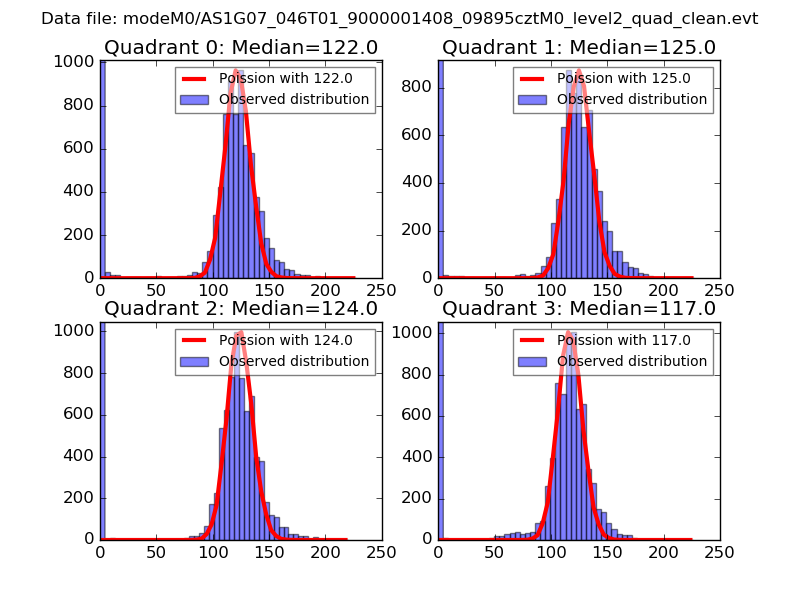 |
 |
| Quadrant-wise count rates Data is divided into 100 sec bins |
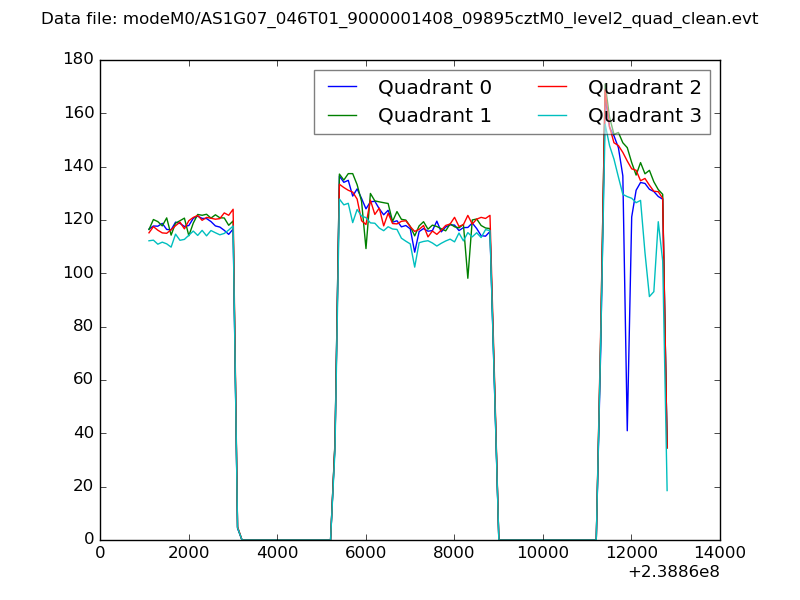 |
|
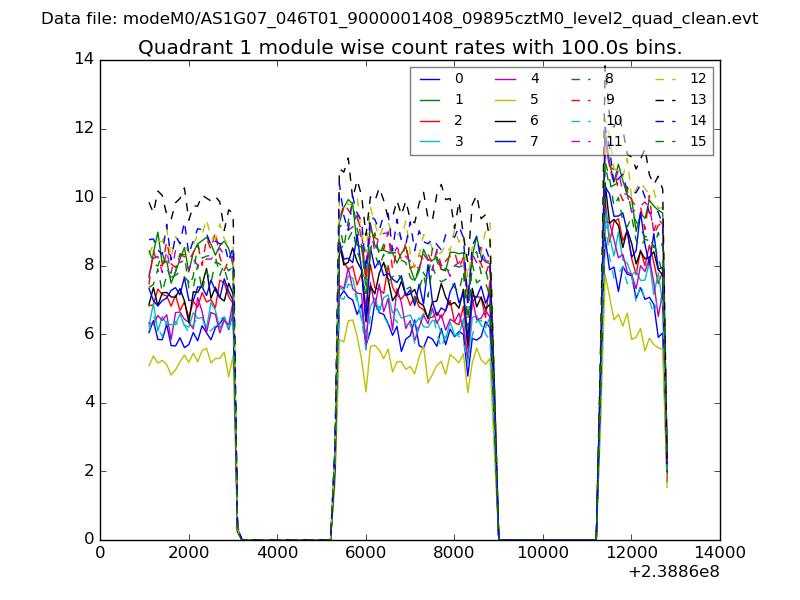
| Module-wise count rates for Quadrant A Data is divided into 100 sec bins |
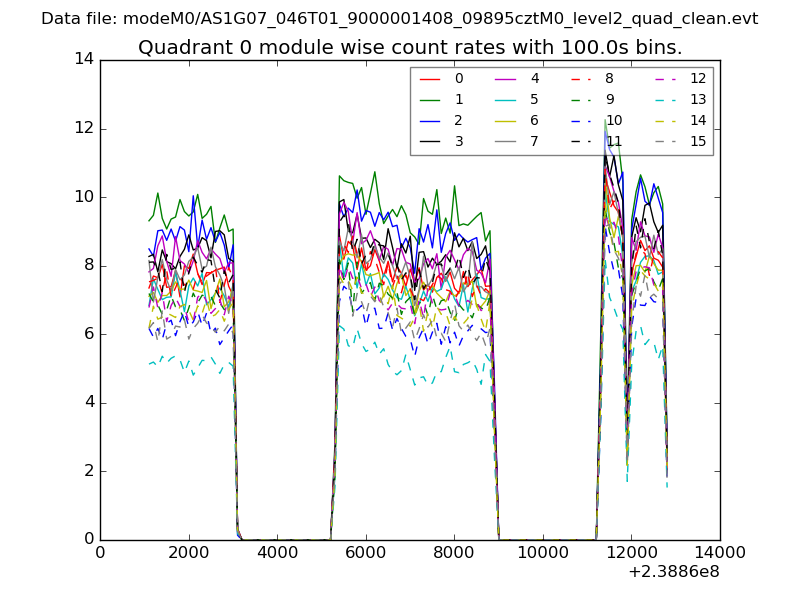 |
 |
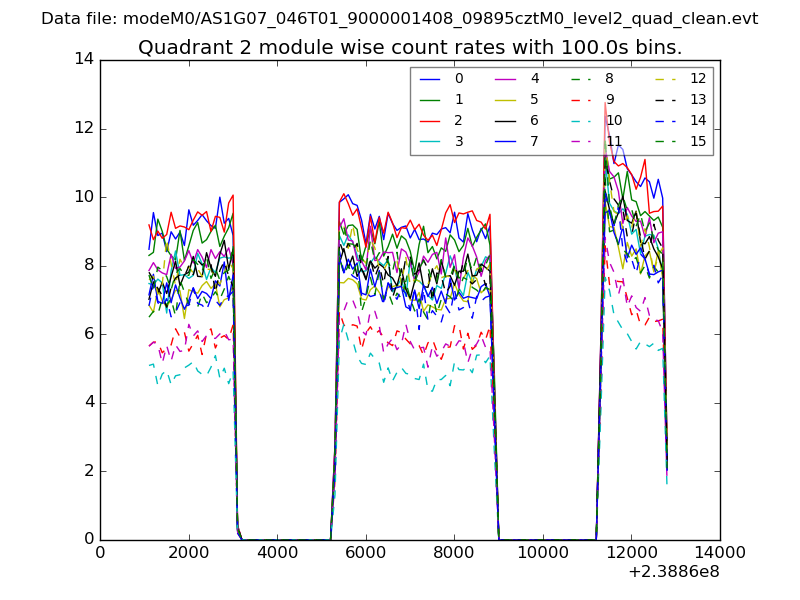
| Module-wise count rates for Quadrant B Data is divided into 100 sec bins |
 |
 |
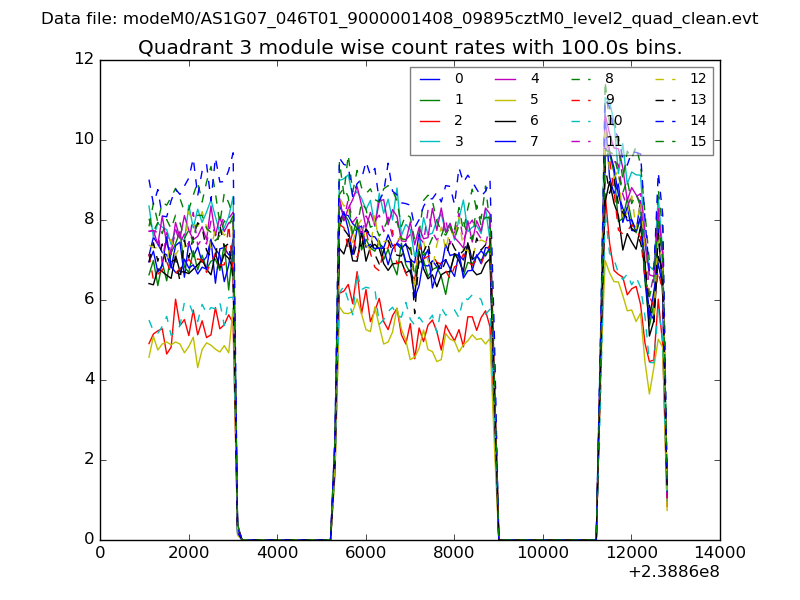
| Module-wise count rates for Quadrant C Data is divided into 100 sec bins |
 |
 |
| Module-wise count rates for Quadrant D Data is divided into 100 sec bins |
 |
 |
| Parameter | Plot |
|---|---|
| CZT HV Monitor | 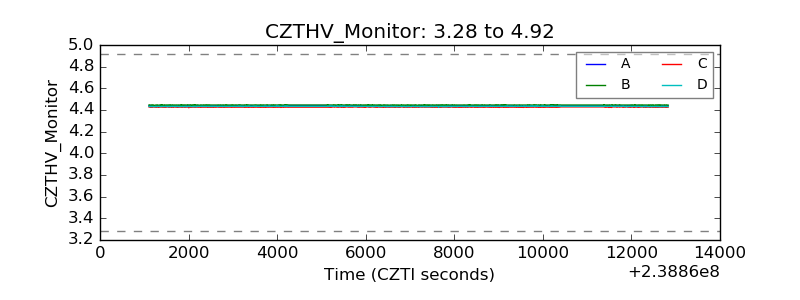 |
| D_VDD | 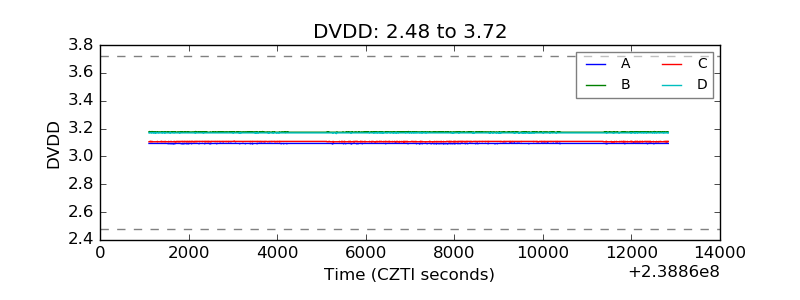 |
| Temperature 1 | 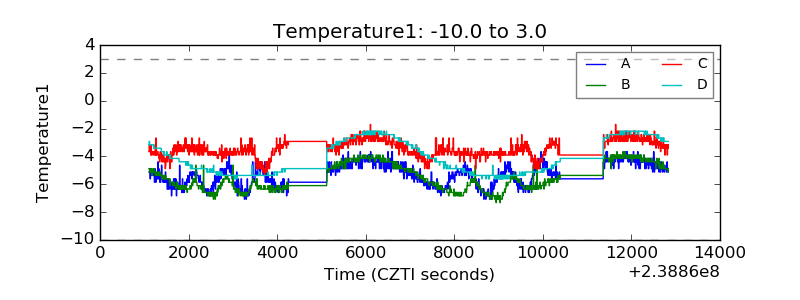 |
| Veto HV Monitor | 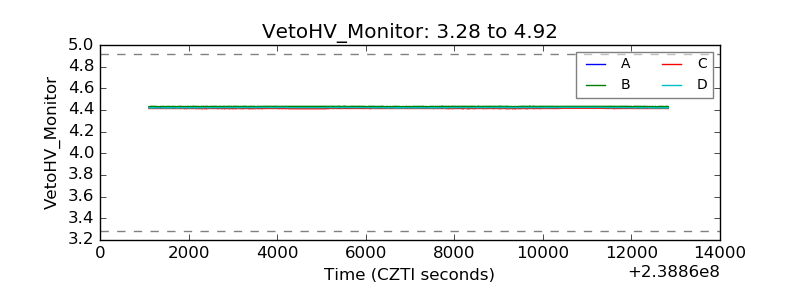 |
| Veto LLD | 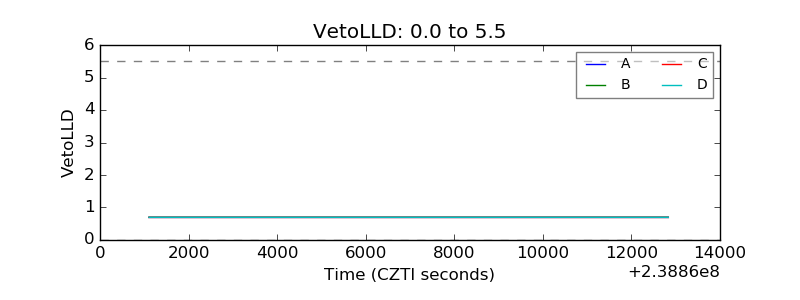 |
| Alpha Counter | 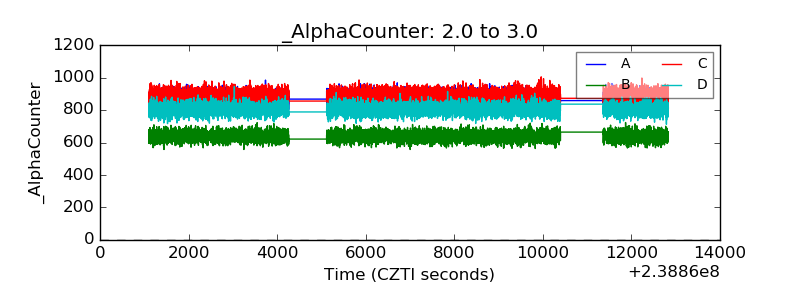 |
| _CPM_Rate | 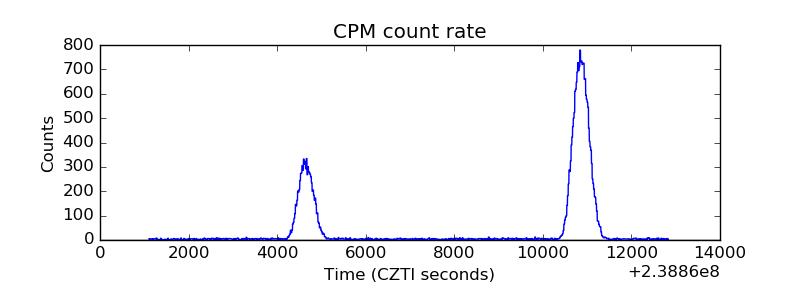 |
| CZT Counter |  |
| +2.5 Volts monitor |  |
| +5 Volts monitor |  |
| _ROLL_ROT | 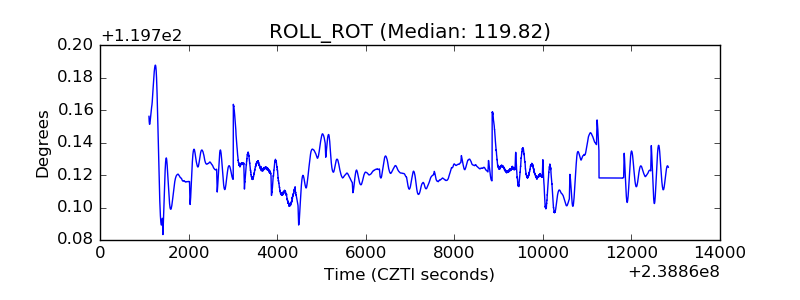 |
| _Roll_DEC | 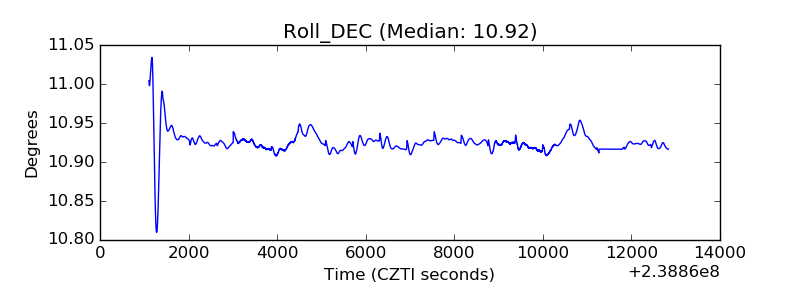 |
| _Roll_RA |  |
| Veto Counter | 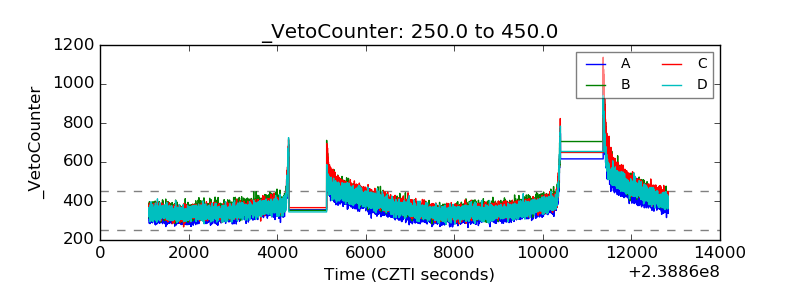 |