| Param | Original file | Final file |
|---|---|---|
| Filename | modeM0/AS1G07_046T01_9000001408_09897cztM0_level2.evt | modeM0/AS1G07_046T01_9000001408_09897cztM0_level2_quad_clean.evt |
| Size (bytes) | 440,962,560 | 88,706,880 |
| Size | 420.5 MB | 84.6 MB |
| Events in quadrant A | 3,101,576 | 560,918 |
| Events in quadrant B | 2,927,797 | 589,592 |
| Events in quadrant C | 2,809,405 | 581,536 |
| Events in quadrant D | 4,103,916 | 531,135 |
| Mode M0 | |||
|---|---|---|---|
| Quadrant | BADHDUFLAG | Total packets | Discarded packets |
| A | 0 | 13288 | 2 |
| B | 0 | 12749 | 1 |
| C | 0 | 12504 | 1 |
| D | 0 | 15991 | 1 |
| Mode SS | |||
|---|---|---|---|
| Quadrant | BADHDUFLAG | Total packets | Discarded packets |
| A | 0 | 124 | 0 |
| B | 0 | 124 | 0 |
| C | 0 | 124 | 0 |
| D | 0 | 124 | 0 |
| Mode M9 | |||
|---|---|---|---|
| Quadrant | BADHDUFLAG | Total packets | Discarded packets |
| A | 0 | 11 | 0 |
| B | 0 | 11 | 0 |
| C | 0 | 11 | 0 |
| D | 0 | 11 | 0 |
| Quadrant | Total seconds | Saturated seconds | Saturation percentage |
|---|---|---|---|
| A | 6053 | 156 | 2.577234% |
| B | 6053 | 43 | 0.710392% |
| C | 6053 | 23 | 0.379977% |
| D | 6053 | 378 | 6.244837% |
Noise dominated data is calculated using 1-second bins in cleaned event files. If a bin has >2000 counts, and if more than 50% of those come from <1% of pixels, then it is considered to be noise-dominated and hence unusable.
| Quadrant | # 1 sec bins | Bins with >0 counts | Bins with >2000 counts | High rate bins dominated by noise | Noise dominated (total time) | Noise dominated (detector-on time) | Marked lightcurve |
|---|---|---|---|---|---|---|---|
| A | 7183 | 6054 | 58 | 58 | 0.81% | 0.96% | 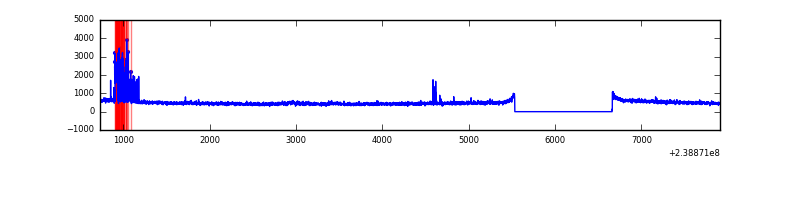 |
| B | 7183 | 6054 | 4 | 4 | 0.06% | 0.07% | 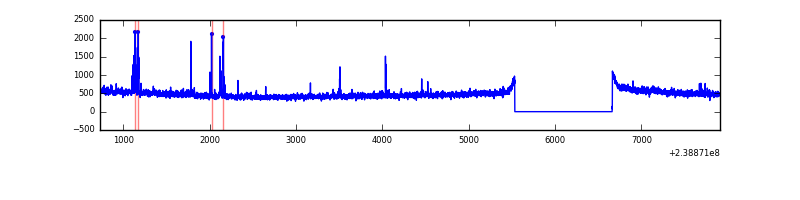 |
| C | 7183 | 6054 | 0 | 0 | 0.00% | 0.00% | 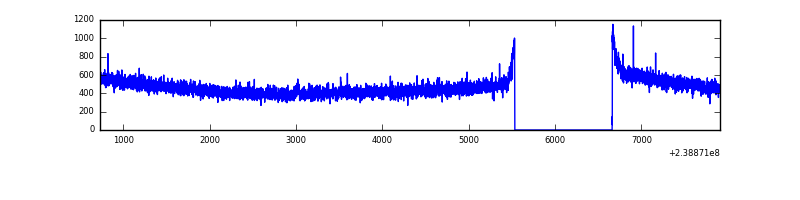 |
| D | 7183 | 6054 | 351 | 351 | 4.89% | 5.80% | 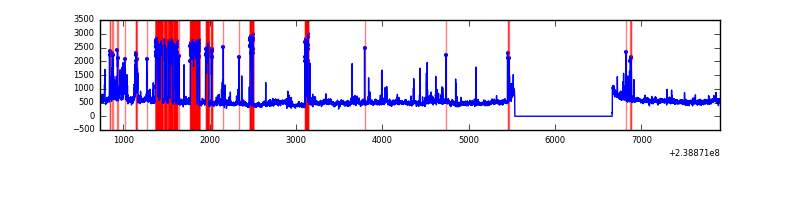 |
Top three noisy pixels from each quadrant. If the there are fewer than three noisy pixels in the level2.evt file, extra rows are filled as -1
| Pixel properties | Quadrant properties | ||||||
|---|---|---|---|---|---|---|---|
| Quadrant | DetID | PixID | Counts | Sigma | Mean | Median | Sigma |
| A | 14 | 111 | 248275 | 1713.07 | 715 | 701 | 144.5 |
| A | 8 | 15 | 89878 | 617.05 | 715 | 701 | 144.5 |
| A | 15 | 239 | 11779 | 76.65 | 715 | 701 | 144.5 |
| B | 4 | 81 | 57843 | 408.64 | 730 | 713 | 139.8 |
| B | 12 | 111 | 16129 | 110.27 | 730 | 713 | 139.8 |
| B | 11 | 111 | 13626 | 92.37 | 730 | 713 | 139.8 |
| C | 13 | 61 | 5172 | 26.61 | 718 | 724 | 167.1 |
| C | 10 | 22 | 4049 | 19.89 | 718 | 724 | 167.1 |
| C | 14 | 67 | 2612 | 11.3 | 718 | 724 | 167.1 |
| D | 1 | 52 | 976869 | 5370.07 | 695 | 681 | 181.8 |
| D | 8 | 195 | 275202 | 1510.16 | 695 | 681 | 181.8 |
| D | 8 | 32 | 58441 | 317.74 | 695 | 681 | 181.8 |
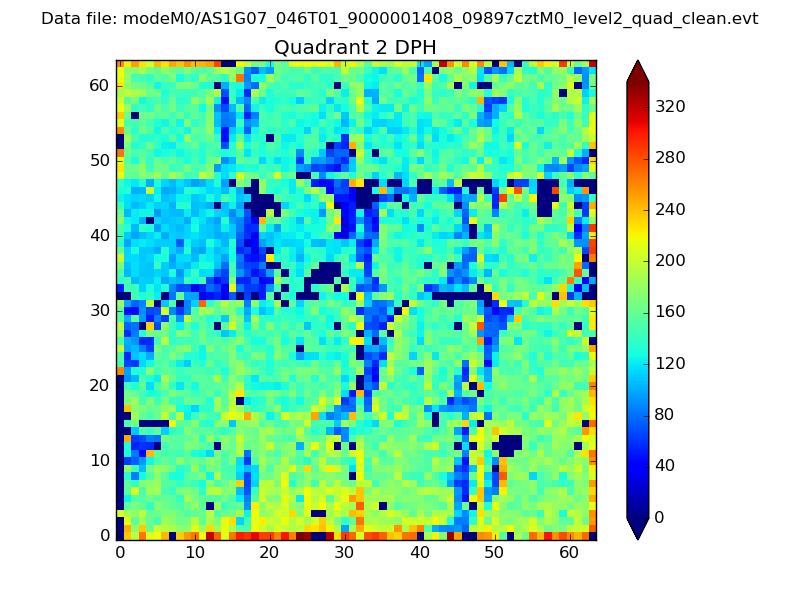
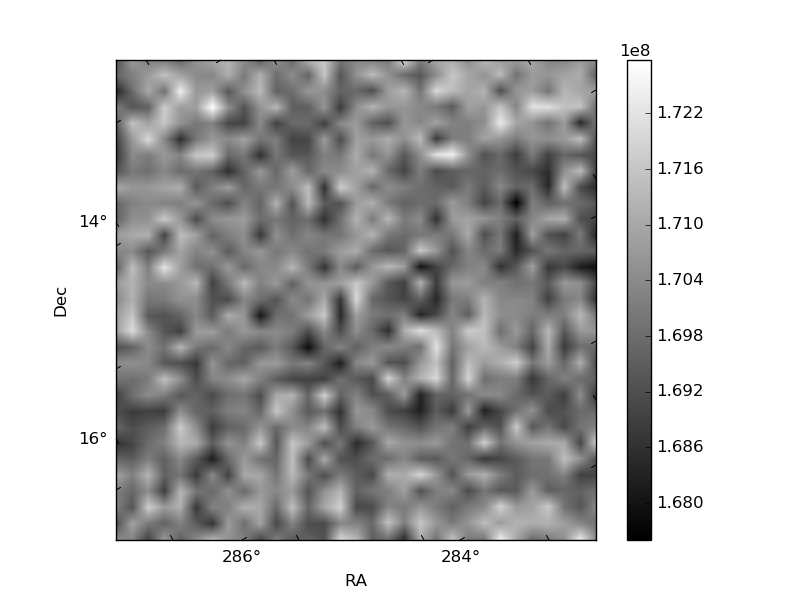
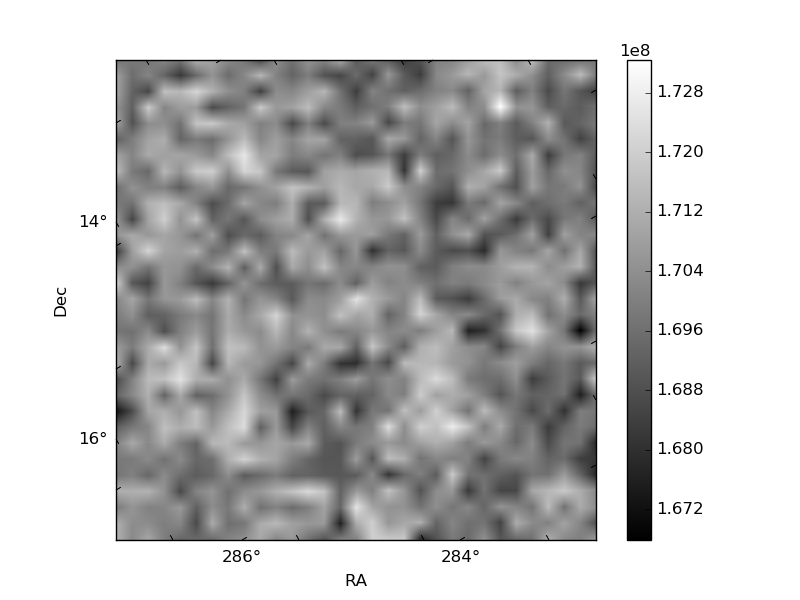
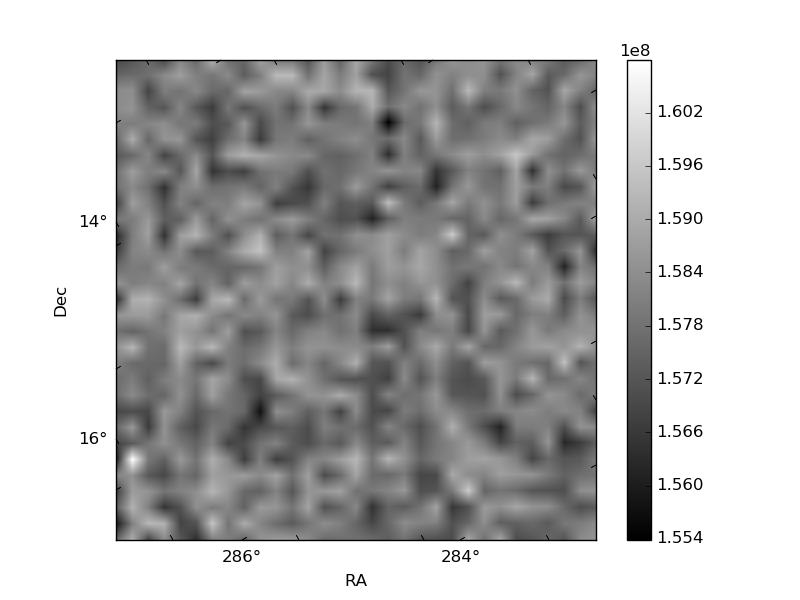
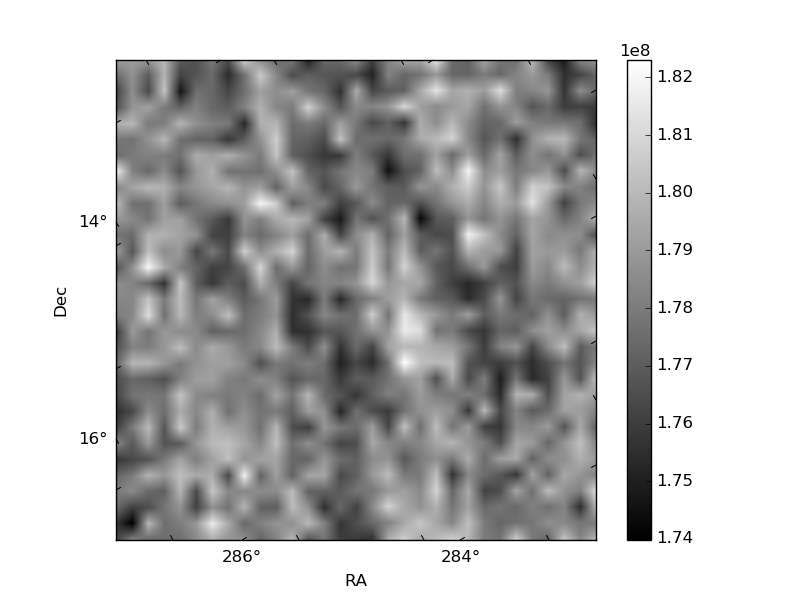
Histogram calculated using DETX and DETY for each event in the final _common_clean file
| Quadrant A | 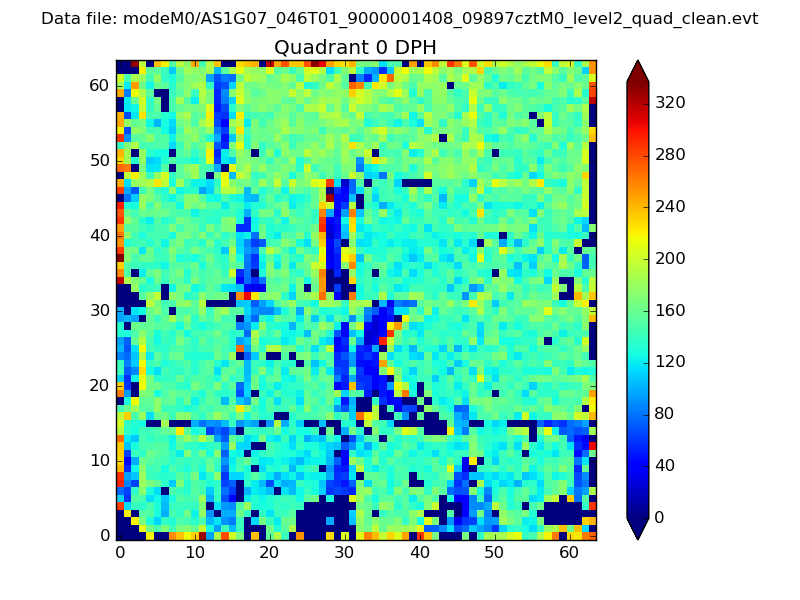 |
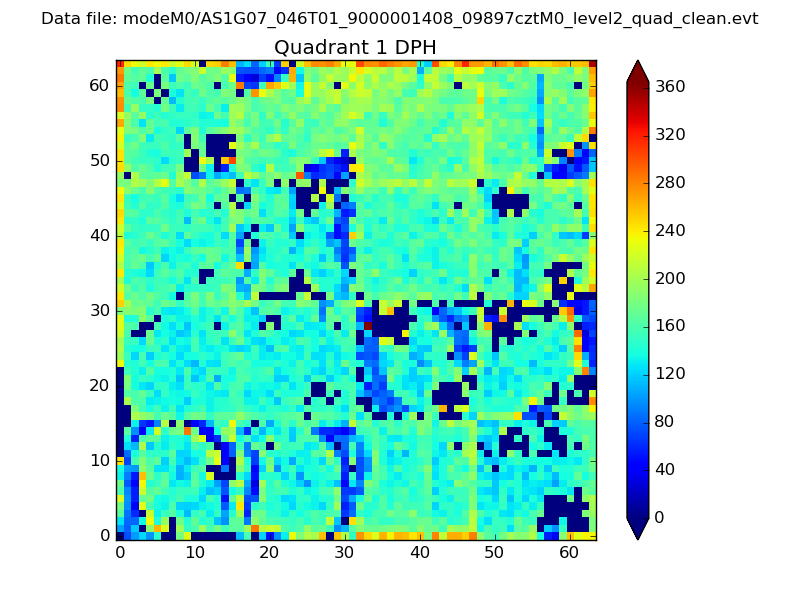 |
Quadrant B |
|---|---|---|---|
| Quadrant D | 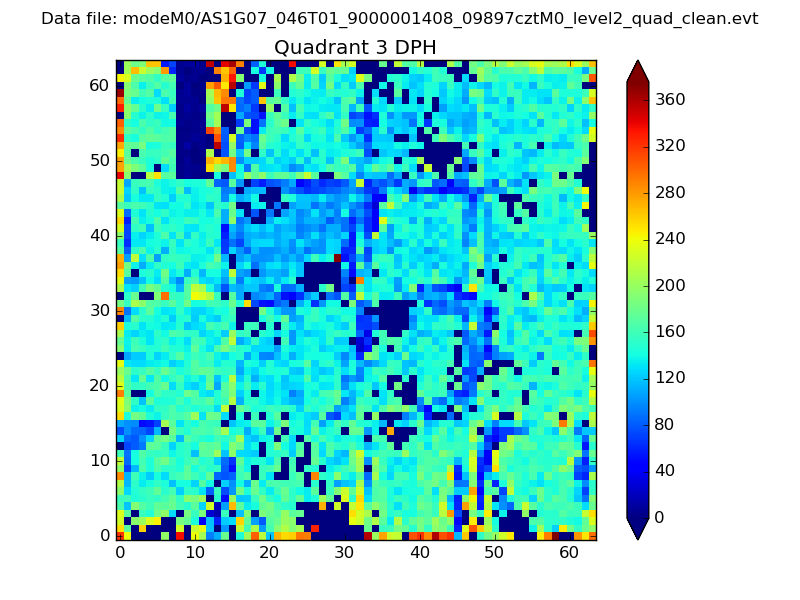 |
 |
Quadrant C |
| Plot type | Count rate plots | Images |
|---|---|---|
| Comparison with Poisson distribution Blue bars denote a histogram of data divided into 1 sec bins. Red curve is a Poisson curve with rate = median count rate of data. |
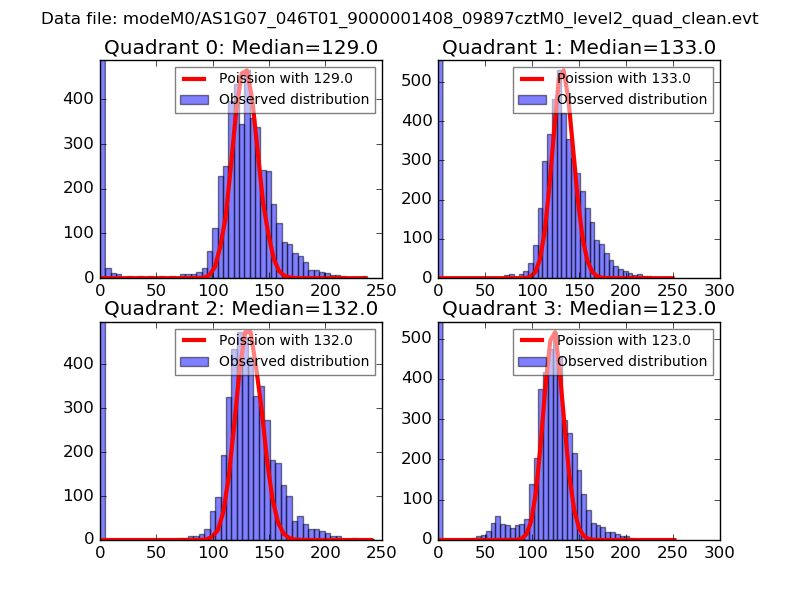 |
 |
| Quadrant-wise count rates Data is divided into 100 sec bins |
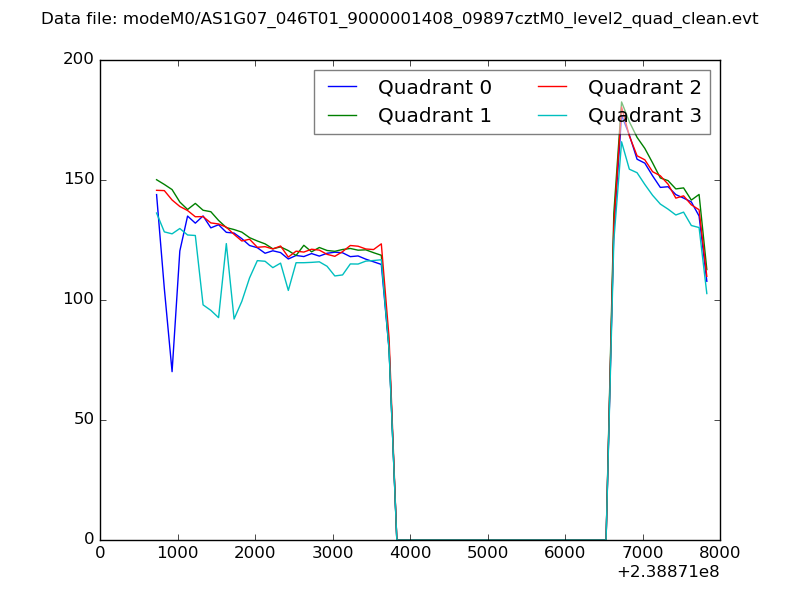 |
|
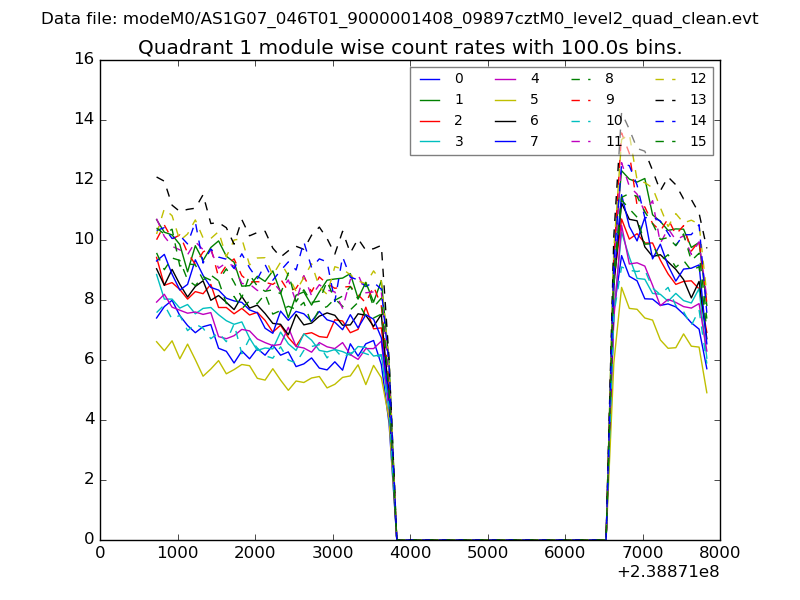
| Module-wise count rates for Quadrant A Data is divided into 100 sec bins |
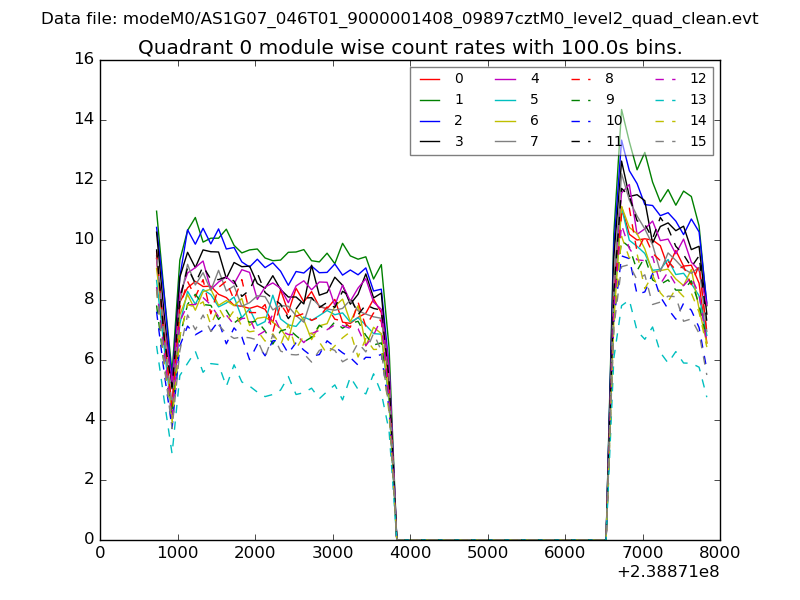 |
 |
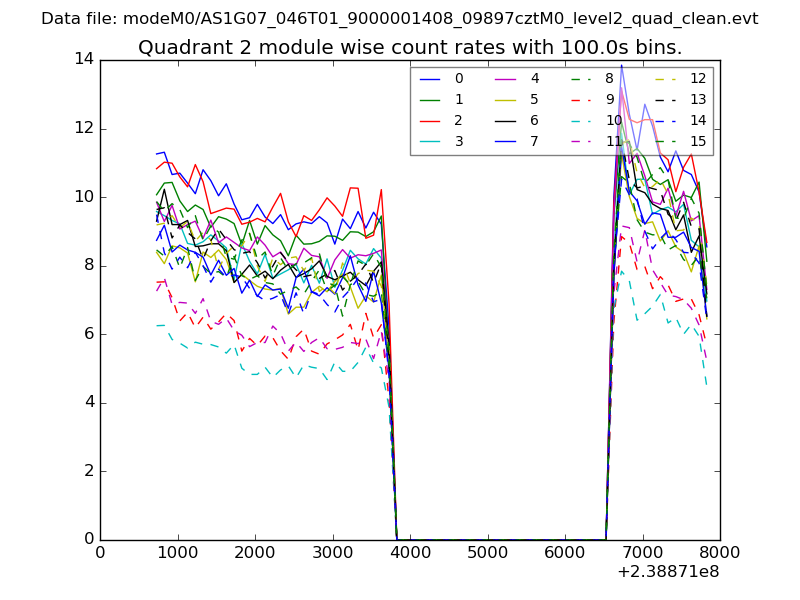
| Module-wise count rates for Quadrant B Data is divided into 100 sec bins |
 |
 |
| Module-wise count rates for Quadrant C Data is divided into 100 sec bins |
 |
 |
| Module-wise count rates for Quadrant D Data is divided into 100 sec bins |
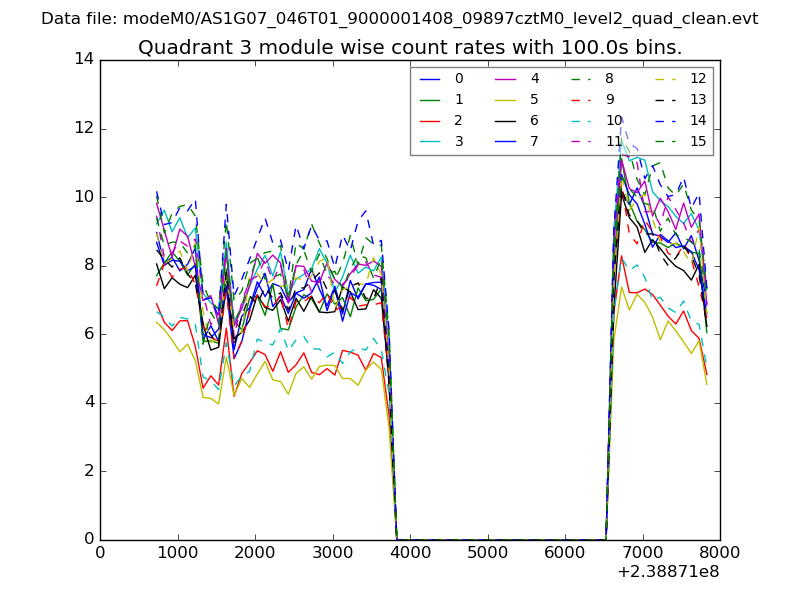 |
 |
| Parameter | Plot |
|---|---|
| CZT HV Monitor | 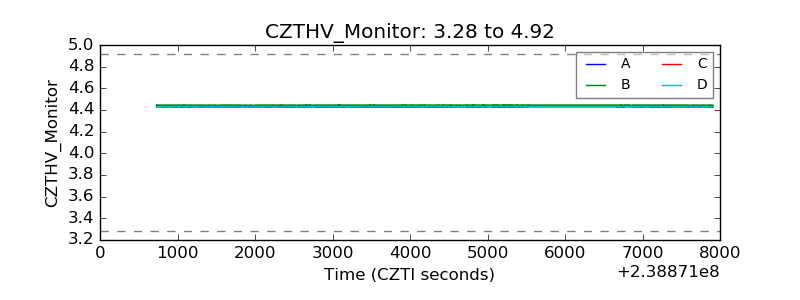 |
| D_VDD | 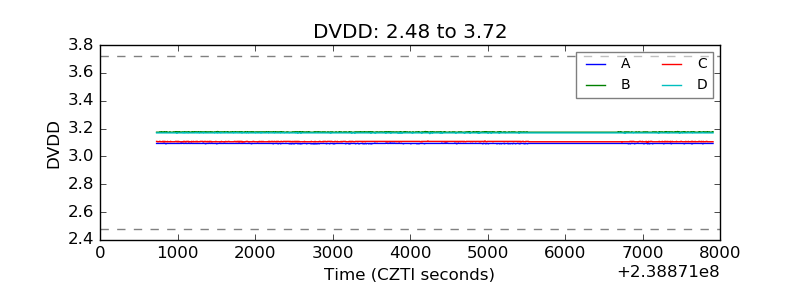 |
| Temperature 1 | 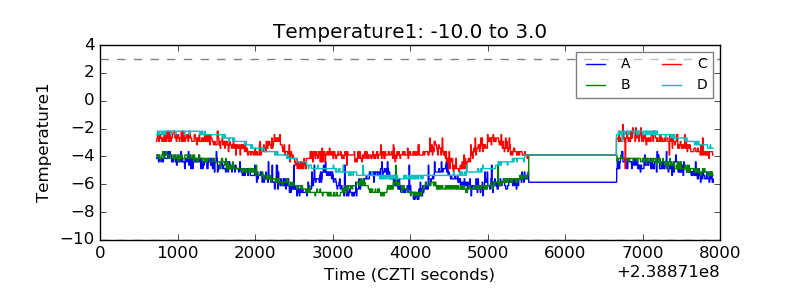 |
| Veto HV Monitor | 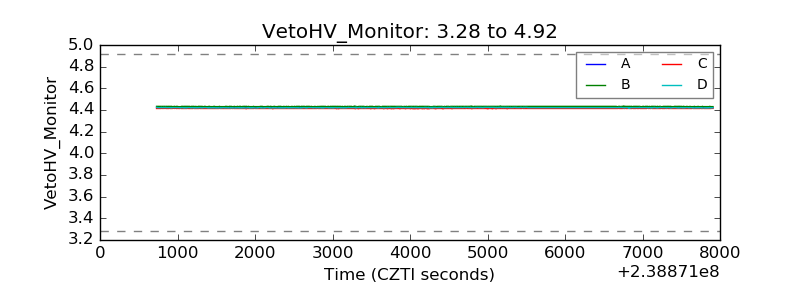 |
| Veto LLD | 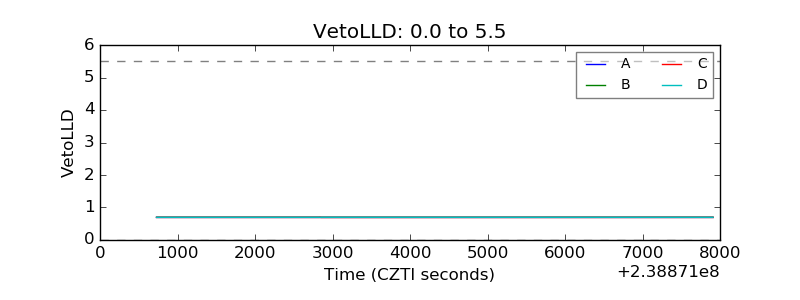 |
| Alpha Counter |  |
| _CPM_Rate | 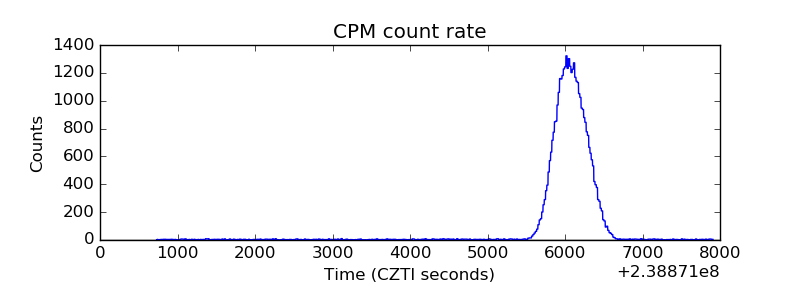 |
| CZT Counter | 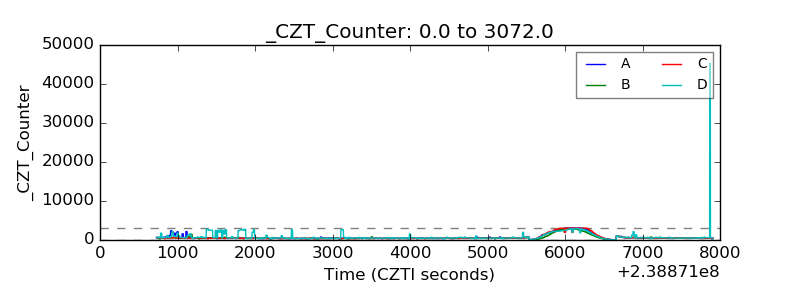 |
| +2.5 Volts monitor |  |
| +5 Volts monitor |  |
| _ROLL_ROT | 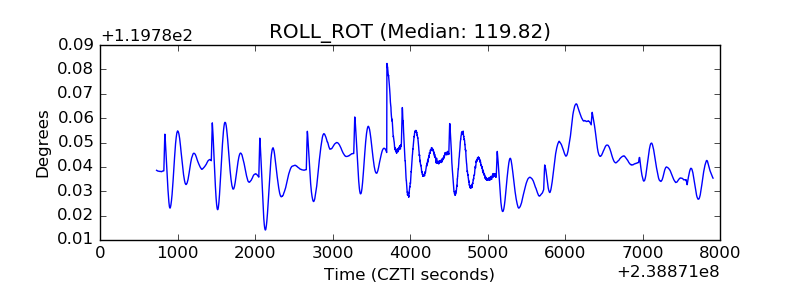 |
| _Roll_DEC | 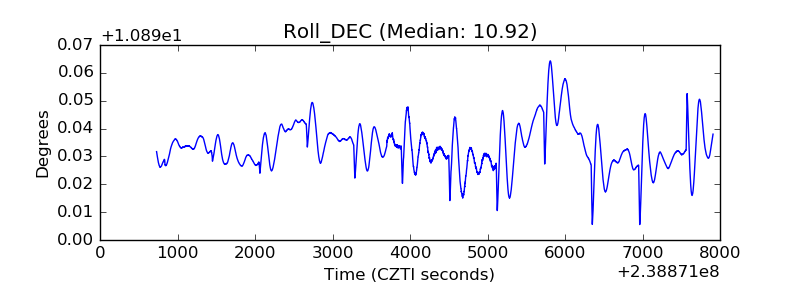 |
| _Roll_RA |  |
| Veto Counter | 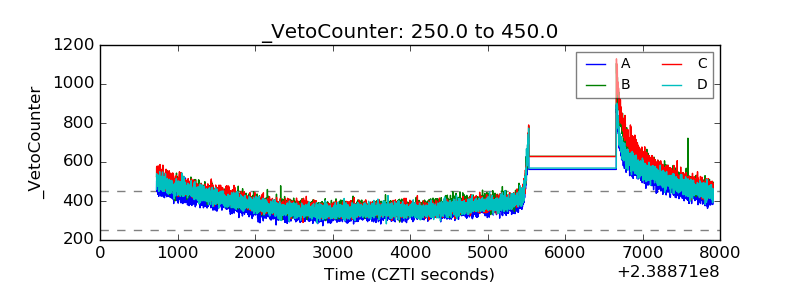 |