| Param | Original file | Final file |
|---|---|---|
| Filename | modeM0/AS1G07_046T01_9000001408_09901cztM0_level2.evt | modeM0/AS1G07_046T01_9000001408_09901cztM0_level2_quad_clean.evt |
| Size (bytes) | 400,965,120 | 81,714,240 |
| Size | 382.4 MB | 77.9 MB |
| Events in quadrant A | 3,132,498 | 515,118 |
| Events in quadrant B | 2,880,690 | 537,365 |
| Events in quadrant C | 2,774,742 | 518,074 |
| Events in quadrant D | 2,949,531 | 487,162 |
| Mode M0 | |||
|---|---|---|---|
| Quadrant | BADHDUFLAG | Total packets | Discarded packets |
| A | 0 | 13304 | 169 |
| B | 0 | 12517 | 152 |
| C | 0 | 12432 | 160 |
| D | 0 | 12943 | 164 |
| Mode SS | |||
|---|---|---|---|
| Quadrant | BADHDUFLAG | Total packets | Discarded packets |
| A | 0 | 124 | 0 |
| B | 0 | 124 | 2 |
| C | 0 | 124 | 0 |
| D | 0 | 124 | 4 |
| Mode M9 | |||
|---|---|---|---|
| Quadrant | BADHDUFLAG | Total packets | Discarded packets |
| A | 0 | 13 | 0 |
| B | 0 | 13 | 0 |
| C | 0 | 13 | 0 |
| D | 0 | 13 | 0 |
| Quadrant | Total seconds | Saturated seconds | Saturation percentage |
|---|---|---|---|
| A | 5963 | 36 | 0.603723% |
| B | 5962 | 42 | 0.704462% |
| C | 5959 | 12 | 0.201376% |
| D | 5959 | 21 | 0.352408% |
Noise dominated data is calculated using 1-second bins in cleaned event files. If a bin has >2000 counts, and if more than 50% of those come from <1% of pixels, then it is considered to be noise-dominated and hence unusable.
| Quadrant | # 1 sec bins | Bins with >0 counts | Bins with >2000 counts | High rate bins dominated by noise | Noise dominated (total time) | Noise dominated (detector-on time) | Marked lightcurve |
|---|---|---|---|---|---|---|---|
| A | 7350 | 6032 | 9 | 9 | 0.12% | 0.15% | 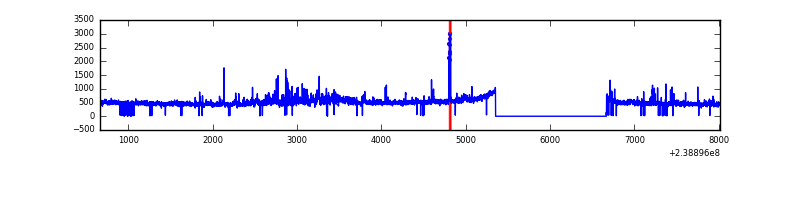 |
| B | 7350 | 6029 | 0 | 0 | 0.00% | 0.00% | 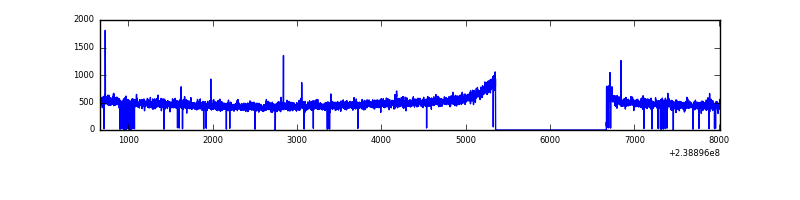 |
| C | 7350 | 6028 | 0 | 0 | 0.00% | 0.00% |  |
| D | 7350 | 6027 | 2 | 2 | 0.03% | 0.03% | 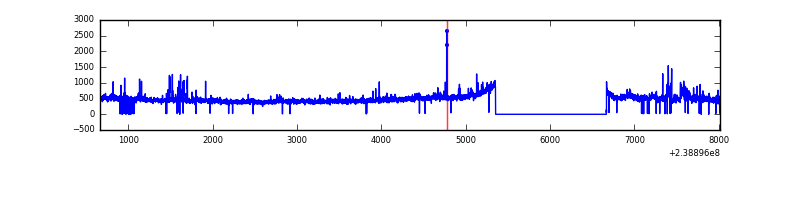 |
Top three noisy pixels from each quadrant. If the there are fewer than three noisy pixels in the level2.evt file, extra rows are filled as -1
| Pixel properties | Quadrant properties | ||||||
|---|---|---|---|---|---|---|---|
| Quadrant | DetID | PixID | Counts | Sigma | Mean | Median | Sigma |
| A | 15 | 239 | 340241 | 2284.55 | 725 | 711 | 148.6 |
| A | 0 | 226 | 6520 | 39.09 | 725 | 711 | 148.6 |
| A | 12 | 194 | 5803 | 34.26 | 725 | 711 | 148.6 |
| B | 12 | 111 | 16108 | 110.2 | 735 | 719 | 139.6 |
| B | 11 | 111 | 13571 | 92.03 | 735 | 719 | 139.6 |
| B | 14 | 111 | 11254 | 75.44 | 735 | 719 | 139.6 |
| C | 9 | 221 | 7522 | 41.59 | 708 | 713 | 163.7 |
| C | 13 | 61 | 5288 | 27.95 | 708 | 713 | 163.7 |
| C | 14 | 67 | 3316 | 15.9 | 708 | 713 | 163.7 |
| D | 2 | 16 | 182277 | 1007.47 | 691 | 676 | 180.3 |
| D | 8 | 195 | 69627 | 382.52 | 691 | 676 | 180.3 |
| D | 1 | 52 | 26676 | 144.24 | 691 | 676 | 180.3 |
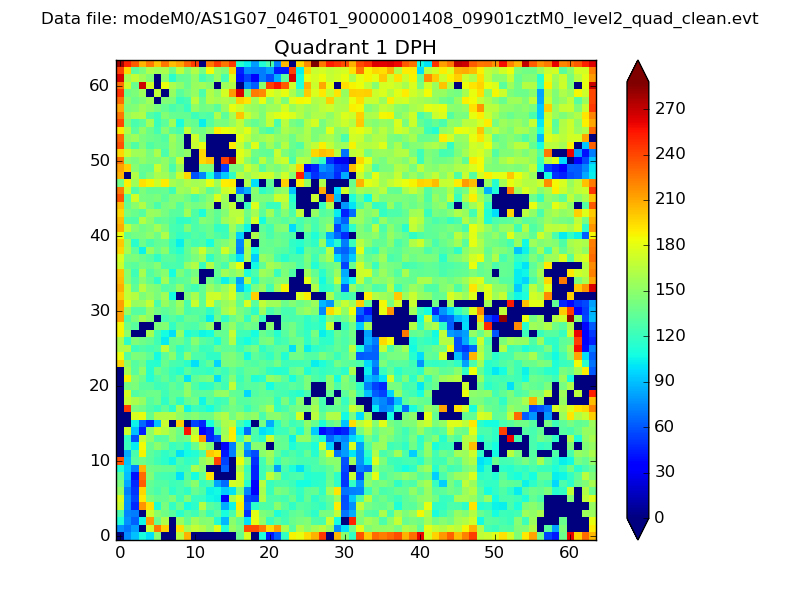
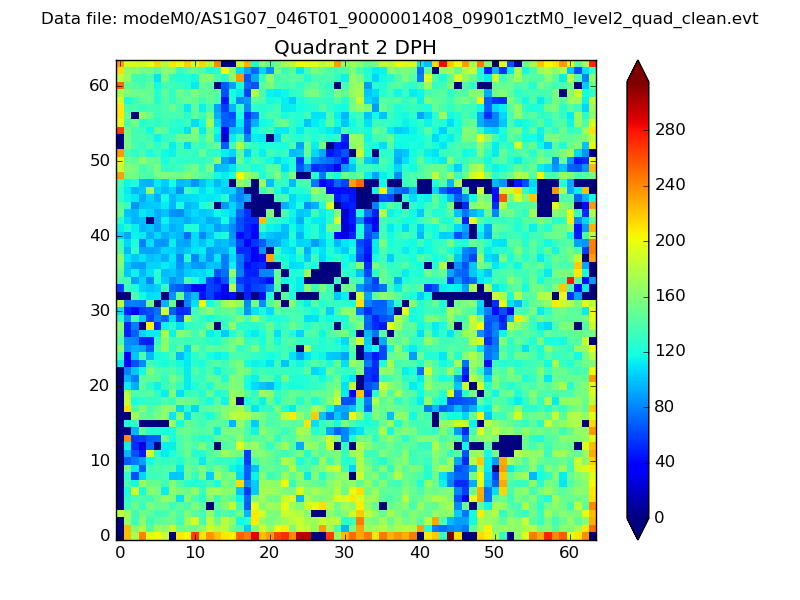
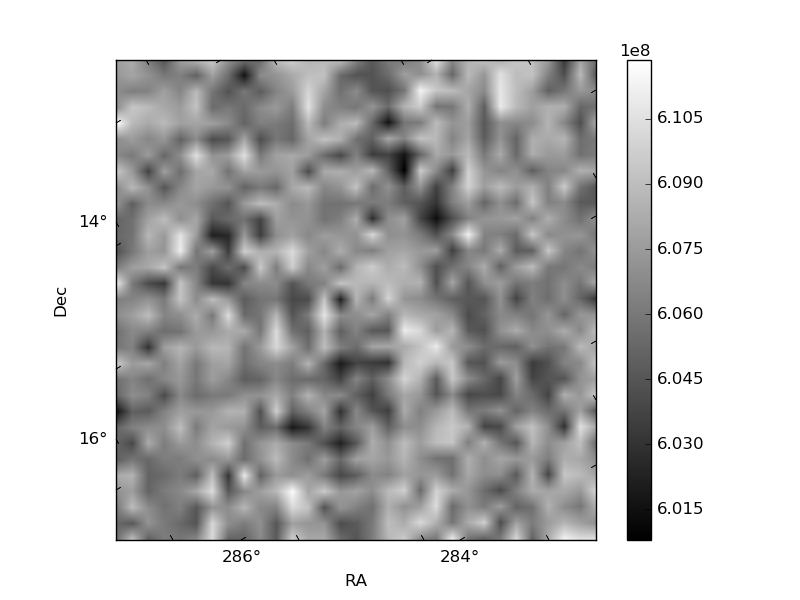
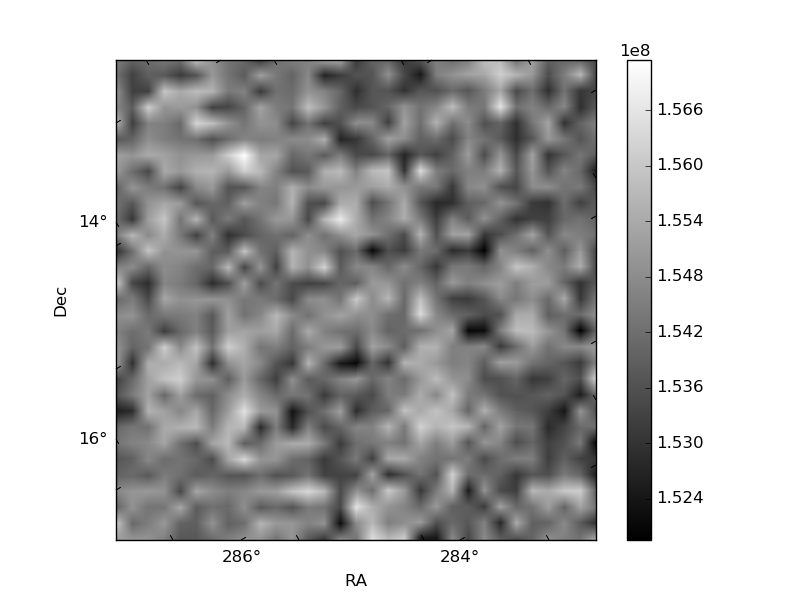
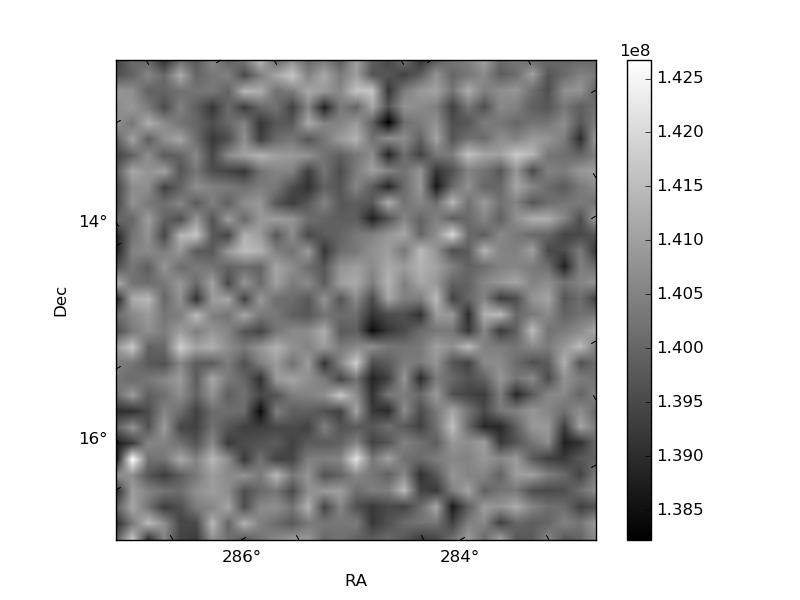
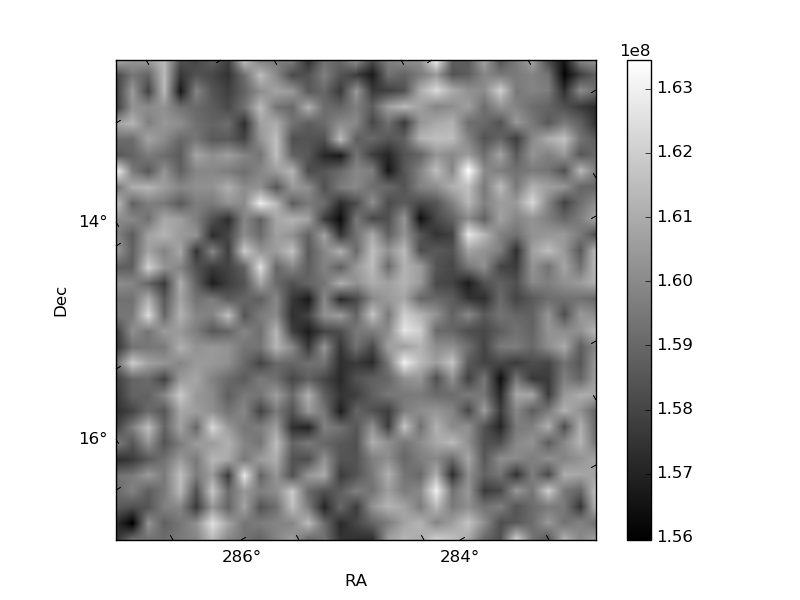
Histogram calculated using DETX and DETY for each event in the final _common_clean file
| Quadrant A | 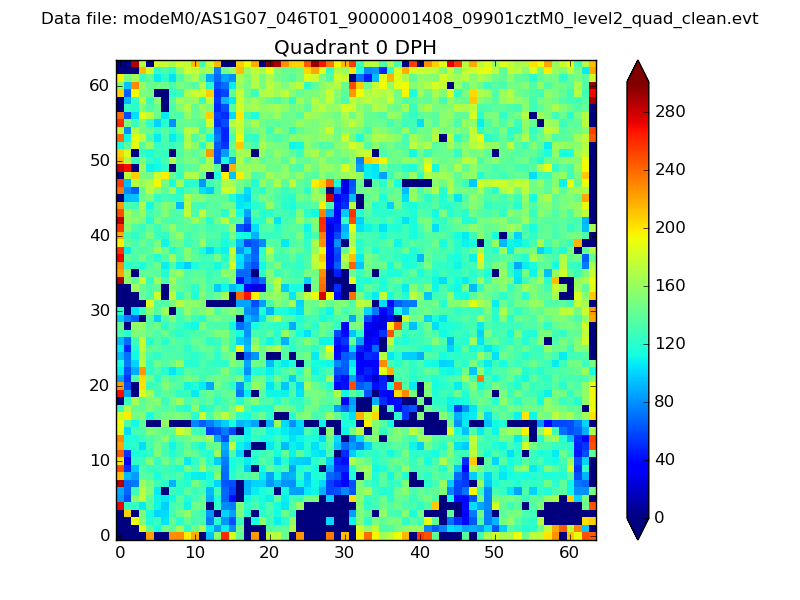 |
 |
Quadrant B |
|---|---|---|---|
| Quadrant D | 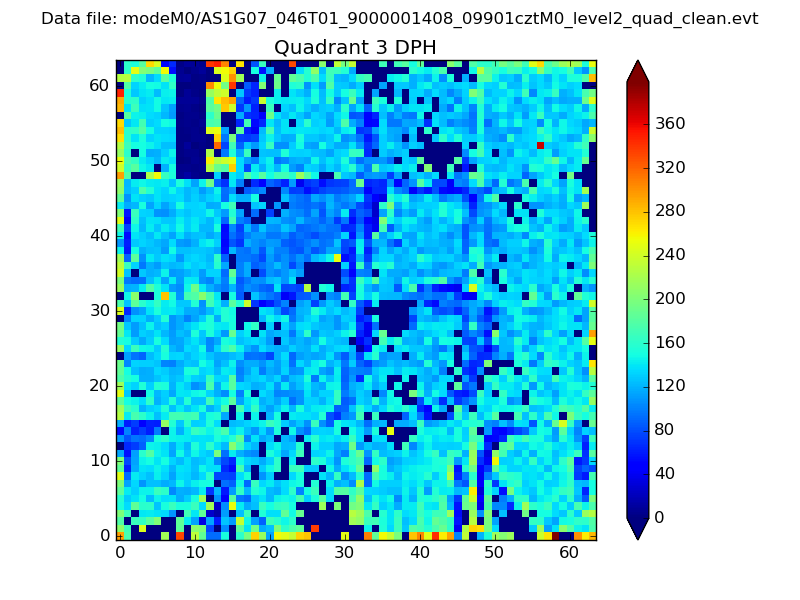 |
 |
Quadrant C |
| Plot type | Count rate plots | Images |
|---|---|---|
| Comparison with Poisson distribution Blue bars denote a histogram of data divided into 1 sec bins. Red curve is a Poisson curve with rate = median count rate of data. |
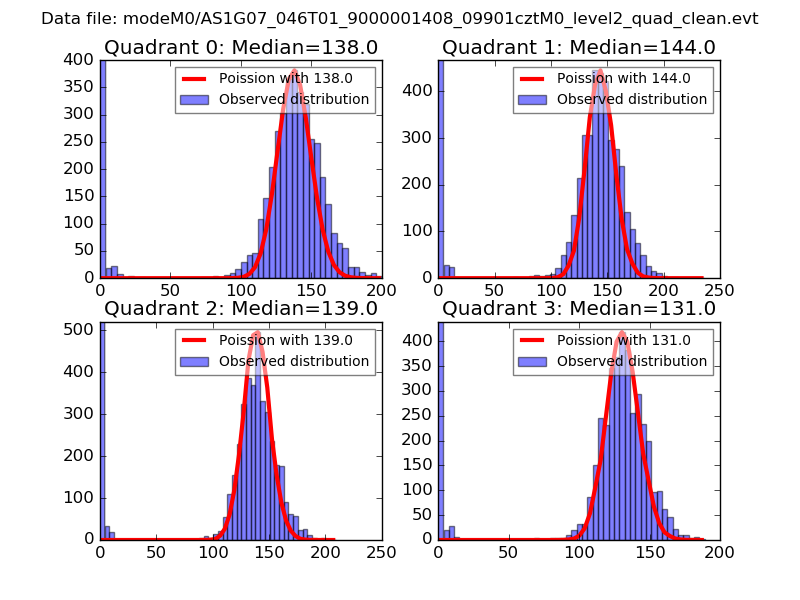 |
 |
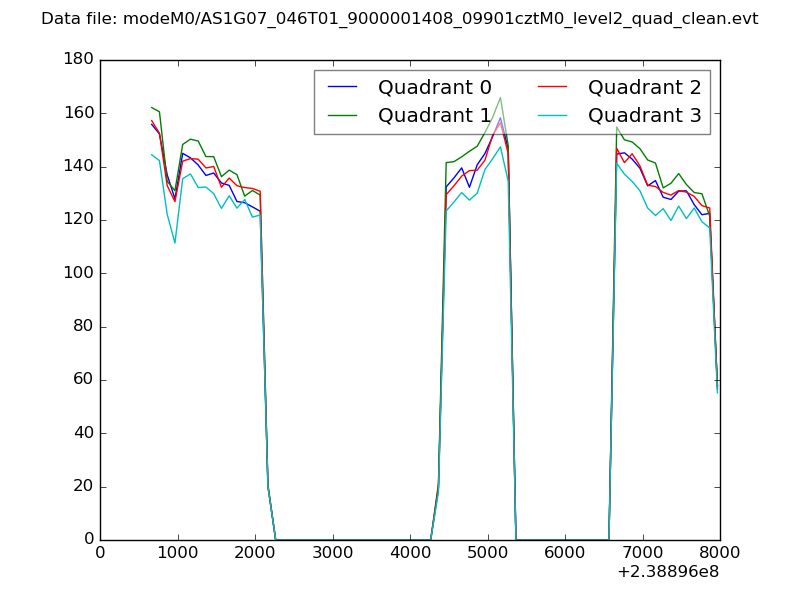
| Quadrant-wise count rates Data is divided into 100 sec bins |
 |
|
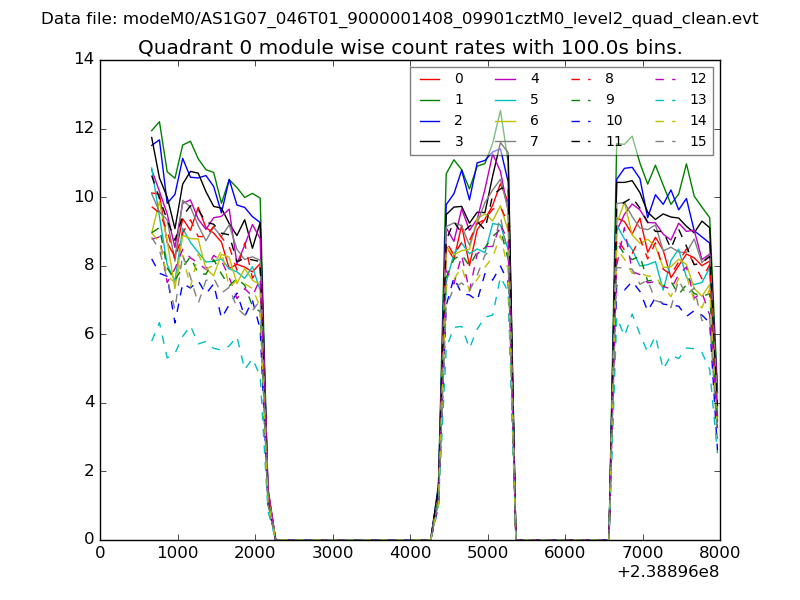
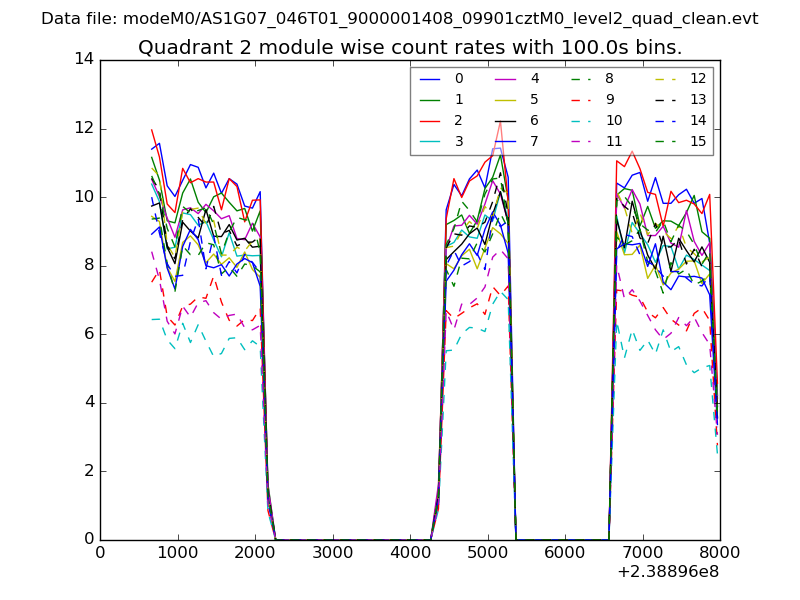
| Module-wise count rates for Quadrant A Data is divided into 100 sec bins |
 |
 |
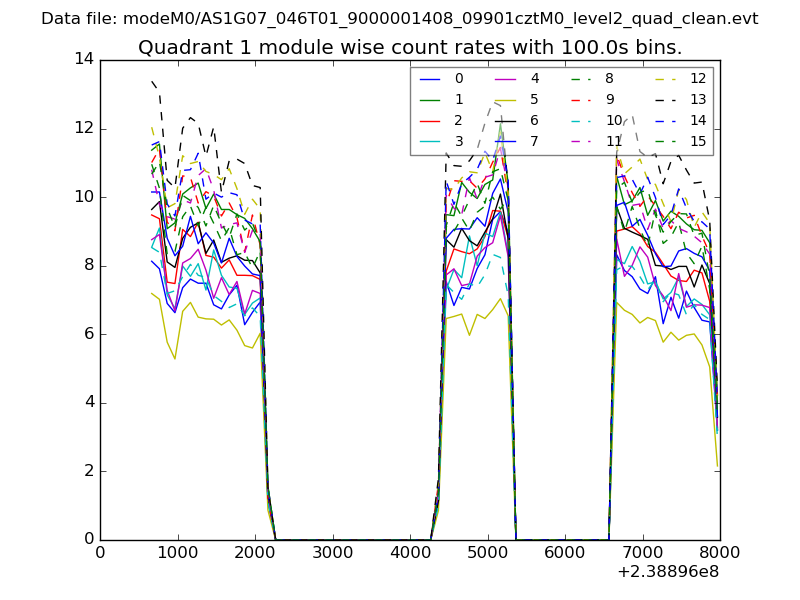
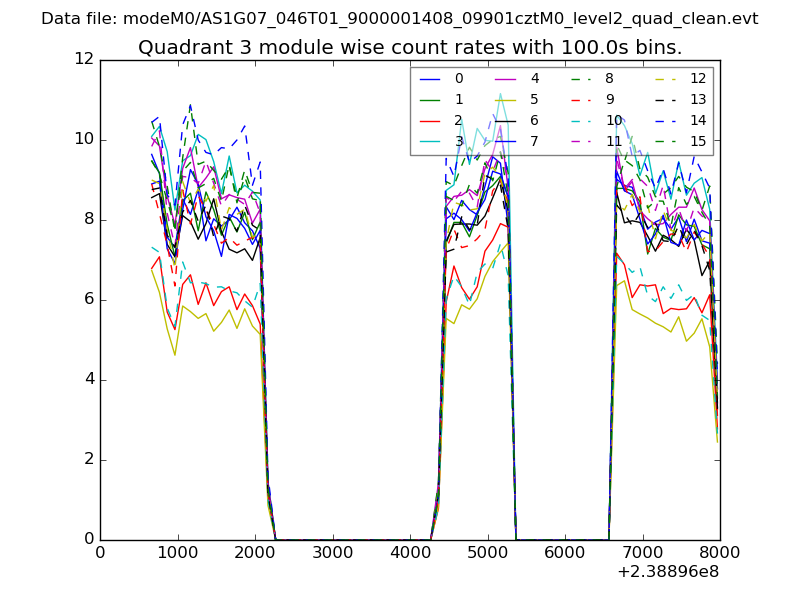
| Module-wise count rates for Quadrant B Data is divided into 100 sec bins |
 |
 |
| Module-wise count rates for Quadrant C Data is divided into 100 sec bins |
 |
 |
| Module-wise count rates for Quadrant D Data is divided into 100 sec bins |
 |
 |
| Parameter | Plot |
|---|---|
| CZT HV Monitor | 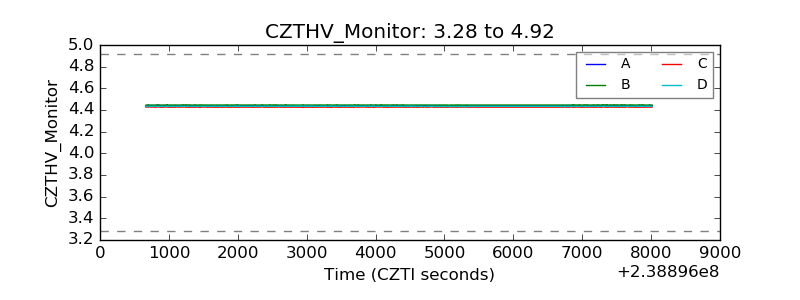 |
| D_VDD |  |
| Temperature 1 | 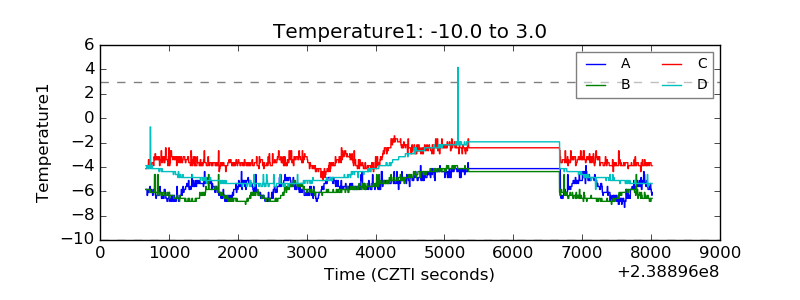 |
| Veto HV Monitor | 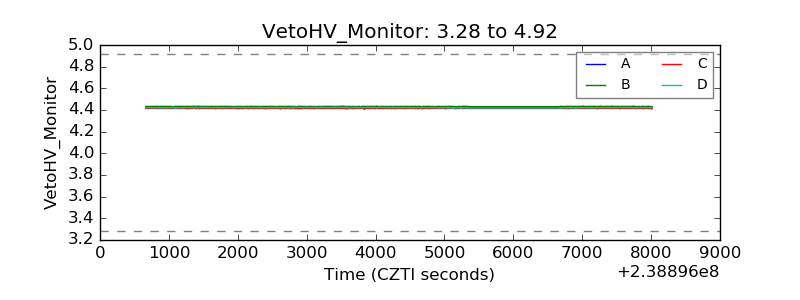 |
| Veto LLD | 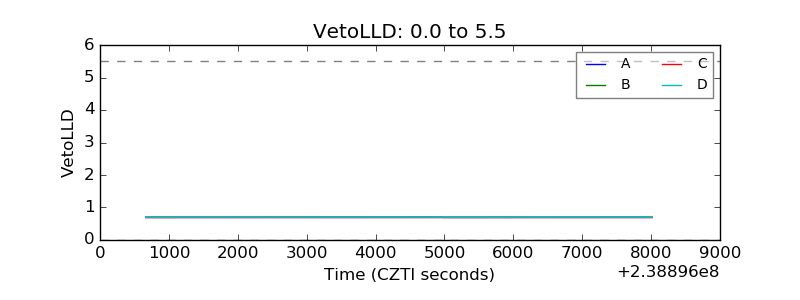 |
| Alpha Counter | 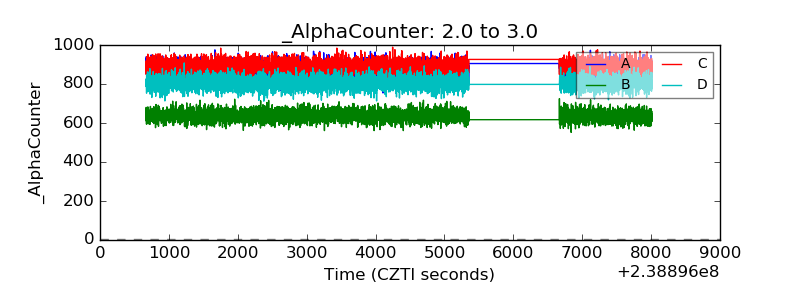 |
| _CPM_Rate | 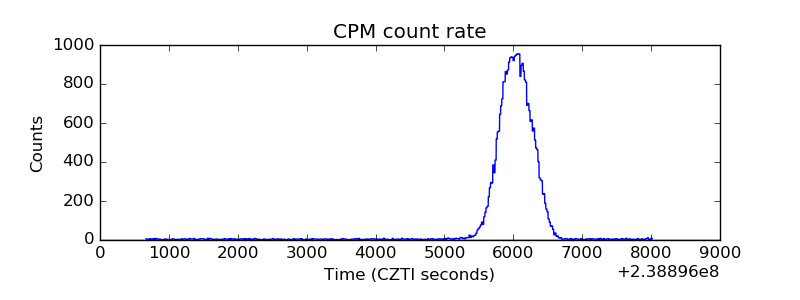 |
| CZT Counter | 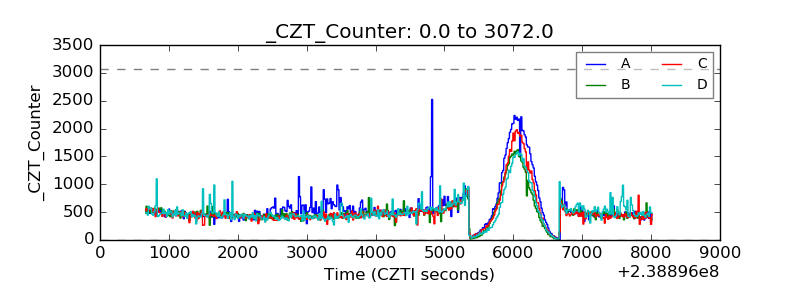 |
| +2.5 Volts monitor |  |
| +5 Volts monitor |  |
| _ROLL_ROT | 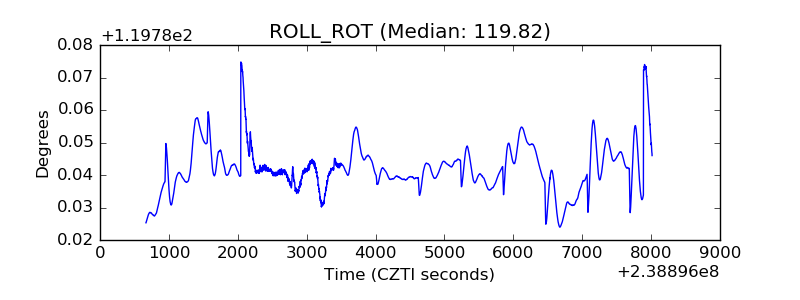 |
| _Roll_DEC | 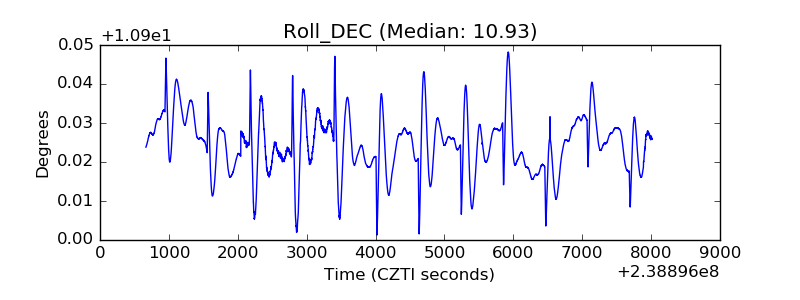 |
| _Roll_RA | 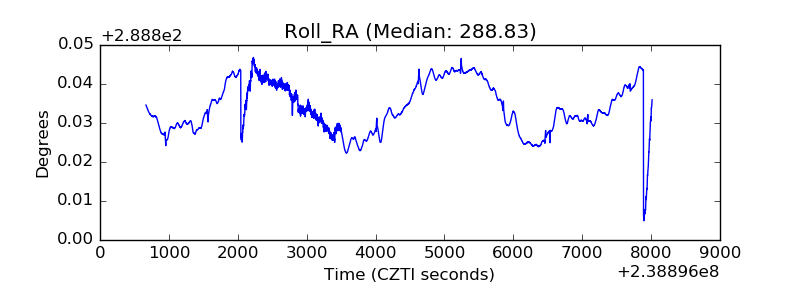 |
| Veto Counter | 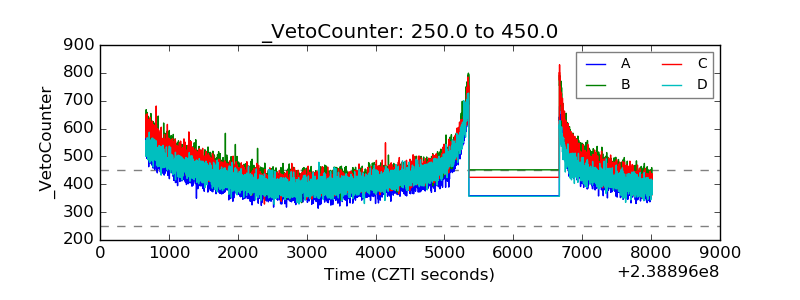 |