| Param | Original file | Final file |
|---|---|---|
| Filename | modeM0/AS1G07_046T01_9000001408_09902cztM0_level2.evt | modeM0/AS1G07_046T01_9000001408_09902cztM0_level2_quad_clean.evt |
| Size (bytes) | 347,806,080 | 68,967,360 |
| Size | 331.7 MB | 65.8 MB |
| Events in quadrant A | 2,571,669 | 433,189 |
| Events in quadrant B | 2,478,291 | 443,651 |
| Events in quadrant C | 2,405,534 | 435,352 |
| Events in quadrant D | 2,716,104 | 405,152 |
| Mode M0 | |||
|---|---|---|---|
| Quadrant | BADHDUFLAG | Total packets | Discarded packets |
| A | 0 | 13748 | 2708 |
| B | 0 | 13289 | 2513 |
| C | 0 | 13217 | 2458 |
| D | 0 | 14352 | 2830 |
| Mode SS | |||
|---|---|---|---|
| Quadrant | BADHDUFLAG | Total packets | Discarded packets |
| A | 0 | 132 | 20 |
| B | 0 | 131 | 21 |
| C | 0 | 132 | 24 |
| D | 0 | 132 | 20 |
| Mode M9 | |||
|---|---|---|---|
| Quadrant | BADHDUFLAG | Total packets | Discarded packets |
| A | 0 | 14 | 5 |
| B | 0 | 14 | 3 |
| C | 0 | 14 | 6 |
| D | 0 | 14 | 5 |
| Quadrant | Total seconds | Saturated seconds | Saturation percentage |
|---|---|---|---|
| A | 5283 | 15 | 0.283930% |
| B | 5277 | 12 | 0.227402% |
| C | 5280 | 13 | 0.246212% |
| D | 5244 | 4 | 0.076278% |
Noise dominated data is calculated using 1-second bins in cleaned event files. If a bin has >2000 counts, and if more than 50% of those come from <1% of pixels, then it is considered to be noise-dominated and hence unusable.
| Quadrant | # 1 sec bins | Bins with >0 counts | Bins with >2000 counts | High rate bins dominated by noise | Noise dominated (total time) | Noise dominated (detector-on time) | Marked lightcurve |
|---|---|---|---|---|---|---|---|
| A | 7500 | 5820 | 0 | 0 | 0.00% | 0.00% | 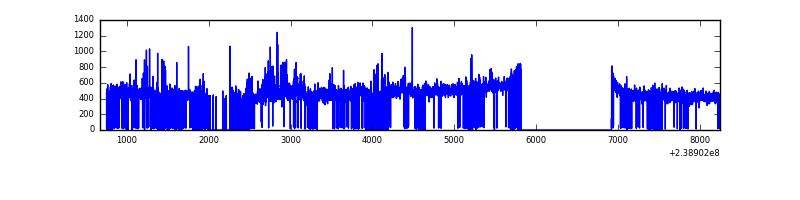 |
| B | 7523 | 5863 | 0 | 0 | 0.00% | 0.00% | 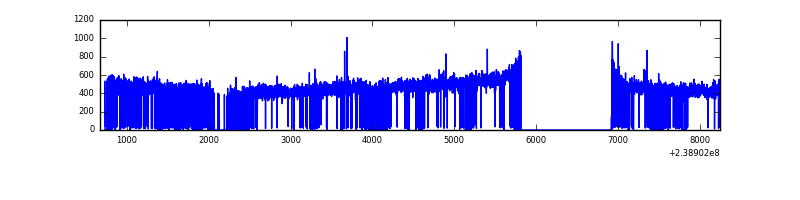 |
| C | 7581 | 5846 | 0 | 0 | 0.00% | 0.00% | 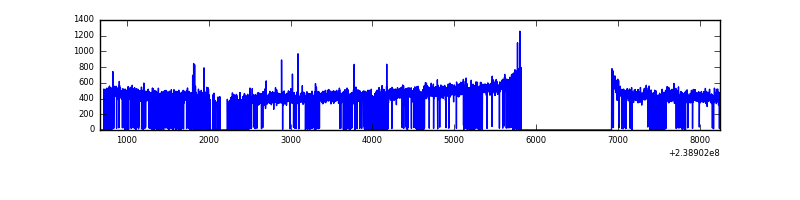 |
| D | 7509 | 5816 | 3 | 3 | 0.04% | 0.05% | 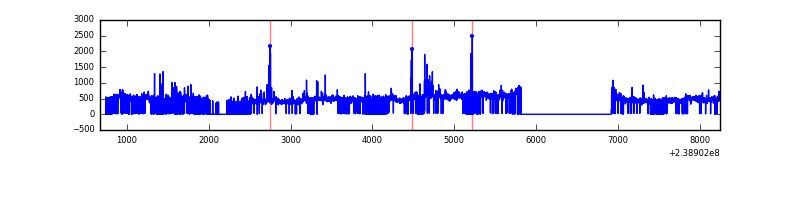 |
Top three noisy pixels from each quadrant. If the there are fewer than three noisy pixels in the level2.evt file, extra rows are filled as -1
| Pixel properties | Quadrant properties | ||||||
|---|---|---|---|---|---|---|---|
| Quadrant | DetID | PixID | Counts | Sigma | Mean | Median | Sigma |
| A | 15 | 239 | 141460 | 1095.65 | 631 | 617 | 128.5 |
| A | 0 | 226 | 5734 | 39.81 | 631 | 617 | 128.5 |
| A | 12 | 194 | 4915 | 33.44 | 631 | 617 | 128.5 |
| B | 12 | 111 | 14209 | 111.2 | 634 | 620 | 122.2 |
| B | 11 | 111 | 11781 | 91.33 | 634 | 620 | 122.2 |
| B | 14 | 111 | 9855 | 75.57 | 634 | 620 | 122.2 |
| C | 9 | 221 | 11631 | 76.7 | 613 | 618 | 143.6 |
| C | 13 | 61 | 4649 | 28.08 | 613 | 618 | 143.6 |
| C | 14 | 67 | 1985 | 9.52 | 613 | 618 | 143.6 |
| D | 8 | 195 | 229421 | 1478.72 | 594 | 581 | 154.8 |
| D | 1 | 52 | 96736 | 621.34 | 594 | 581 | 154.8 |
| D | 2 | 16 | 82628 | 530.17 | 594 | 581 | 154.8 |
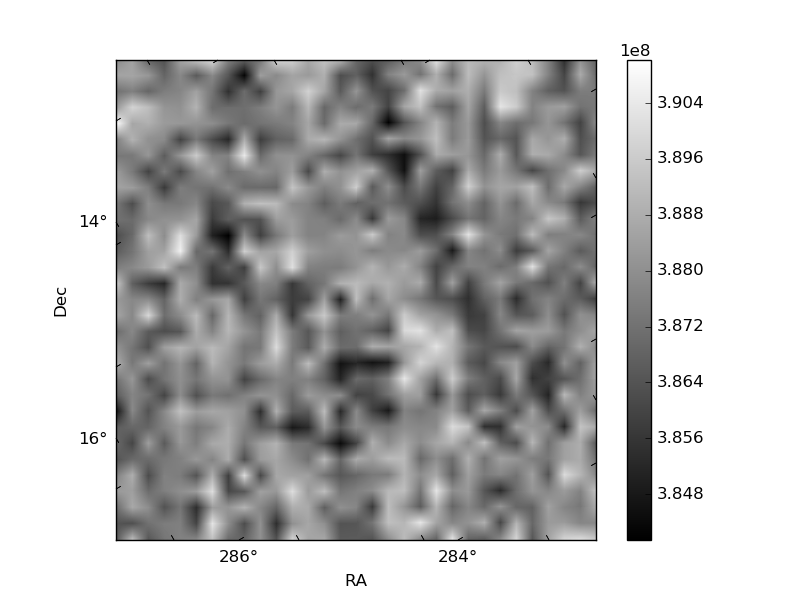
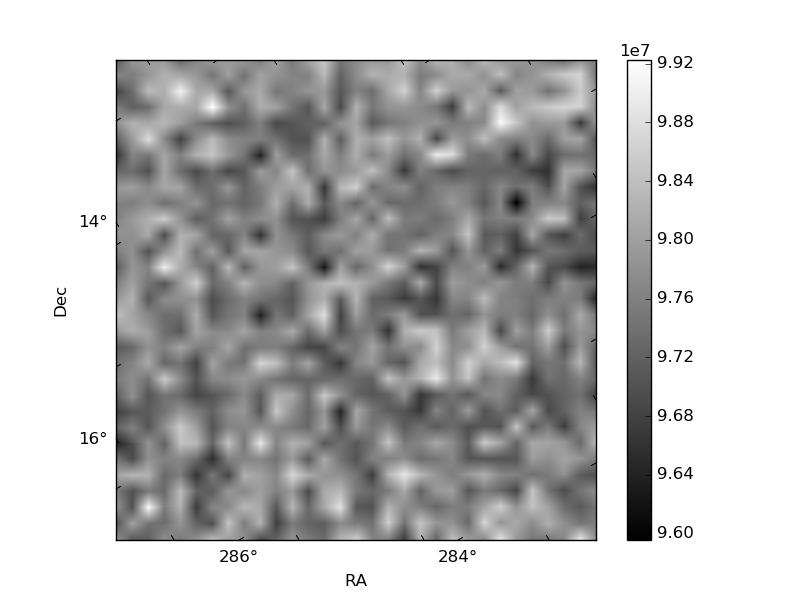
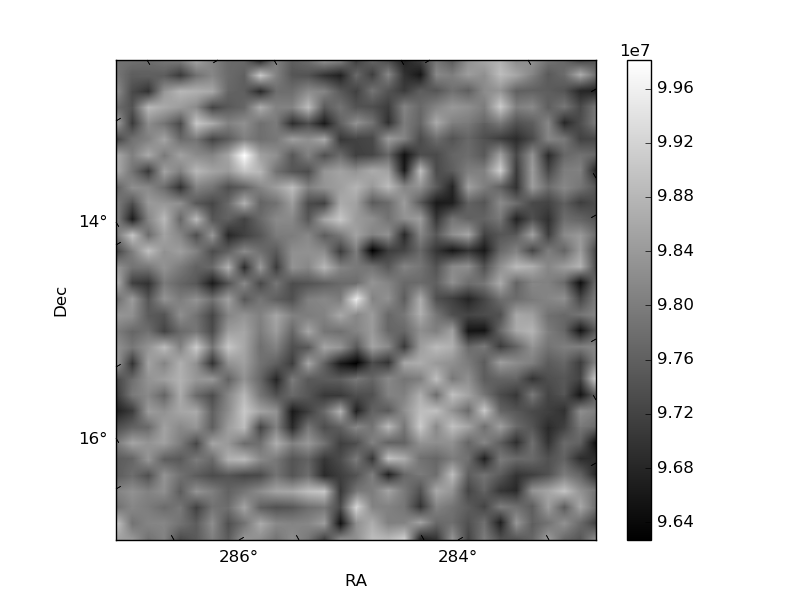
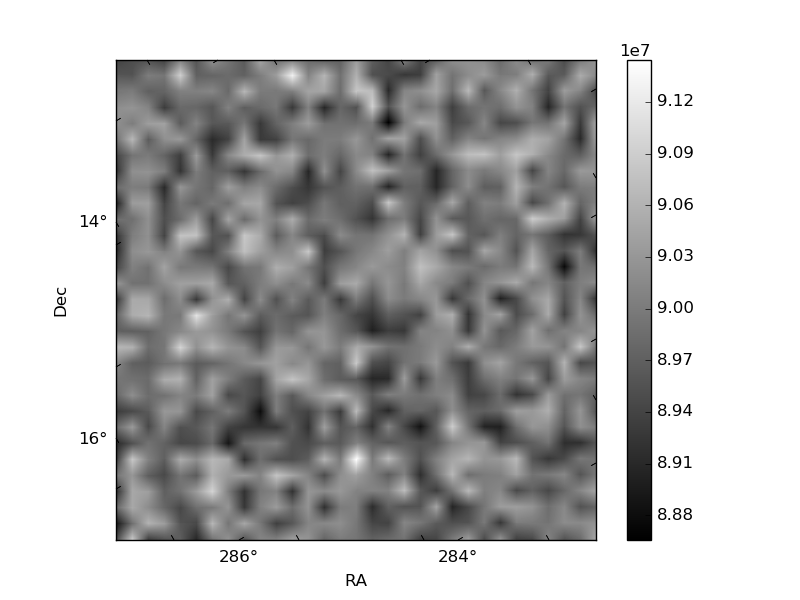
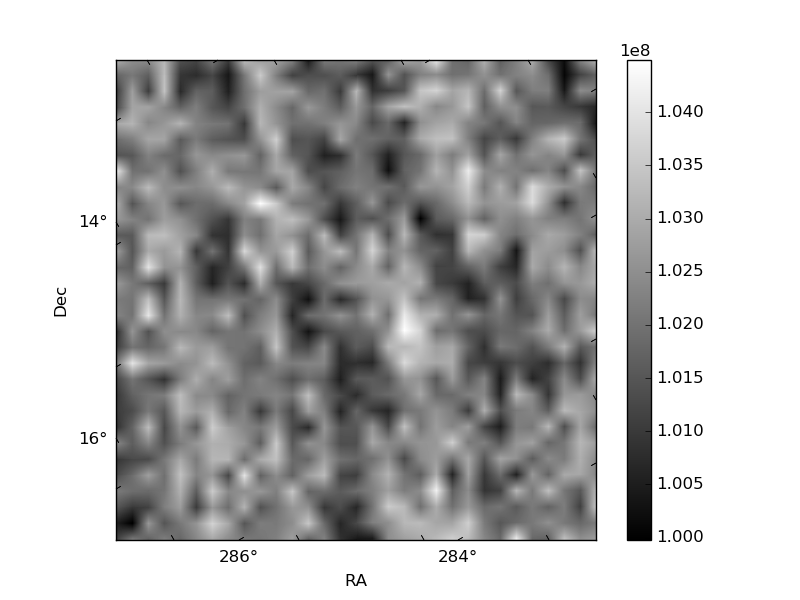
Histogram calculated using DETX and DETY for each event in the final _common_clean file
| Quadrant A | 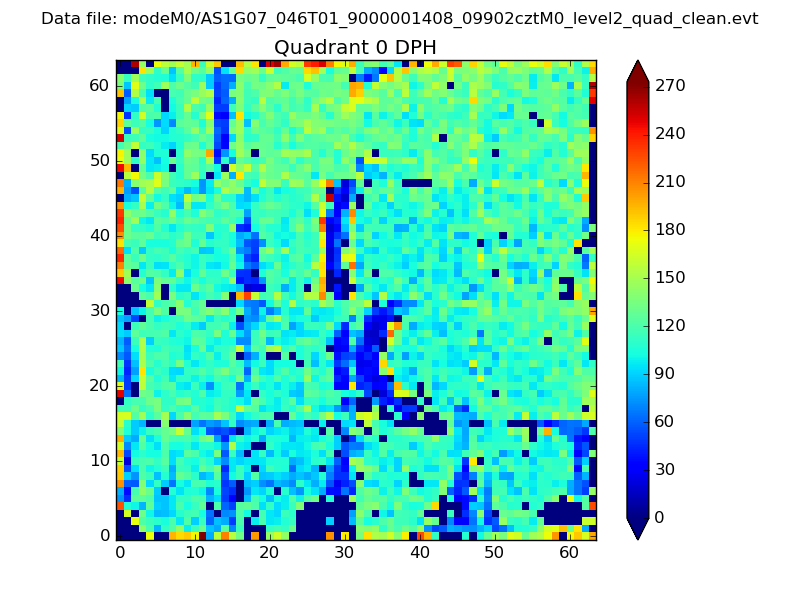 |
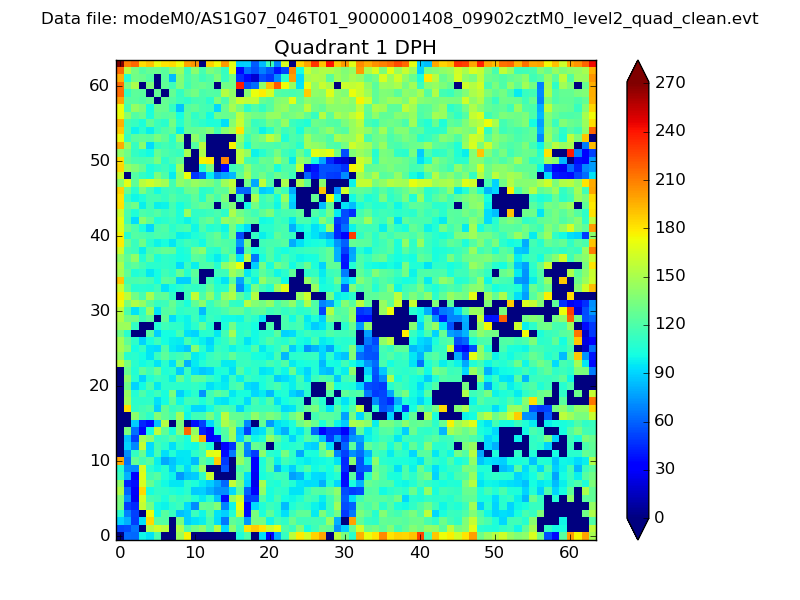 |
Quadrant B |
|---|---|---|---|
| Quadrant D | 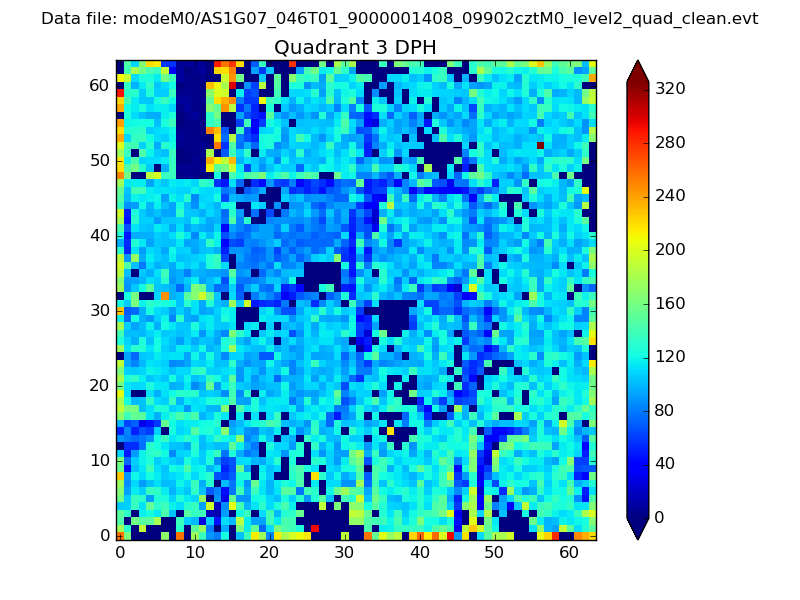 |
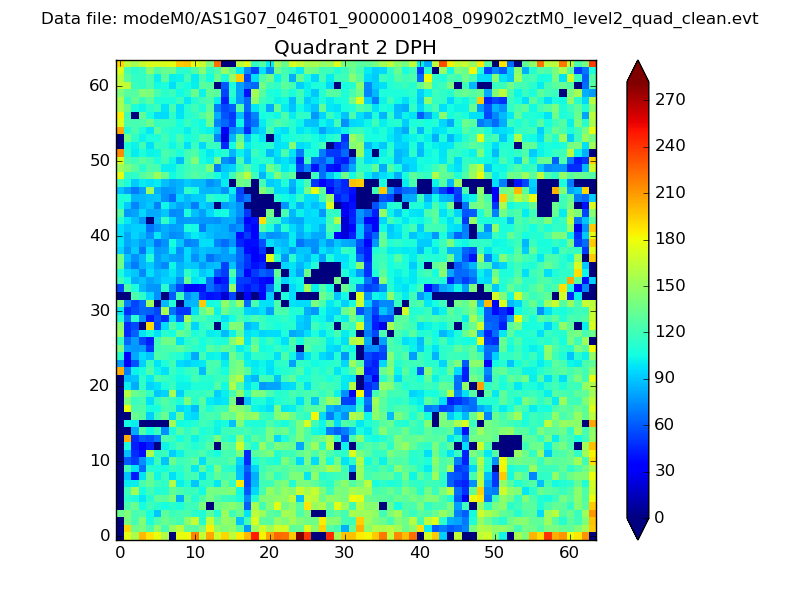 |
Quadrant C |
| Plot type | Count rate plots | Images |
|---|---|---|
| Comparison with Poisson distribution Blue bars denote a histogram of data divided into 1 sec bins. Red curve is a Poisson curve with rate = median count rate of data. |
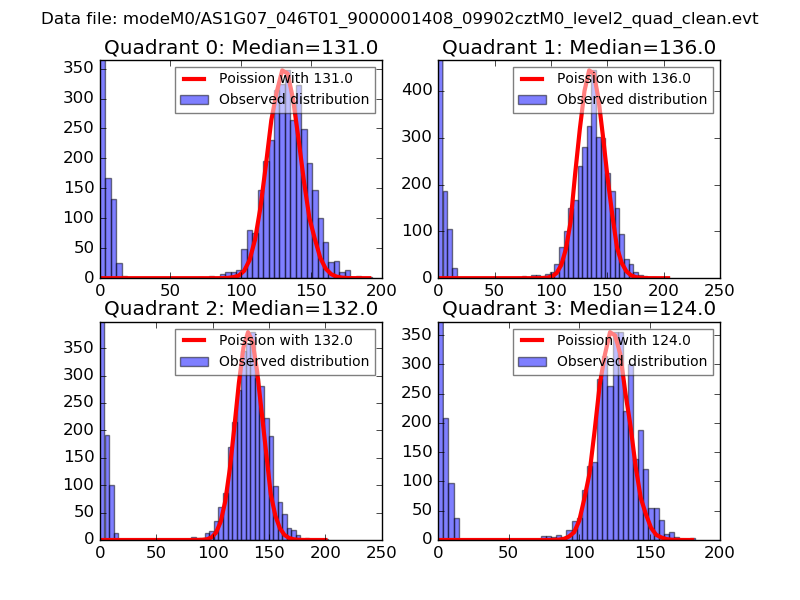 |
 |
| Quadrant-wise count rates Data is divided into 100 sec bins |
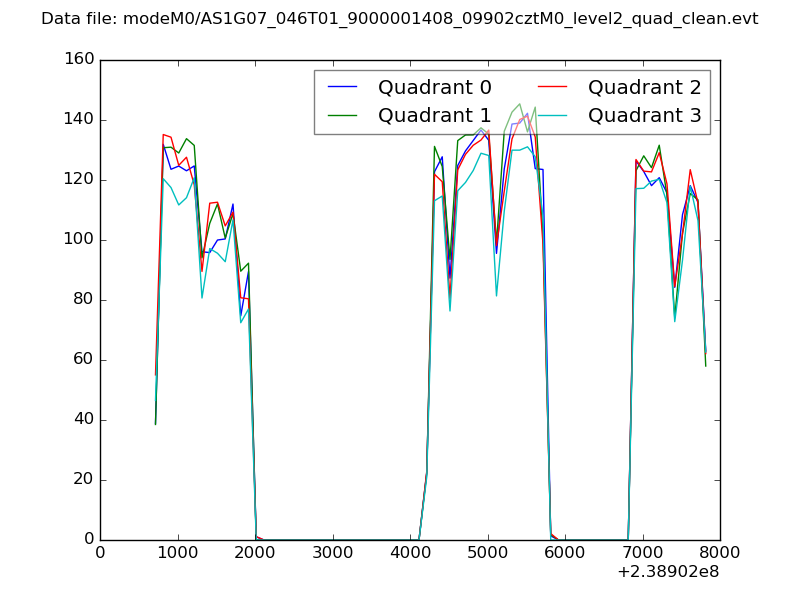 |
|
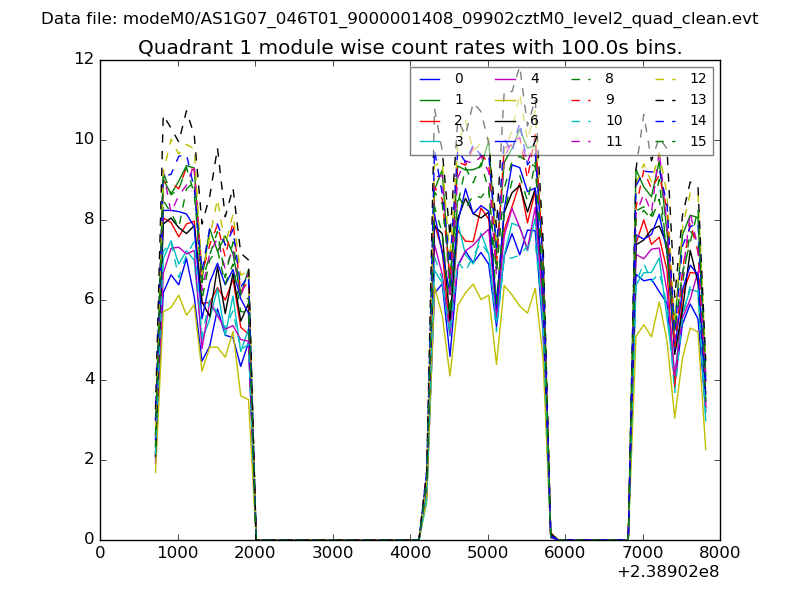
| Module-wise count rates for Quadrant A Data is divided into 100 sec bins |
 |
 |
| Module-wise count rates for Quadrant B Data is divided into 100 sec bins |
 |
 |
| Module-wise count rates for Quadrant C Data is divided into 100 sec bins |
 |
 |
| Module-wise count rates for Quadrant D Data is divided into 100 sec bins |
 |
 |
| Parameter | Plot |
|---|---|
| CZT HV Monitor | 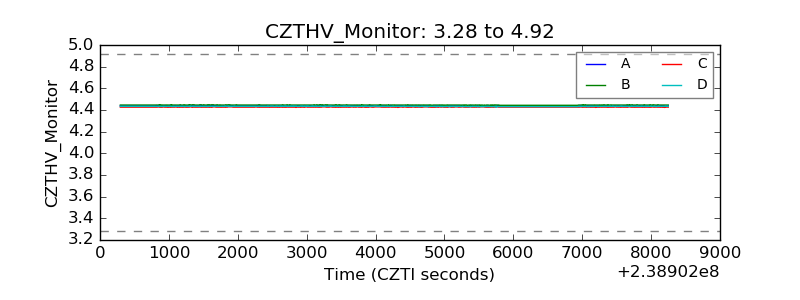 |
| D_VDD | 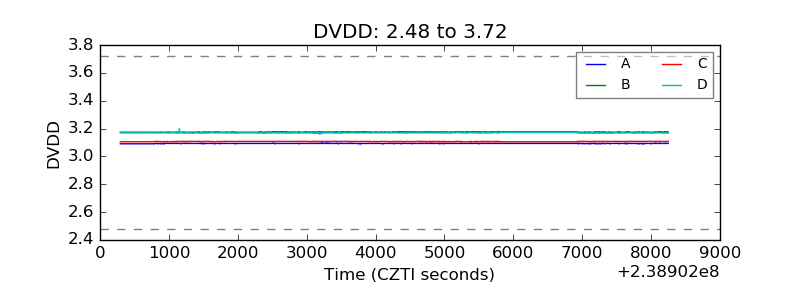 |
| Temperature 1 | 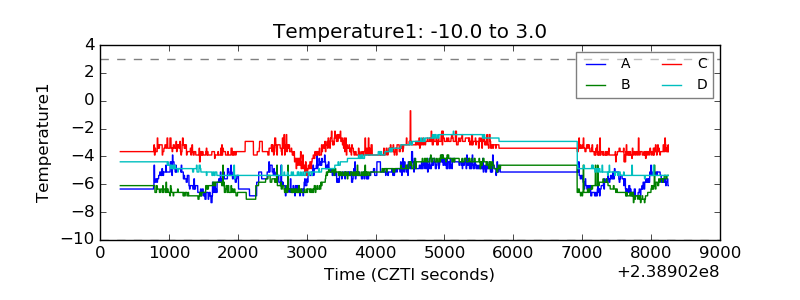 |
| Veto HV Monitor | 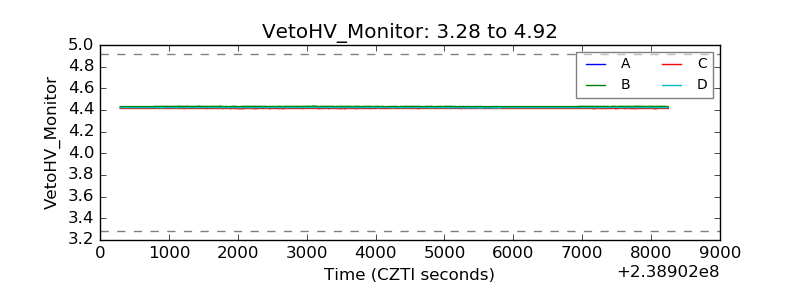 |
| Veto LLD | 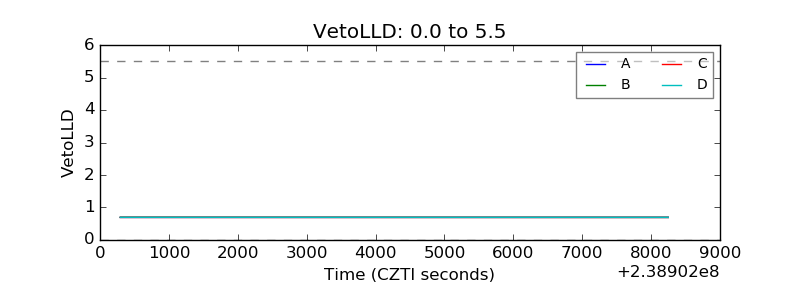 |
| Alpha Counter | 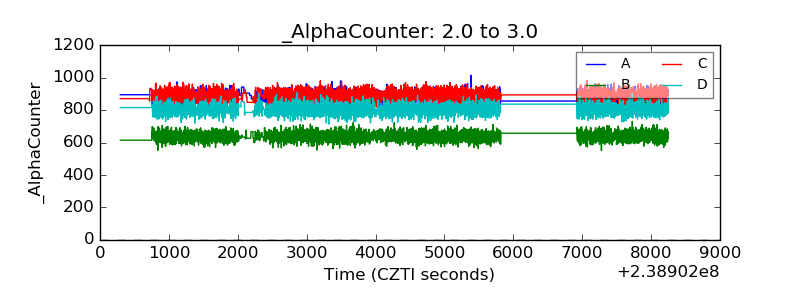 |
| _CPM_Rate | 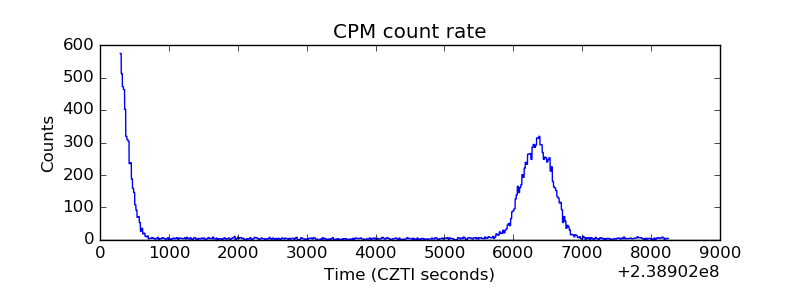 |
| CZT Counter | 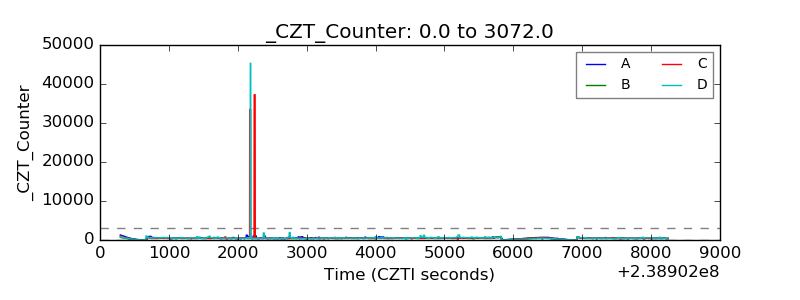 |
| +2.5 Volts monitor | 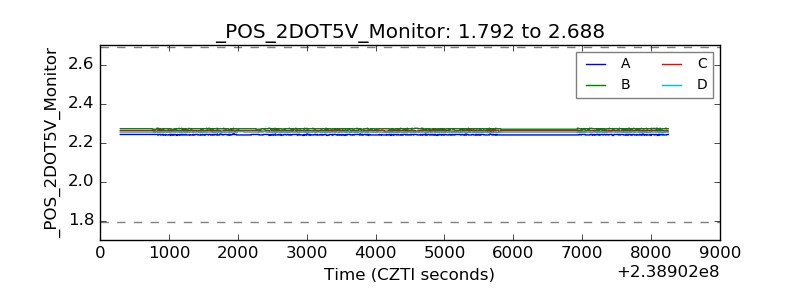 |
| +5 Volts monitor |  |
| _ROLL_ROT |  |
| _Roll_DEC |  |
| _Roll_RA | 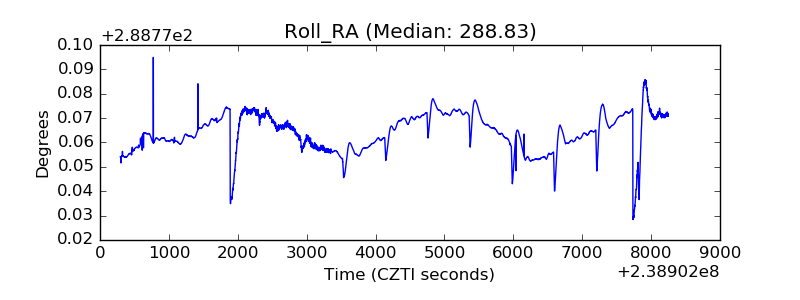 |
| Veto Counter |  |