| Param | Original file | Final file |
|---|---|---|
| Filename | modeM0/AS1G07_046T01_9000001408_09903cztM0_level2.evt | modeM0/AS1G07_046T01_9000001408_09903cztM0_level2_quad_clean.evt |
| Size (bytes) | 271,872,000 | 42,171,840 |
| Size | 259.3 MB | 40.2 MB |
| Events in quadrant A | 1,847,017 | 247,866 |
| Events in quadrant B | 1,888,301 | 254,368 |
| Events in quadrant C | 1,814,159 | 245,898 |
| Events in quadrant D | 2,396,655 | 231,919 |
| Mode M0 | |||
|---|---|---|---|
| Quadrant | BADHDUFLAG | Total packets | Discarded packets |
| A | 0 | 8458 | 1 |
| B | 0 | 8509 | 1 |
| C | 0 | 8465 | 1 |
| D | 0 | 9955 | 1 |
| Mode SS | |||
|---|---|---|---|
| Quadrant | BADHDUFLAG | Total packets | Discarded packets |
| A | 0 | 84 | 0 |
| B | 0 | 84 | 0 |
| C | 0 | 84 | 0 |
| D | 0 | 84 | 0 |
| Mode M9 | |||
|---|---|---|---|
| Quadrant | BADHDUFLAG | Total packets | Discarded packets |
| A | 0 | 5 | 0 |
| B | 0 | 5 | 0 |
| C | 0 | 5 | 0 |
| D | 0 | 6 | 0 |
| Quadrant | Total seconds | Saturated seconds | Saturation percentage |
|---|---|---|---|
| A | 4208 | 4 | 0.095057% |
| B | 4208 | 3 | 0.071293% |
| C | 4208 | 2 | 0.047529% |
| D | 4208 | 27 | 0.641635% |
Noise dominated data is calculated using 1-second bins in cleaned event files. If a bin has >2000 counts, and if more than 50% of those come from <1% of pixels, then it is considered to be noise-dominated and hence unusable.
| Quadrant | # 1 sec bins | Bins with >0 counts | Bins with >2000 counts | High rate bins dominated by noise | Noise dominated (total time) | Noise dominated (detector-on time) | Marked lightcurve |
|---|---|---|---|---|---|---|---|
| A | 4208 | 4208 | 0 | 0 | 0.00% | 0.00% |  |
| B | 4208 | 4208 | 0 | 0 | 0.00% | 0.00% |  |
| C | 4208 | 4208 | 1 | 1 | 0.02% | 0.02% |  |
| D | 4208 | 4208 | 10 | 10 | 0.24% | 0.24% |  |
Top three noisy pixels from each quadrant. If the there are fewer than three noisy pixels in the level2.evt file, extra rows are filled as -1
| Pixel properties | Quadrant properties | ||||||
|---|---|---|---|---|---|---|---|
| Quadrant | DetID | PixID | Counts | Sigma | Mean | Median | Sigma |
| A | 15 | 239 | 5827 | 54.31 | 478 | 468 | 98.7 |
| A | 0 | 226 | 4349 | 39.33 | 478 | 468 | 98.7 |
| A | 12 | 194 | 3658 | 32.33 | 478 | 468 | 98.7 |
| B | 12 | 111 | 11117 | 113.95 | 481 | 470 | 93.4 |
| B | 11 | 111 | 9254 | 94.01 | 481 | 470 | 93.4 |
| B | 10 | 252 | 7861 | 79.1 | 481 | 470 | 93.4 |
| C | 9 | 221 | 4419 | 36.14 | 463 | 466 | 109.4 |
| C | 13 | 61 | 3493 | 27.67 | 463 | 466 | 109.4 |
| C | 14 | 67 | 2355 | 17.27 | 463 | 466 | 109.4 |
| D | 2 | 16 | 298896 | 2498.84 | 453 | 442 | 119.4 |
| D | 8 | 195 | 215257 | 1798.56 | 453 | 442 | 119.4 |
| D | 9 | 85 | 71891 | 598.21 | 453 | 442 | 119.4 |
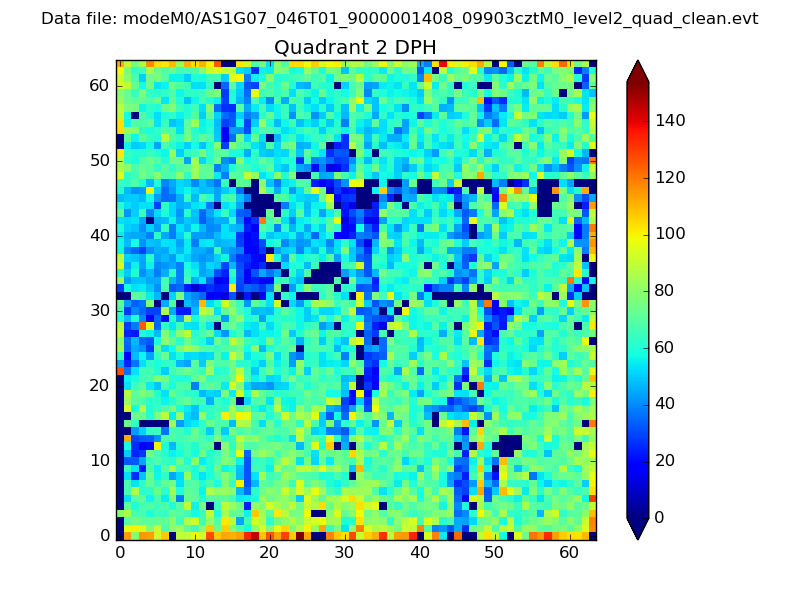
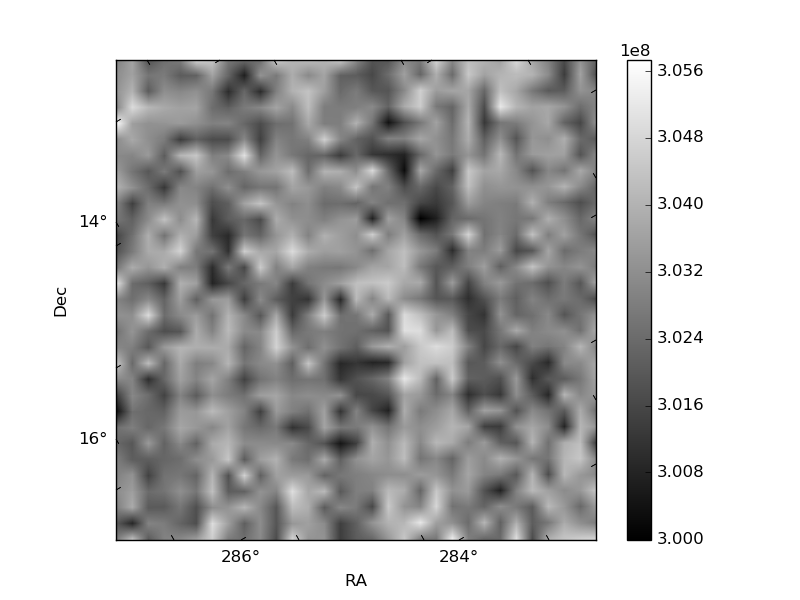
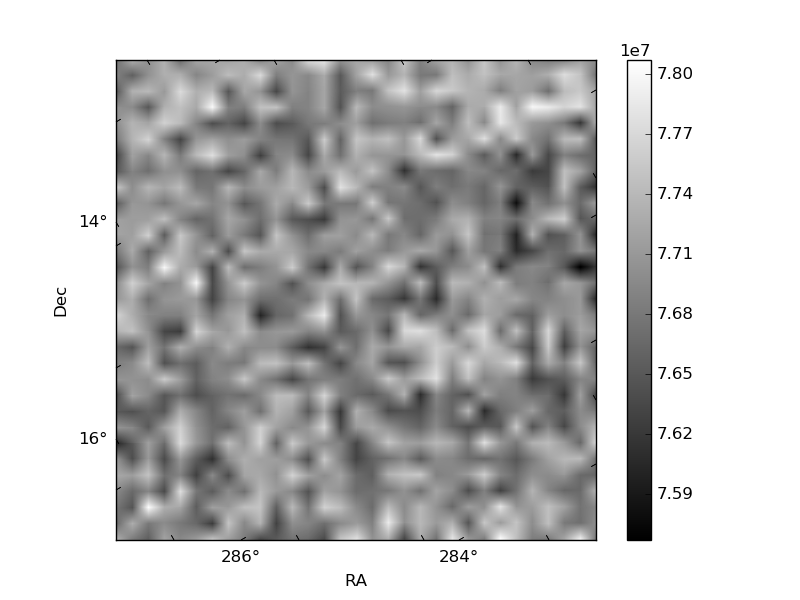
Histogram calculated using DETX and DETY for each event in the final _common_clean file
| Quadrant A | 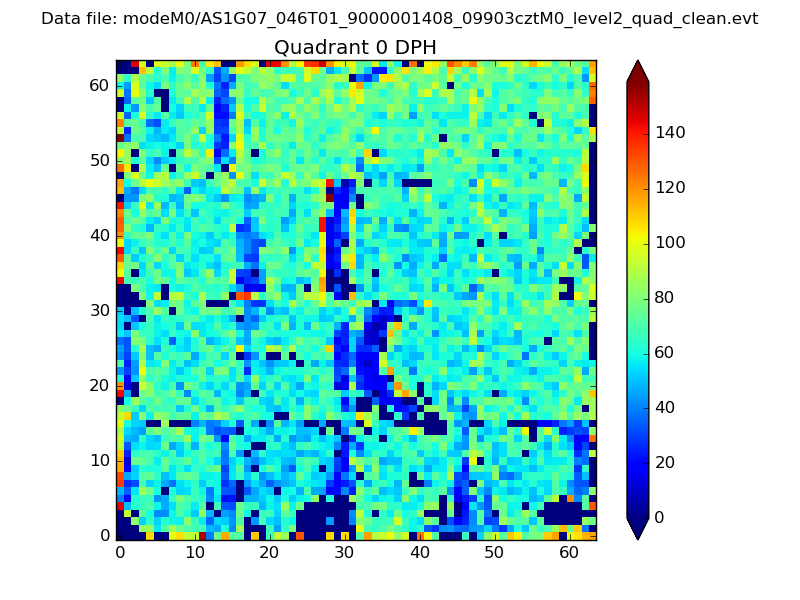 |
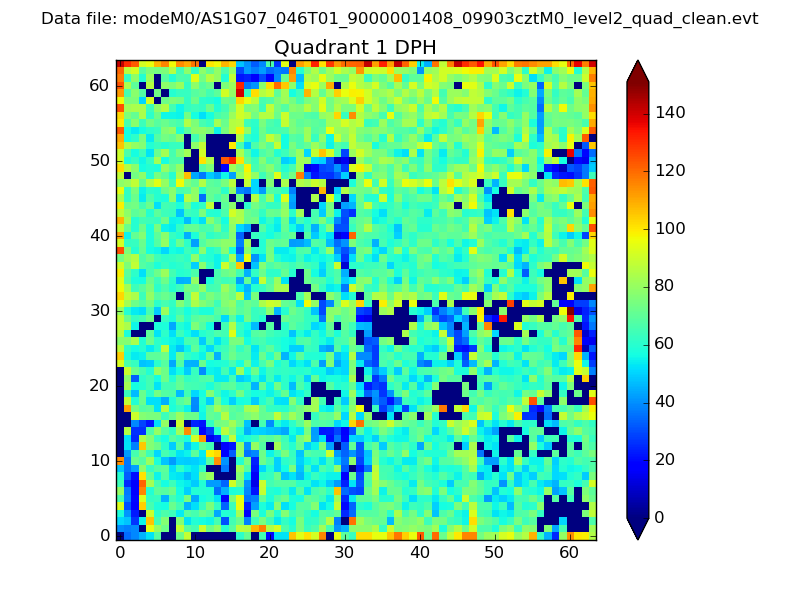 |
Quadrant B |
|---|---|---|---|
| Quadrant D | 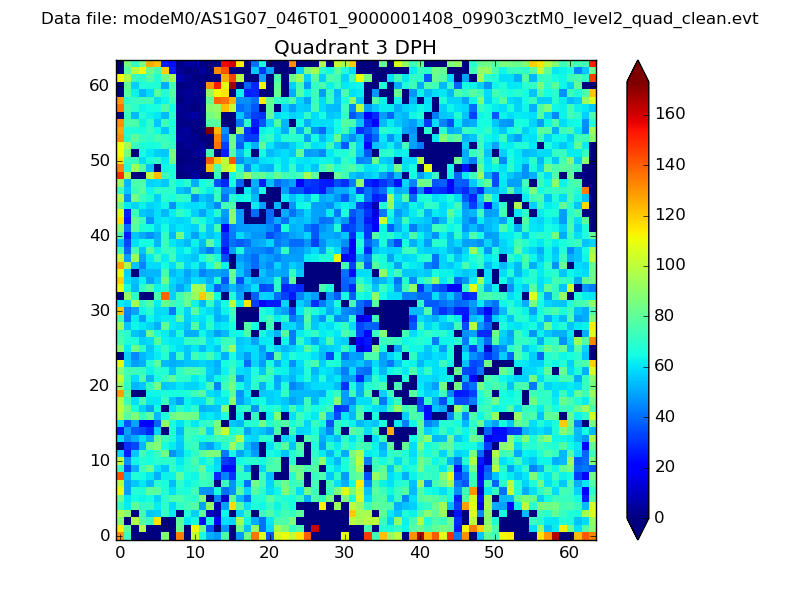 |
 |
Quadrant C |
| Plot type | Count rate plots | Images |
|---|---|---|
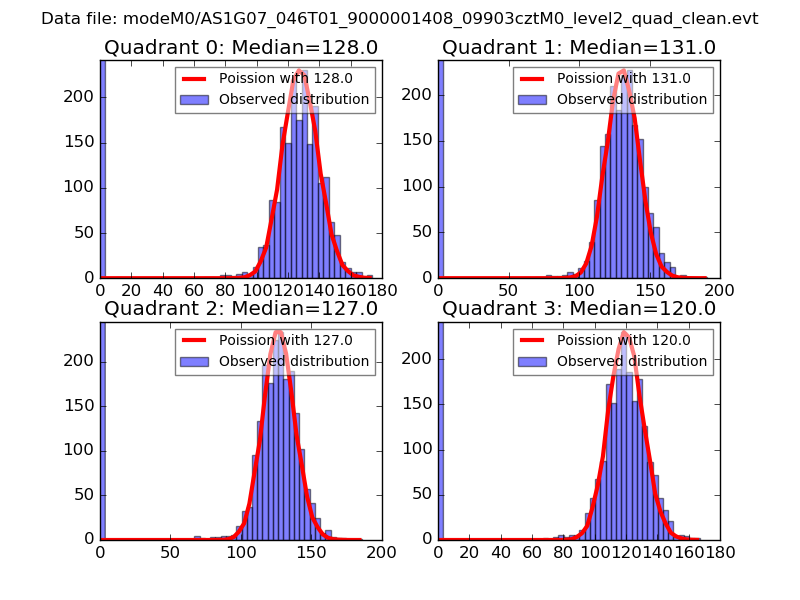
| Comparison with Poisson distribution Blue bars denote a histogram of data divided into 1 sec bins. Red curve is a Poisson curve with rate = median count rate of data. |
 |
 |
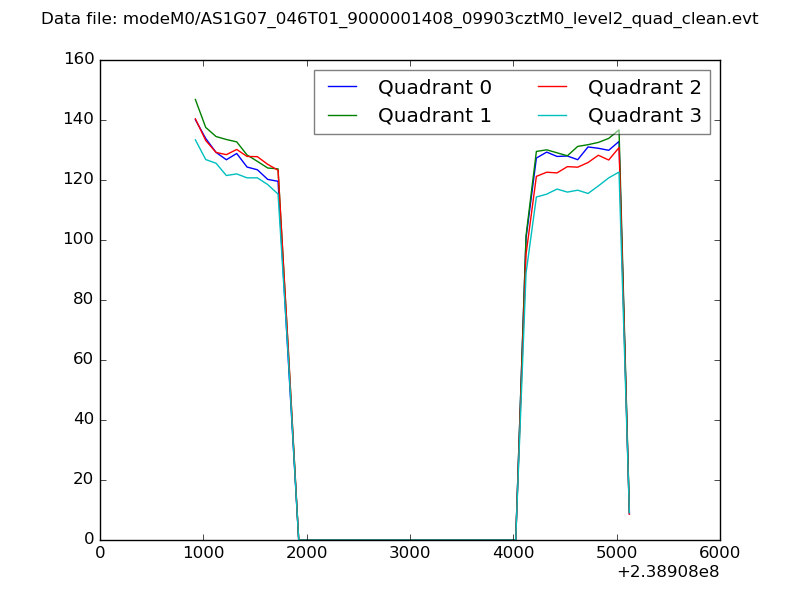
| Quadrant-wise count rates Data is divided into 100 sec bins |
 |
|
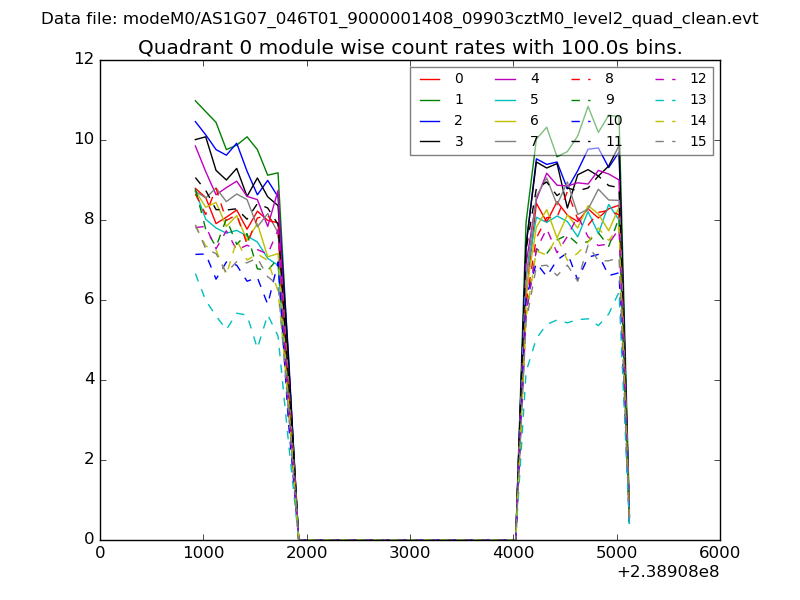
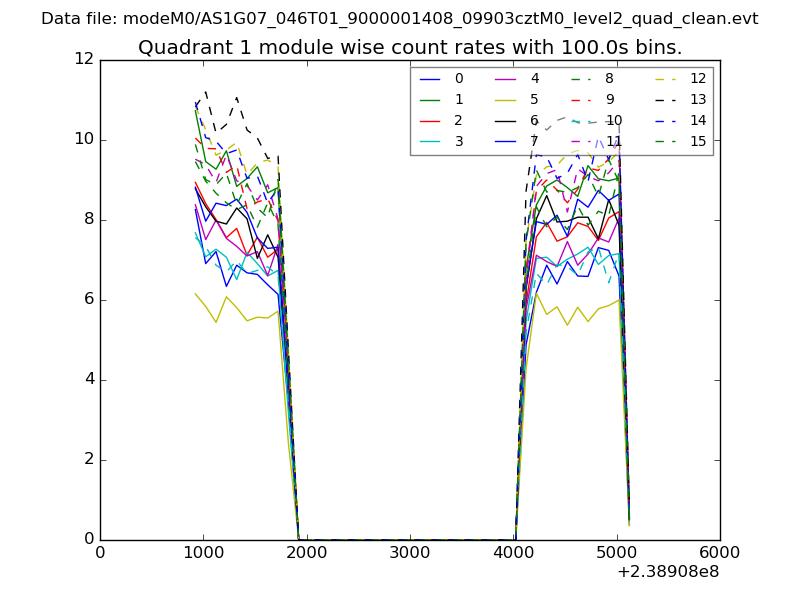
| Module-wise count rates for Quadrant A Data is divided into 100 sec bins |
 |
 |
| Module-wise count rates for Quadrant B Data is divided into 100 sec bins |
 |
 |
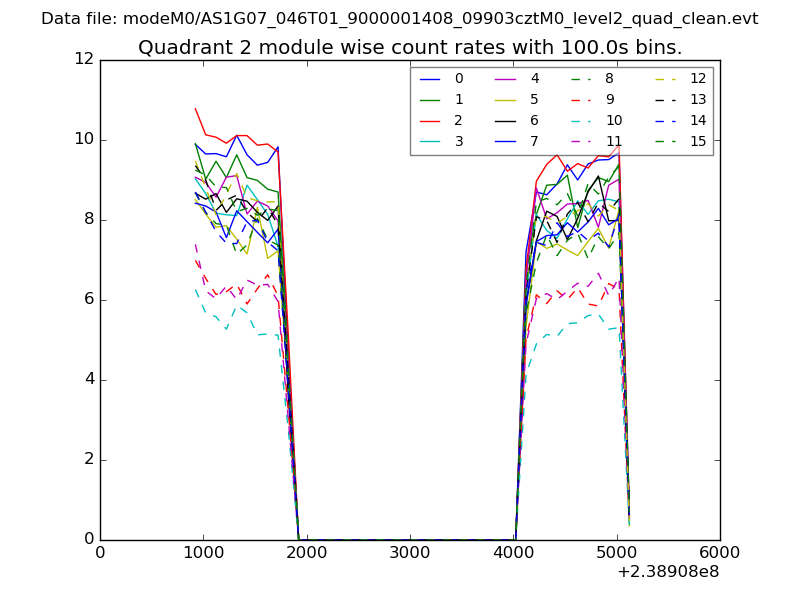
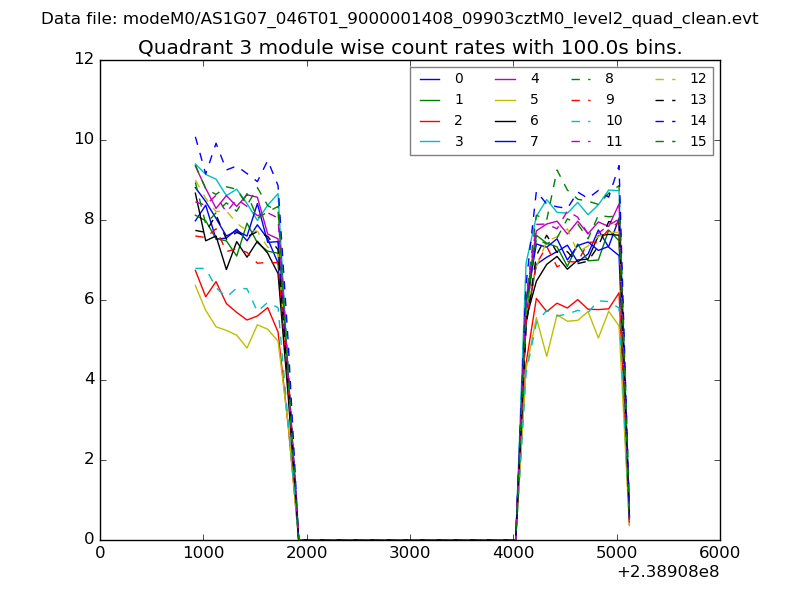
| Module-wise count rates for Quadrant C Data is divided into 100 sec bins |
 |
 |
| Module-wise count rates for Quadrant D Data is divided into 100 sec bins |
 |
 |
| Parameter | Plot |
|---|---|
| CZT HV Monitor | 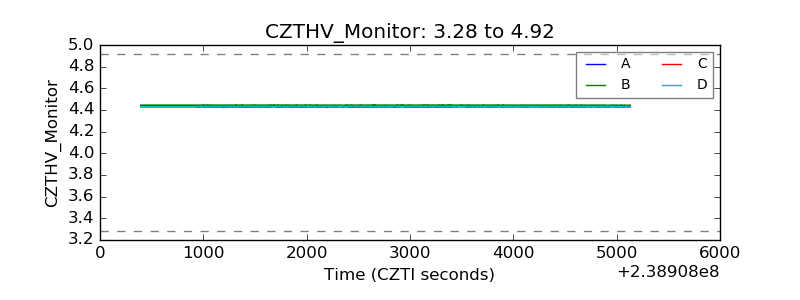 |
| D_VDD |  |
| Temperature 1 | 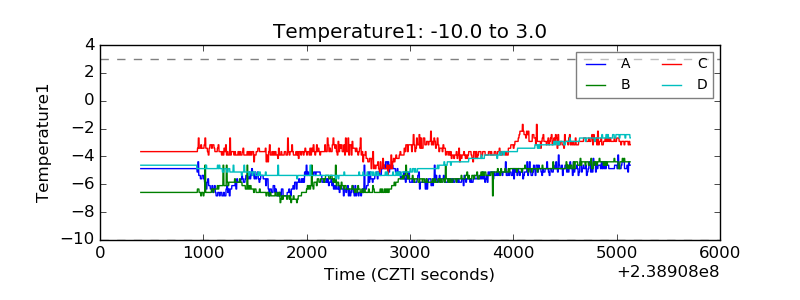 |
| Veto HV Monitor | 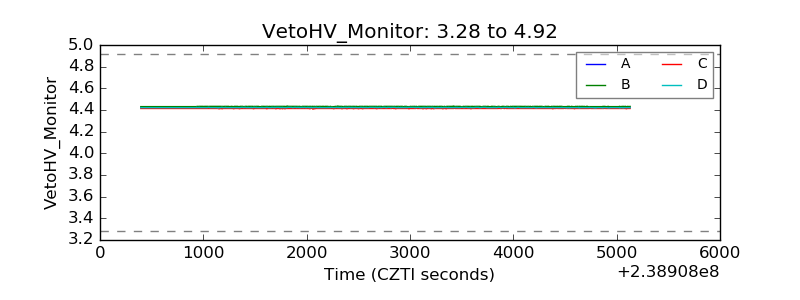 |
| Veto LLD | 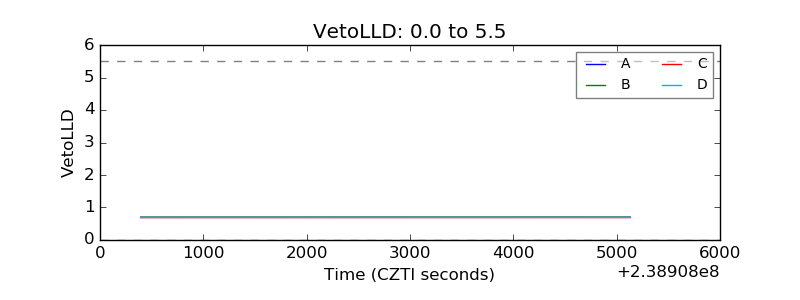 |
| Alpha Counter | 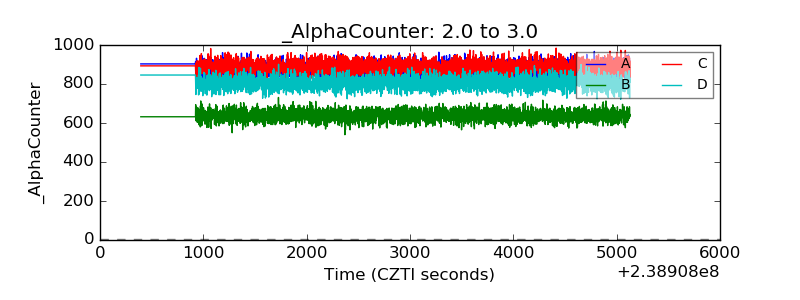 |
| _CPM_Rate | 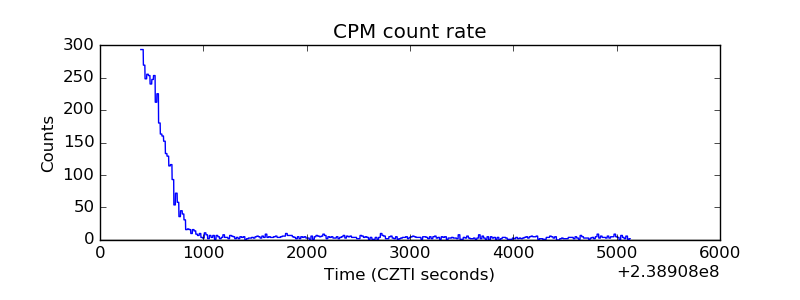 |
| CZT Counter | 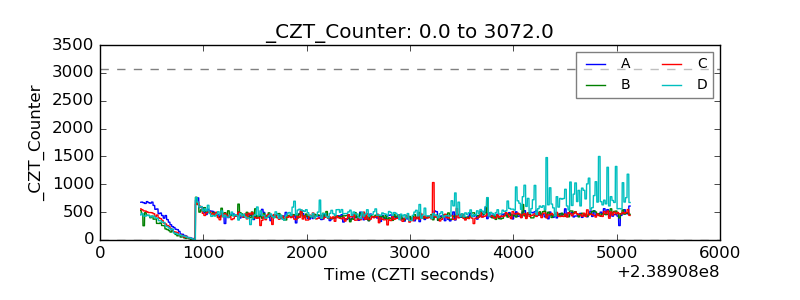 |
| +2.5 Volts monitor |  |
| +5 Volts monitor |  |
| _ROLL_ROT | 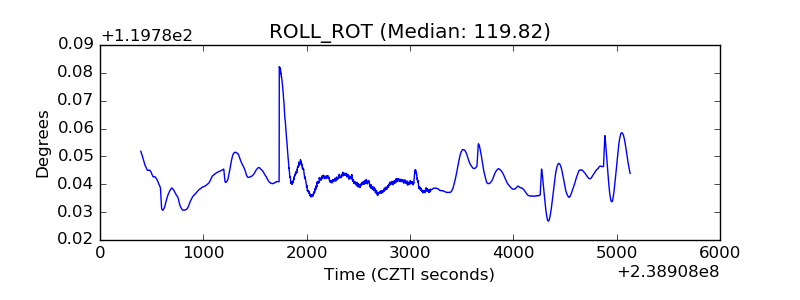 |
| _Roll_DEC | 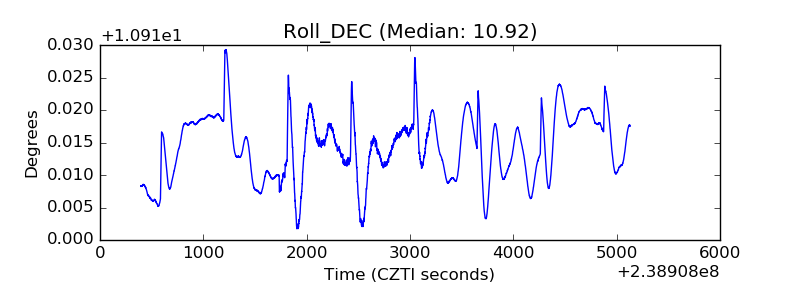 |
| _Roll_RA | 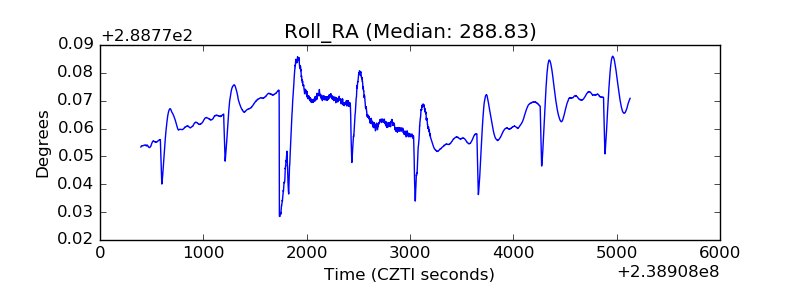 |
| Veto Counter | 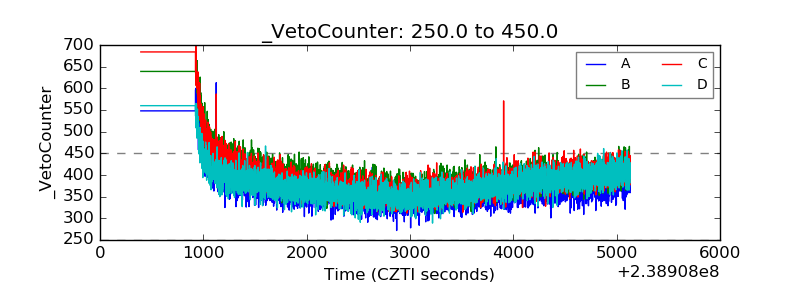 |