| Param | Original file | Final file |
|---|---|---|
| Filename | modeM0/AS1A03_009T01_9000001412cztM0_level2.fits | modeM0/AS1A03_009T01_9000001412cztM0_level2_quad_clean.evt |
| Size (bytes) | 308,200,320 | 287,536,320 |
| Size | 293.9 MB | 274.2 MB |
| Events in quadrant A | 1,858,606 | 1,679,071 |
| Events in quadrant B | 1,805,160 | 1,686,822 |
| Events in quadrant C | 1,862,258 | 1,649,894 |
| Events in quadrant D | 1,510,104 | 1,396,138 |
| Mode SS | |||
|---|---|---|---|
| Quadrant | BADHDUFLAG | Total packets | Discarded packets |
| A | 0 | 692 | 0 |
| B | 0 | 680 | 0 |
| C | 0 | 692 | 0 |
| D | 0 | 688 | 0 |
| Mode M0 | |||
|---|---|---|---|
| Quadrant | BADHDUFLAG | Total packets | Discarded packets |
| A | 0 | 72002 | 0 |
| B | 0 | 71231 | 0 |
| C | 0 | 69208 | 0 |
| D | 0 | 97475 | 0 |
| Mode M9 | |||
|---|---|---|---|
| Quadrant | BADHDUFLAG | Total packets | Discarded packets |
| A | 0 | 40 | 0 |
| B | 0 | 40 | 0 |
| C | 0 | 40 | 0 |
| D | 0 | 40 | 0 |
| Quadrant | Total seconds | Saturated seconds | Saturation percentage |
|---|---|---|---|
| A | 33530 | 748 | 2.230838% |
| B | 33541 | 766 | 2.283772% |
| C | 33613 | 561 | 1.668997% |
| D | 32747 | 1763 | 5.383699% |
Noise dominated data is calculated using 1-second bins in cleaned event files. If a bin has >2000 counts, and if more than 50% of those come from <1% of pixels, then it is considered to be noise-dominated and hence unusable.
| Quadrant | # 1 sec bins | Bins with >0 counts | Bins with >2000 counts | High rate bins dominated by noise | Noise dominated (total time) | Noise dominated (detector-on time) | Marked lightcurve |
|---|---|---|---|---|---|---|---|
| A | 39645 | 33852 | 0 | 0 | 0.00% | 0.00% |  |
| B | 39646 | 33901 | 0 | 0 | 0.00% | 0.00% |  |
| C | 39645 | 33943 | 0 | 0 | 0.00% | 0.00% |  |
| D | 39645 | 33014 | 0 | 0 | 0.00% | 0.00% |  |
Top three noisy pixels from each quadrant. If the there are fewer than three noisy pixels in the level2.evt file, extra rows are filled as -1
| Pixel properties | Quadrant properties | ||||||
|---|---|---|---|---|---|---|---|
| Quadrant | DetID | PixID | Counts | Sigma | Mean | Median | Sigma |
| A | 0 | 29 | 1826 | 11.17 | 483 | 450 | 123.2 |
| A | 7 | 110 | 1504 | 8.56 | 483 | 450 | 123.2 |
| A | 0 | 30 | 1414 | 7.83 | 483 | 450 | 123.2 |
| B | 2 | 9 | 1518 | 11.1 | 477 | 454 | 95.8 |
| B | 3 | 17 | 1238 | 8.18 | 477 | 454 | 95.8 |
| B | 3 | 80 | 1215 | 7.94 | 477 | 454 | 95.8 |
| C | 1 | 81 | 1425 | 7.52 | 491 | 456 | 128.9 |
| C | 1 | 80 | 1354 | 6.97 | 491 | 456 | 128.9 |
| C | 12 | 241 | 1294 | 6.5 | 491 | 456 | 128.9 |
| D | 6 | 231 | 1124 | 6.26 | 431 | 391 | 117.2 |
| D | 3 | 14 | 1113 | 6.16 | 431 | 391 | 117.2 |
| D | 10 | 189 | 1088 | 5.95 | 431 | 391 | 117.2 |
Histogram calculated using DETX and DETY for each event in the final _common_clean file
| Quadrant A |  |
 |
Quadrant B |
|---|---|---|---|
| Quadrant D |  |
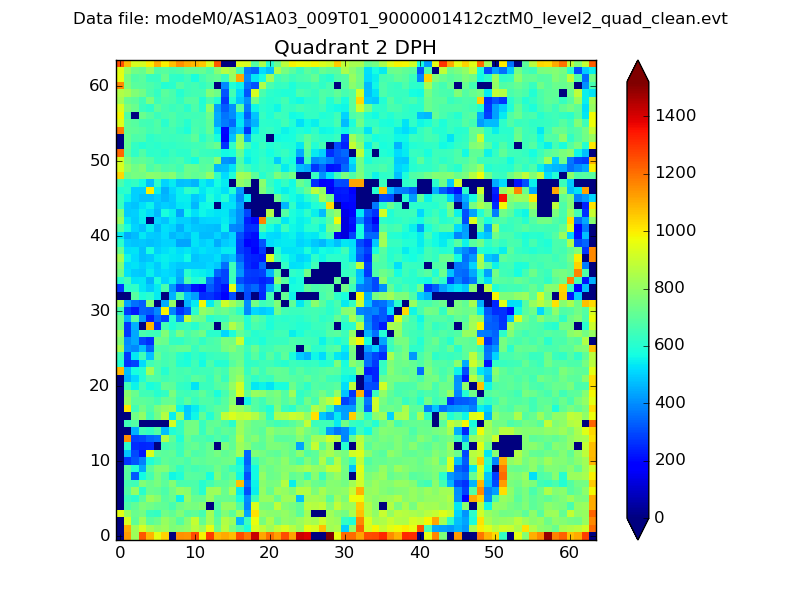 |
Quadrant C |
| Plot type | Count rate plots | Images |
|---|---|---|
| Comparison with Poisson distribution Blue bars denote a histogram of data divided into 1 sec bins. Red curve is a Poisson curve with rate = median count rate of data. |
 |
 |
| Quadrant-wise count rates Data is divided into 100 sec bins |
 |
|
| Module-wise count rates for Quadrant A Data is divided into 100 sec bins |
 |
 |
| Module-wise count rates for Quadrant B Data is divided into 100 sec bins |
 |
 |
| Module-wise count rates for Quadrant C Data is divided into 100 sec bins |
 |
 |
| Module-wise count rates for Quadrant D Data is divided into 100 sec bins |
 |
 |
| Parameter | Plot |
|---|---|
| CZT HV Monitor |  |
| D_VDD | 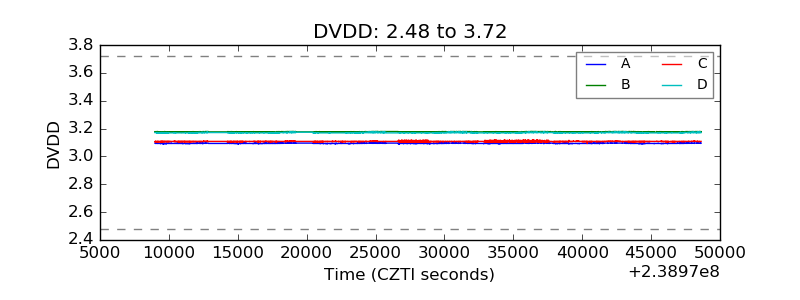 |
| Temperature 1 |  |
| Veto HV Monitor |  |
| Veto LLD |  |
| Alpha Counter |  |
| _CPM_Rate |  |
| CZT Counter |  |
| +2.5 Volts monitor |  |
| +5 Volts monitor |  |
| _ROLL_ROT |  |
| _Roll_DEC |  |
| _Roll_RA |  |
| Veto Counter |  |