| Param | Original file | Final file |
|---|---|---|
| Filename | modeM0/AS1A03_009T01_9000001412_09914cztM0_level2.evt | modeM0/AS1A03_009T01_9000001412_09914cztM0_level2_quad_clean.evt |
| Size (bytes) | 20,093,760 | 5,345,280 |
| Size | 19.2 MB | 5.1 MB |
| Events in quadrant A | 145,816 | 33,978 |
| Events in quadrant B | 123,616 | 34,790 |
| Events in quadrant C | 112,946 | 34,136 |
| Events in quadrant D | 204,940 | 32,115 |
| Mode SS | |||
|---|---|---|---|
| Quadrant | BADHDUFLAG | Total packets | Discarded packets |
| A | 0 | 6 | 0 |
| B | 0 | 6 | 0 |
| C | 0 | 6 | 0 |
| D | 0 | 6 | 0 |
| Mode M0 | |||
|---|---|---|---|
| Quadrant | BADHDUFLAG | Total packets | Discarded packets |
| A | 0 | 585 | 1 |
| B | 0 | 526 | 0 |
| C | 0 | 509 | 0 |
| D | 0 | 803 | 0 |
| Quadrant | Total seconds | Saturated seconds | Saturation percentage |
|---|---|---|---|
| A | 254 | 0 | 0.000000% |
| B | 254 | 1 | 0.393701% |
| C | 254 | 0 | 0.000000% |
| D | 254 | 0 | 0.000000% |
Noise dominated data is calculated using 1-second bins in cleaned event files. If a bin has >2000 counts, and if more than 50% of those come from <1% of pixels, then it is considered to be noise-dominated and hence unusable.
| Quadrant | # 1 sec bins | Bins with >0 counts | Bins with >2000 counts | High rate bins dominated by noise | Noise dominated (total time) | Noise dominated (detector-on time) | Marked lightcurve |
|---|---|---|---|---|---|---|---|
| A | 253 | 253 | 0 | 0 | 0.00% | 0.00% | 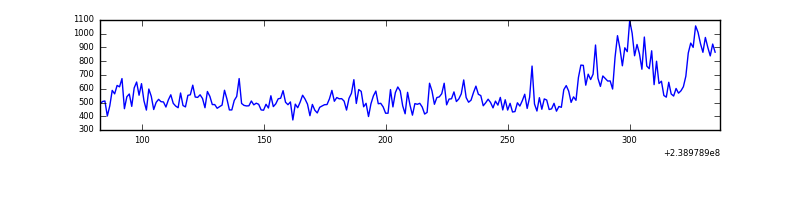 |
| B | 254 | 254 | 0 | 0 | 0.00% | 0.00% | 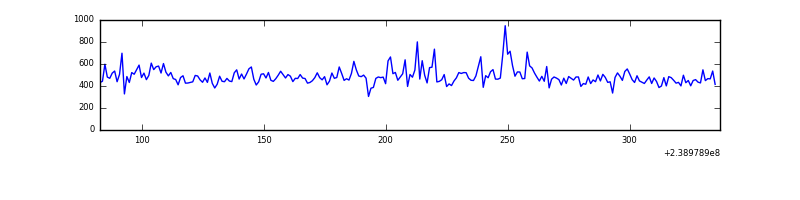 |
| C | 254 | 254 | 0 | 0 | 0.00% | 0.00% | 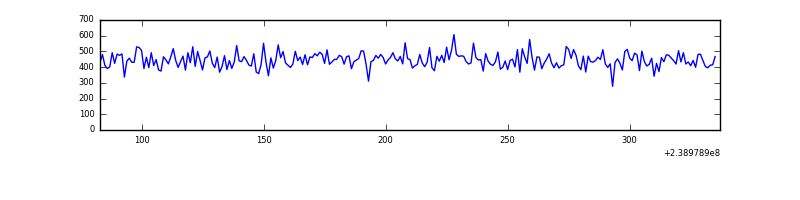 |
| D | 254 | 254 | 1 | 1 | 0.39% | 0.39% | 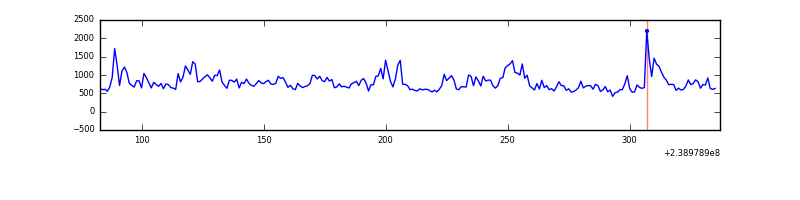 |
Top three noisy pixels from each quadrant. If the there are fewer than three noisy pixels in the level2.evt file, extra rows are filled as -1
| Pixel properties | Quadrant properties | ||||||
|---|---|---|---|---|---|---|---|
| Quadrant | DetID | PixID | Counts | Sigma | Mean | Median | Sigma |
| A | 15 | 239 | 33099 | 4146.15 | 28 | 28 | 8.0 |
| A | 14 | 254 | 652 | 78.23 | 28 | 28 | 8.0 |
| A | 0 | 226 | 307 | 34.98 | 28 | 28 | 8.0 |
| B | 4 | 173 | 4993 | 643.38 | 29 | 29 | 7.7 |
| B | 4 | 239 | 2620 | 335.82 | 29 | 29 | 7.7 |
| B | 12 | 111 | 525 | 64.29 | 29 | 29 | 7.7 |
| C | 12 | 4 | 505 | 56.81 | 28 | 28 | 8.4 |
| C | 8 | 222 | 401 | 44.42 | 28 | 28 | 8.4 |
| C | 9 | 221 | 315 | 34.18 | 28 | 28 | 8.4 |
| D | 2 | 16 | 33433 | 3792.53 | 27 | 26 | 8.8 |
| D | 8 | 195 | 31692 | 3594.89 | 27 | 26 | 8.8 |
| D | 2 | 33 | 15230 | 1726.04 | 27 | 26 | 8.8 |
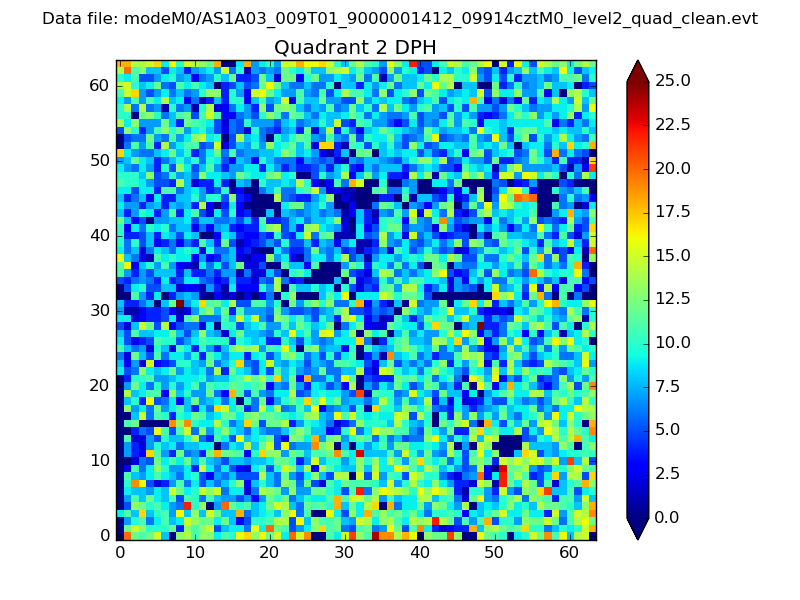
Histogram calculated using DETX and DETY for each event in the final _common_clean file
| Quadrant A | 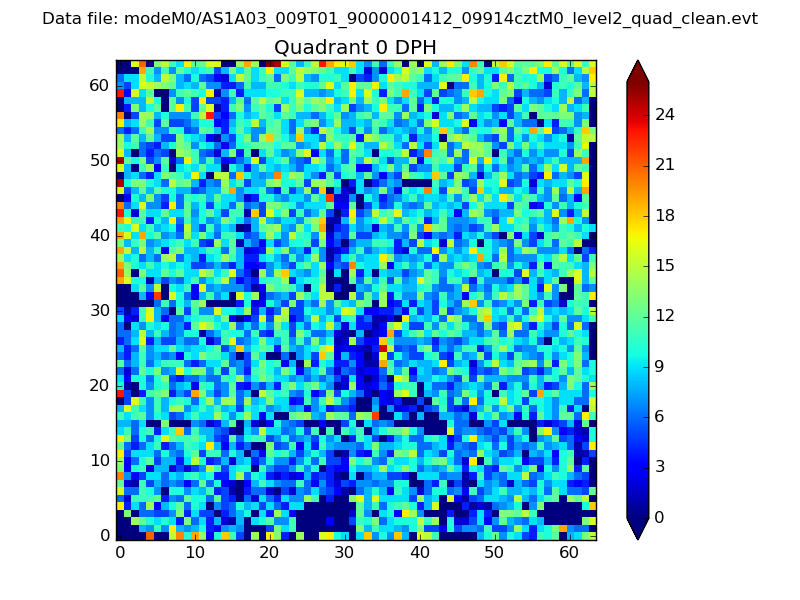 |
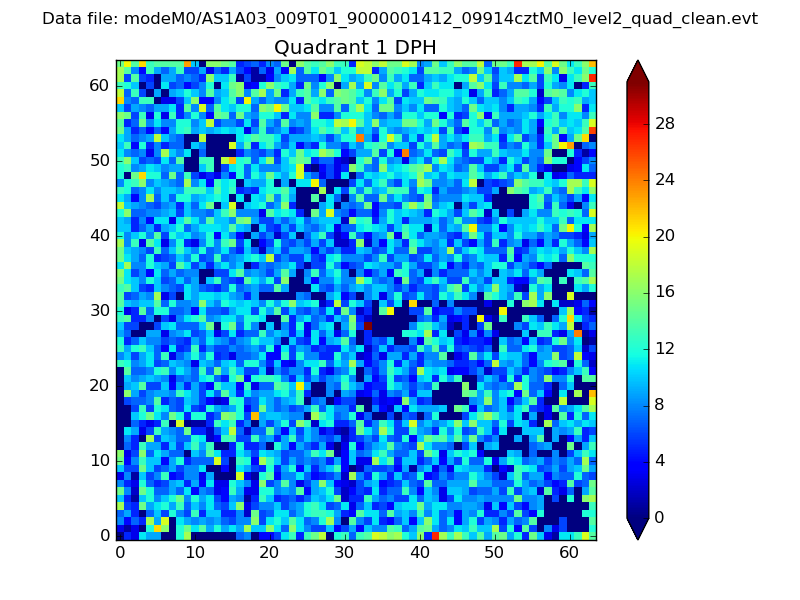 |
Quadrant B |
|---|---|---|---|
| Quadrant D | 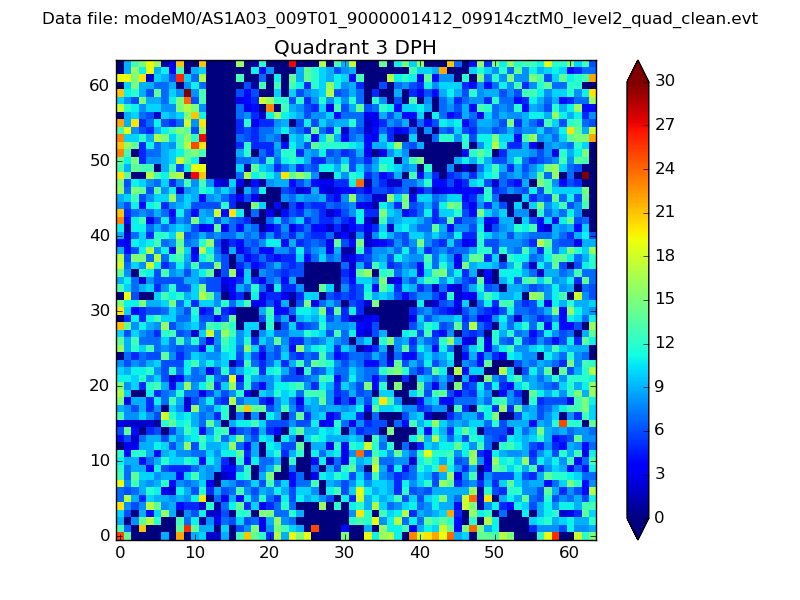 |
 |
Quadrant C |
| Plot type | Count rate plots | Images |
|---|---|---|
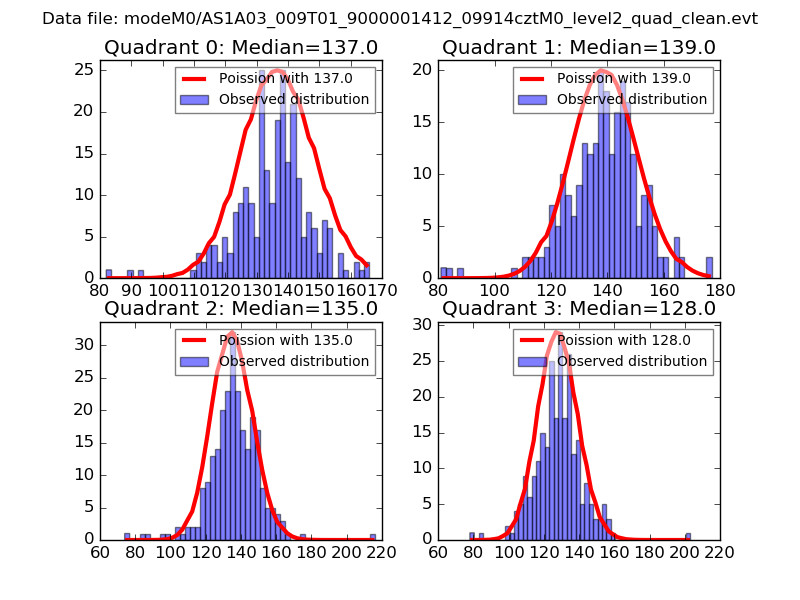
| Comparison with Poisson distribution Blue bars denote a histogram of data divided into 1 sec bins. Red curve is a Poisson curve with rate = median count rate of data. |
 |
 |
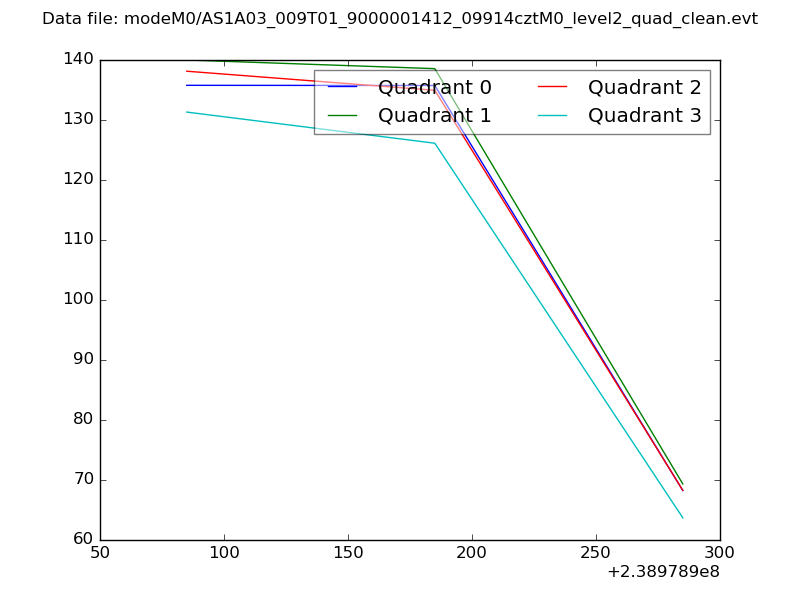
| Quadrant-wise count rates Data is divided into 100 sec bins |
 |
|
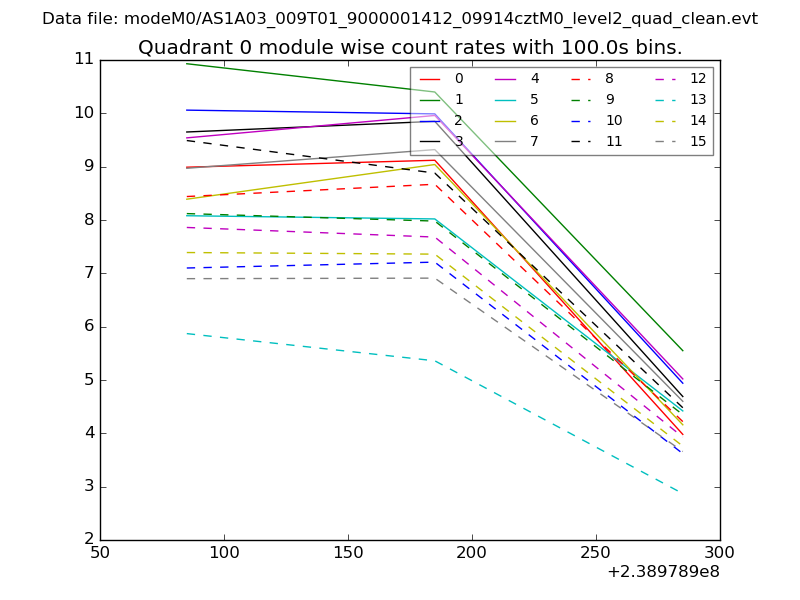
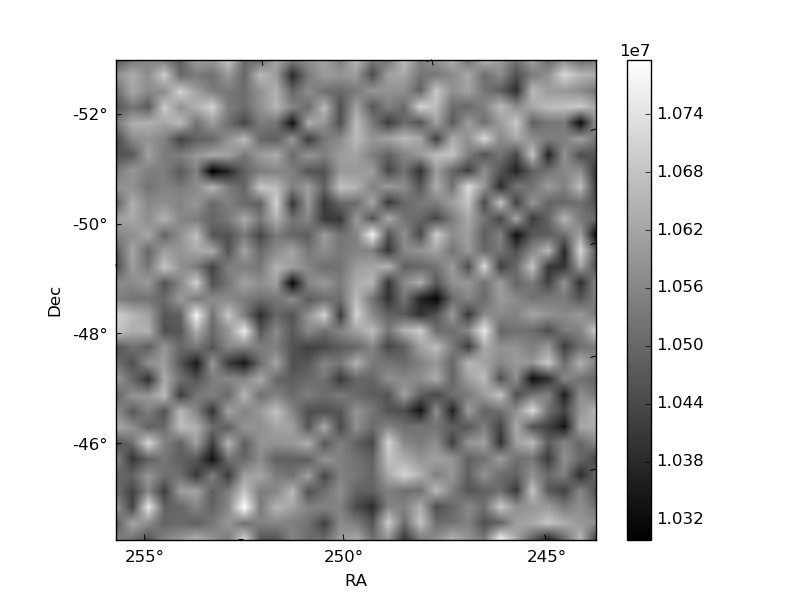
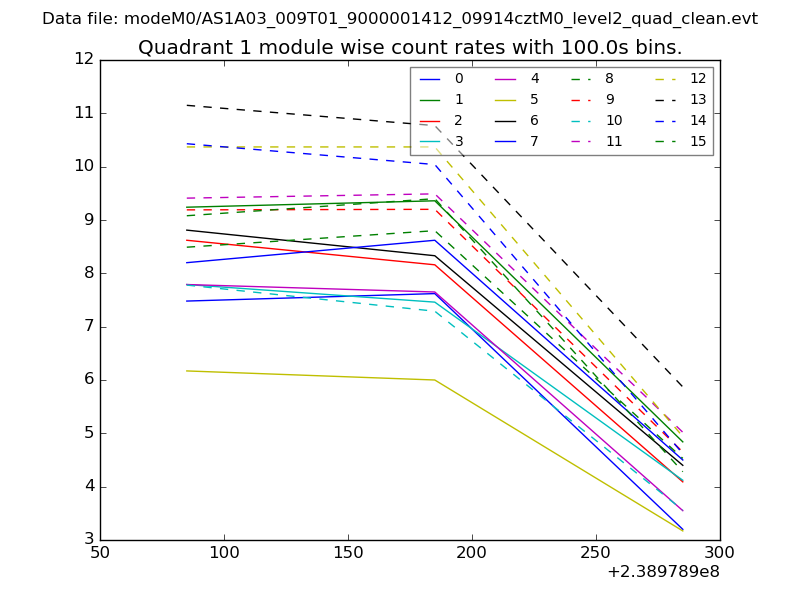
| Module-wise count rates for Quadrant A Data is divided into 100 sec bins |
 |
 |
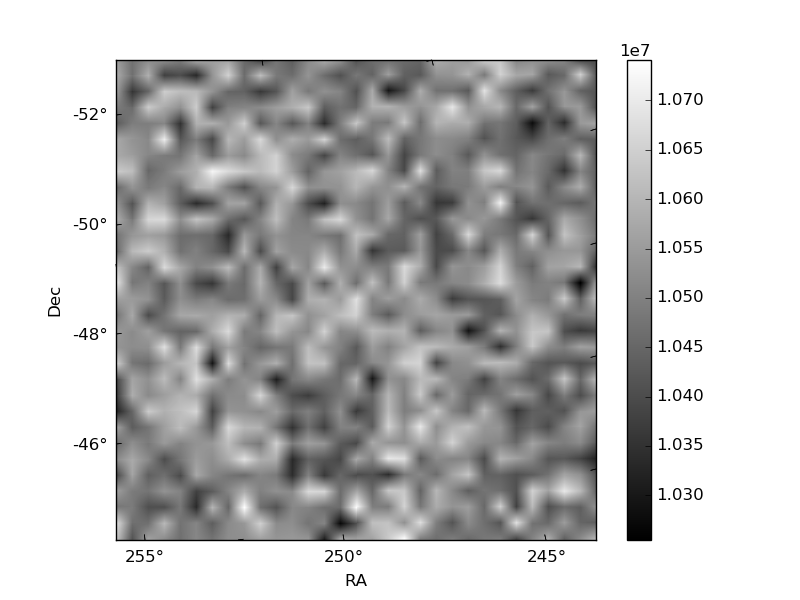
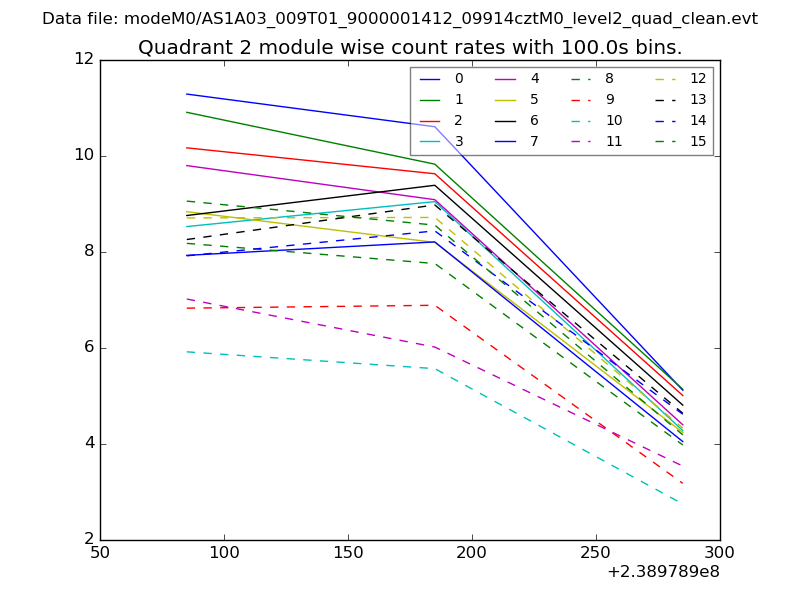
| Module-wise count rates for Quadrant B Data is divided into 100 sec bins |
 |
 |
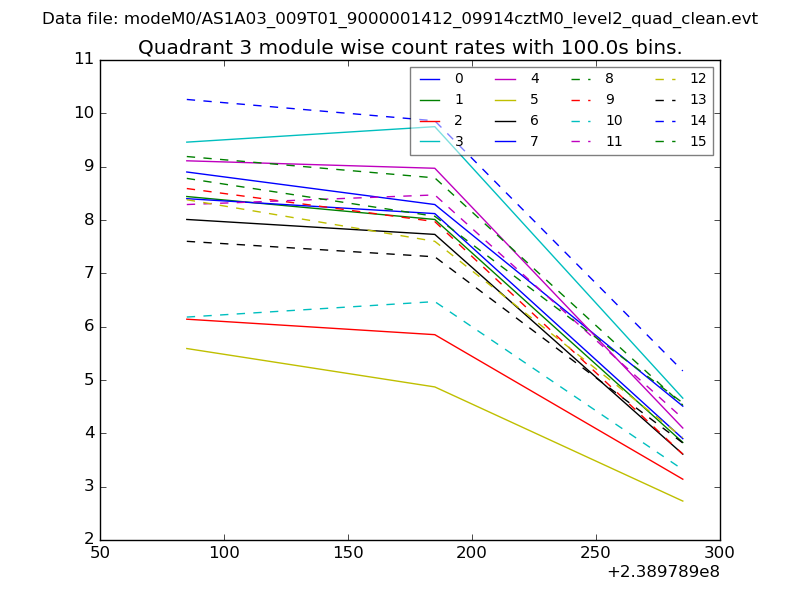
| Module-wise count rates for Quadrant C Data is divided into 100 sec bins |
 |
 |
| Module-wise count rates for Quadrant D Data is divided into 100 sec bins |
 |
 |
| Parameter | Plot |
|---|---|
| CZT HV Monitor | 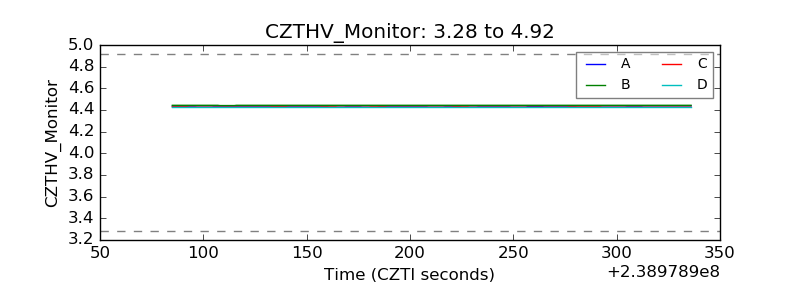 |
| D_VDD |  |
| Temperature 1 | 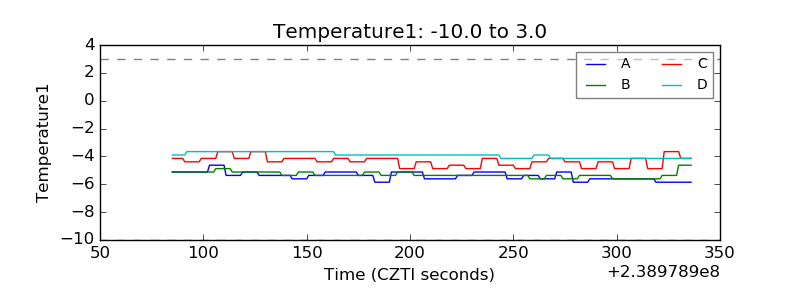 |
| Veto HV Monitor | 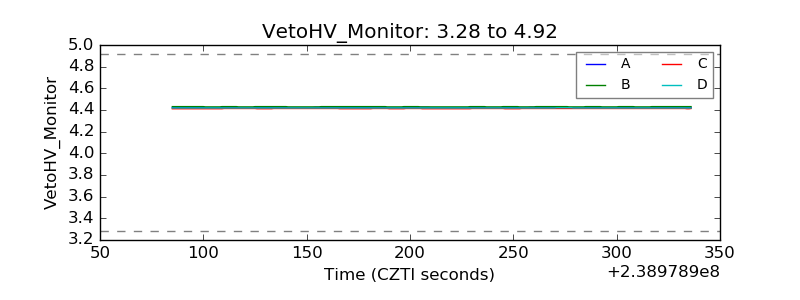 |
| Veto LLD | 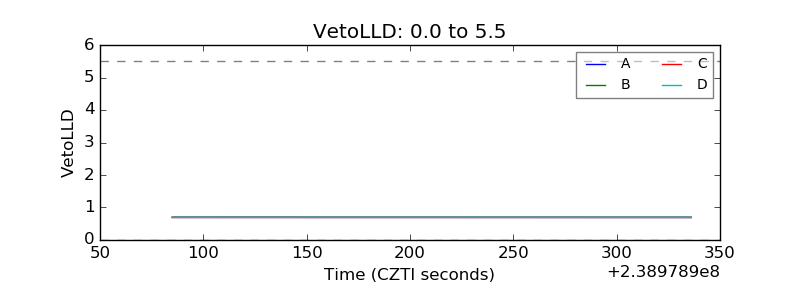 |
| Alpha Counter | 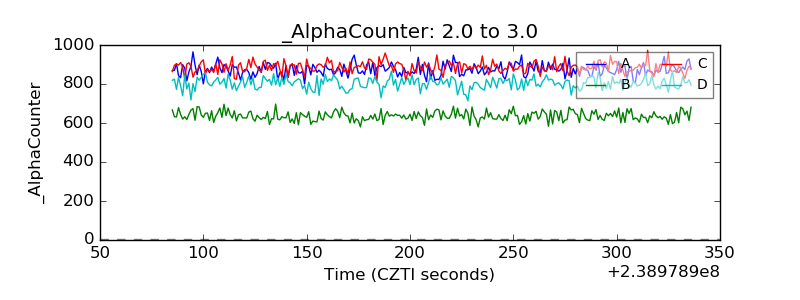 |
| _CPM_Rate | 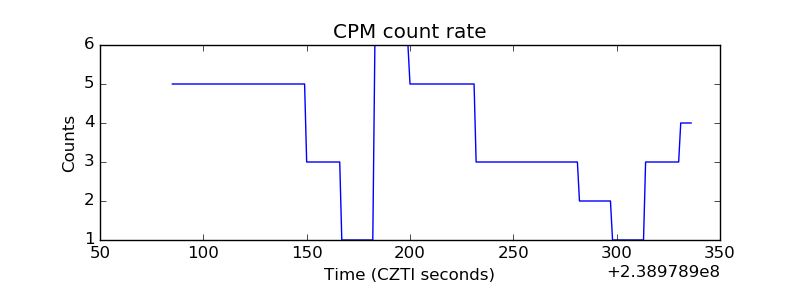 |
| CZT Counter | 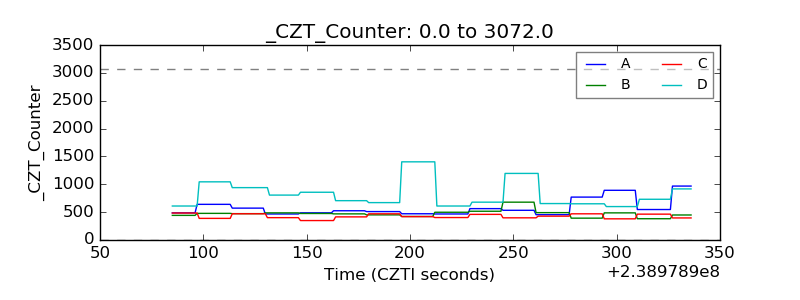 |
| +2.5 Volts monitor | 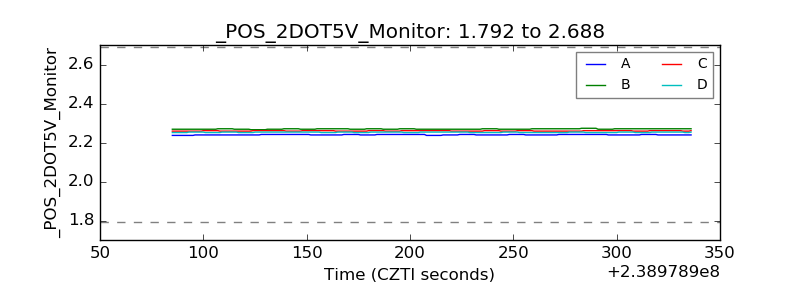 |
| +5 Volts monitor |  |
| _ROLL_ROT | 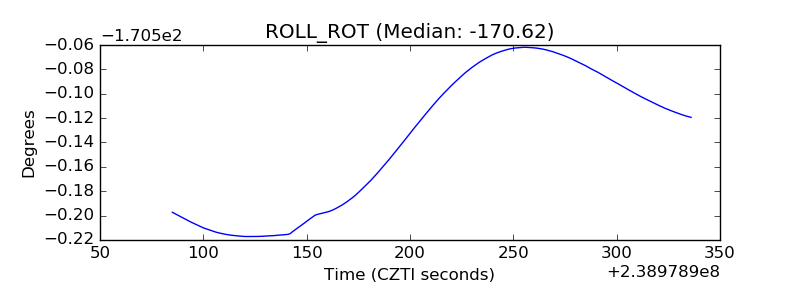 |
| _Roll_DEC | 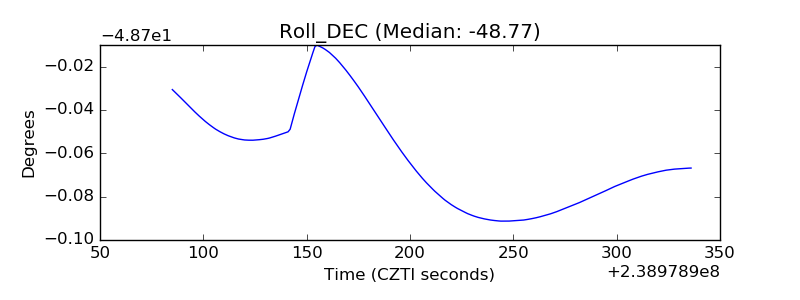 |
| _Roll_RA | 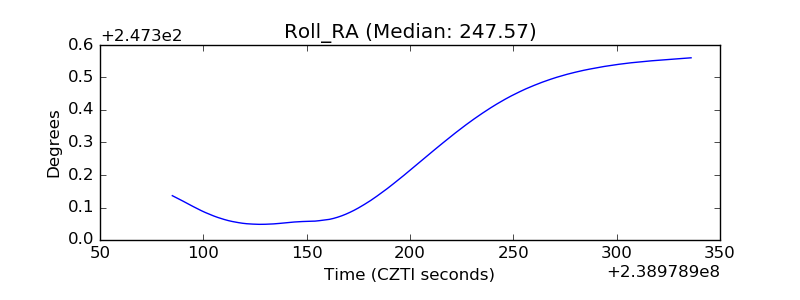 |
| Veto Counter | 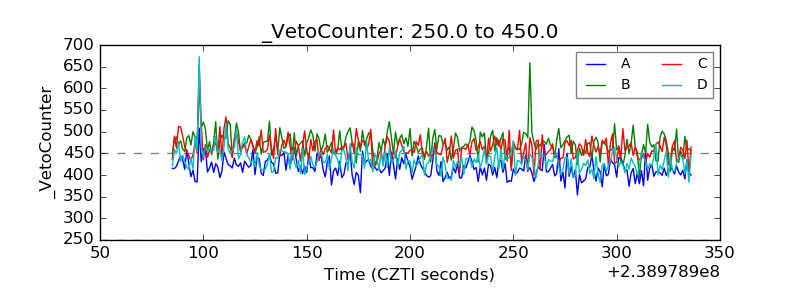 |