| Param | Original file | Final file |
|---|---|---|
| Filename | modeM0/AS1A03_009T01_9000001412_09915cztM0_level2.evt | modeM0/AS1A03_009T01_9000001412_09915cztM0_level2_quad_clean.evt |
| Size (bytes) | 391,184,640 | 63,619,200 |
| Size | 373.1 MB | 60.7 MB |
| Events in quadrant A | 2,739,662 | 391,079 |
| Events in quadrant B | 2,600,908 | 404,065 |
| Events in quadrant C | 2,389,595 | 399,843 |
| Events in quadrant D | 3,766,544 | 370,254 |
| Mode SS | |||
|---|---|---|---|
| Quadrant | BADHDUFLAG | Total packets | Discarded packets |
| A | 0 | 106 | 0 |
| B | 0 | 106 | 0 |
| C | 0 | 106 | 0 |
| D | 0 | 106 | 2 |
| Mode M0 | |||
|---|---|---|---|
| Quadrant | BADHDUFLAG | Total packets | Discarded packets |
| A | 0 | 11610 | 40 |
| B | 0 | 11152 | 27 |
| C | 0 | 10596 | 24 |
| D | 0 | 14771 | 58 |
| Mode M9 | |||
|---|---|---|---|
| Quadrant | BADHDUFLAG | Total packets | Discarded packets |
| A | 0 | 14 | 0 |
| B | 0 | 14 | 0 |
| C | 0 | 14 | 0 |
| D | 0 | 14 | 0 |
| Quadrant | Total seconds | Saturated seconds | Saturation percentage |
|---|---|---|---|
| A | 5149 | 57 | 1.107011% |
| B | 5153 | 68 | 1.319620% |
| C | 5154 | 15 | 0.291036% |
| D | 5148 | 115 | 2.233877% |
Noise dominated data is calculated using 1-second bins in cleaned event files. If a bin has >2000 counts, and if more than 50% of those come from <1% of pixels, then it is considered to be noise-dominated and hence unusable.
| Quadrant | # 1 sec bins | Bins with >0 counts | Bins with >2000 counts | High rate bins dominated by noise | Noise dominated (total time) | Noise dominated (detector-on time) | Marked lightcurve |
|---|---|---|---|---|---|---|---|
| A | 6519 | 5158 | 29 | 29 | 0.44% | 0.56% | 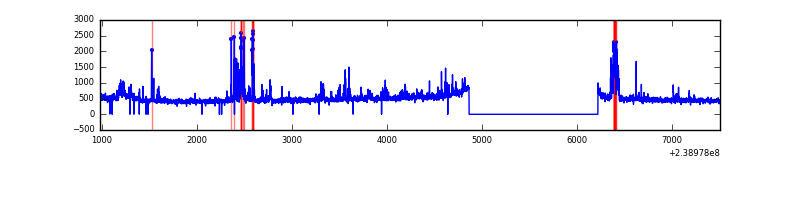 |
| B | 6520 | 5160 | 4 | 4 | 0.06% | 0.08% | 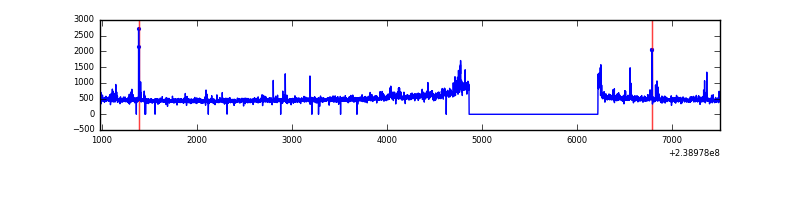 |
| C | 6520 | 5159 | 0 | 0 | 0.00% | 0.00% | 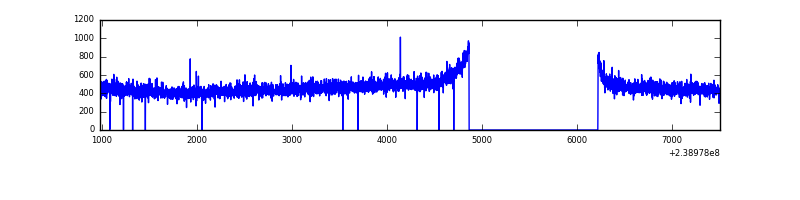 |
| D | 6520 | 5161 | 90 | 90 | 1.38% | 1.74% | 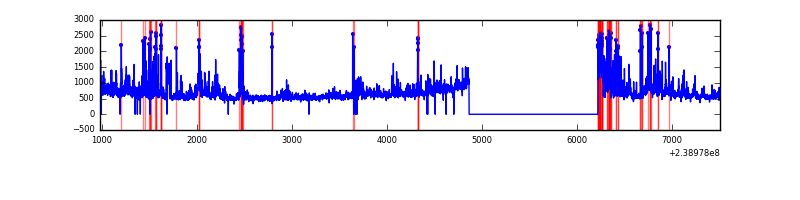 |
Top three noisy pixels from each quadrant. If the there are fewer than three noisy pixels in the level2.evt file, extra rows are filled as -1
| Pixel properties | Quadrant properties | ||||||
|---|---|---|---|---|---|---|---|
| Quadrant | DetID | PixID | Counts | Sigma | Mean | Median | Sigma |
| A | 15 | 239 | 197649 | 1569.59 | 617 | 603 | 125.5 |
| A | 14 | 254 | 153156 | 1215.17 | 617 | 603 | 125.5 |
| A | 15 | 174 | 7201 | 52.56 | 617 | 603 | 125.5 |
| B | 0 | 214 | 49977 | 415.55 | 629 | 613 | 118.8 |
| B | 4 | 239 | 30237 | 249.38 | 629 | 613 | 118.8 |
| B | 4 | 81 | 23257 | 190.62 | 629 | 613 | 118.8 |
| C | 9 | 221 | 6527 | 41.76 | 610 | 612 | 141.7 |
| C | 13 | 61 | 4573 | 27.96 | 610 | 612 | 141.7 |
| C | 12 | 4 | 3551 | 20.75 | 610 | 612 | 141.7 |
| D | 8 | 195 | 500743 | 3262.34 | 590 | 574 | 153.3 |
| D | 2 | 16 | 317651 | 2068.13 | 590 | 574 | 153.3 |
| D | 2 | 152 | 150978 | 981.01 | 590 | 574 | 153.3 |
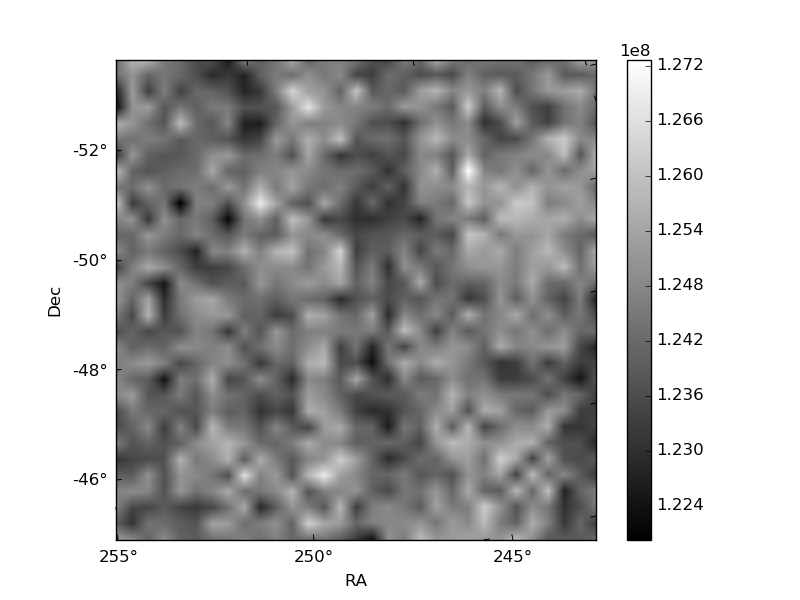
Histogram calculated using DETX and DETY for each event in the final _common_clean file
| Quadrant A |  |
 |
Quadrant B |
|---|---|---|---|
| Quadrant D | 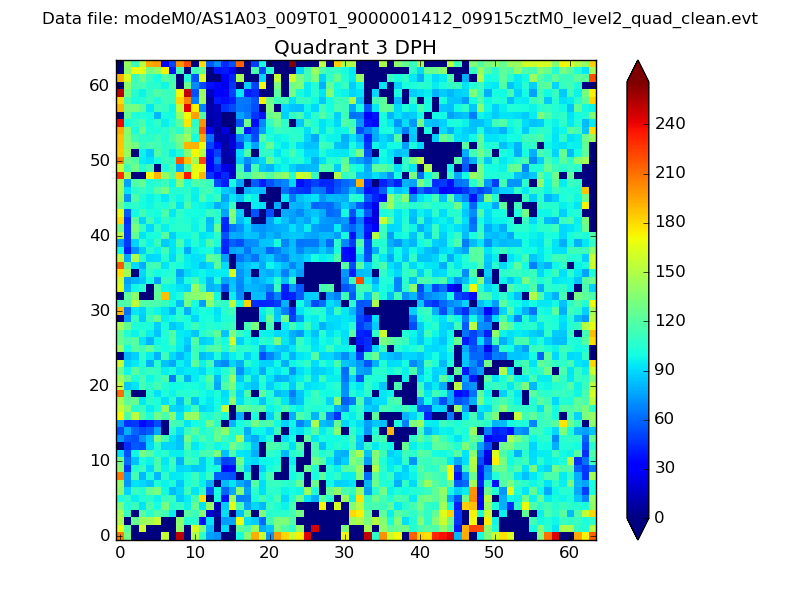 |
 |
Quadrant C |
| Plot type | Count rate plots | Images |
|---|---|---|
| Comparison with Poisson distribution Blue bars denote a histogram of data divided into 1 sec bins. Red curve is a Poisson curve with rate = median count rate of data. |
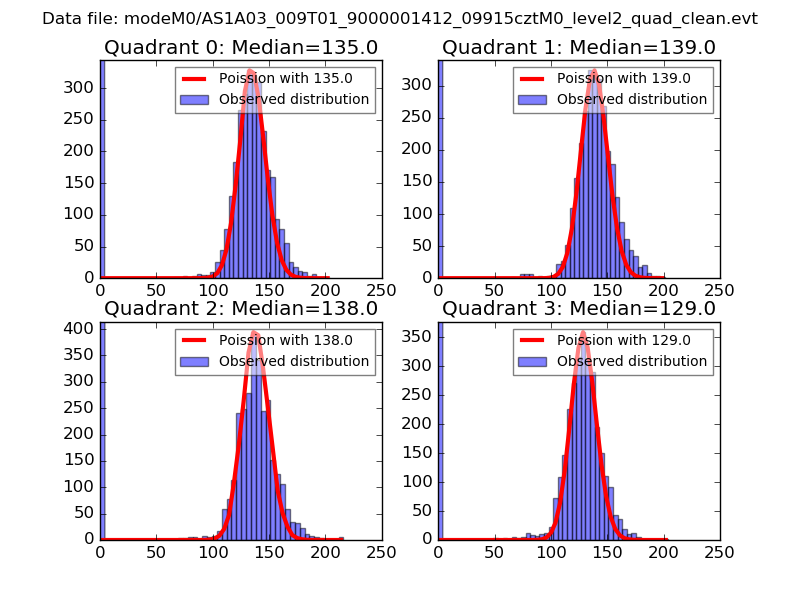 |
 |
| Quadrant-wise count rates Data is divided into 100 sec bins |
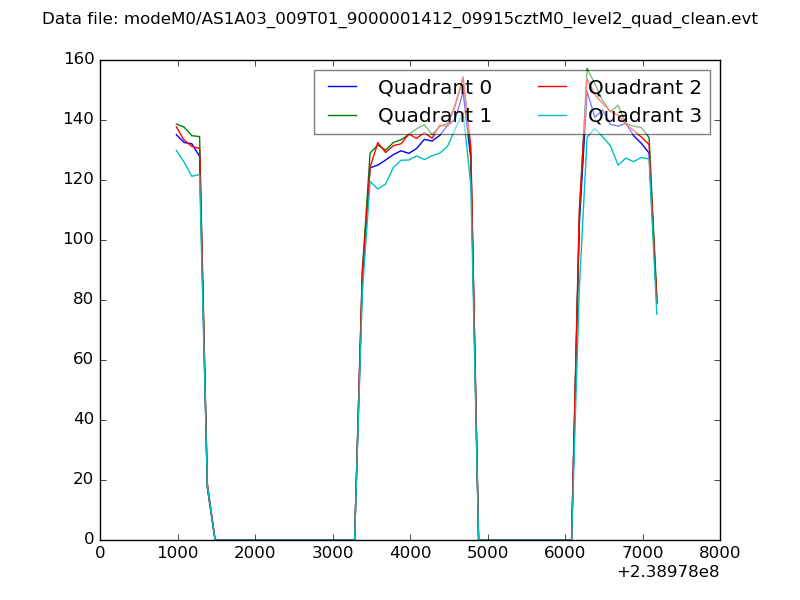 |
|
| Module-wise count rates for Quadrant A Data is divided into 100 sec bins |
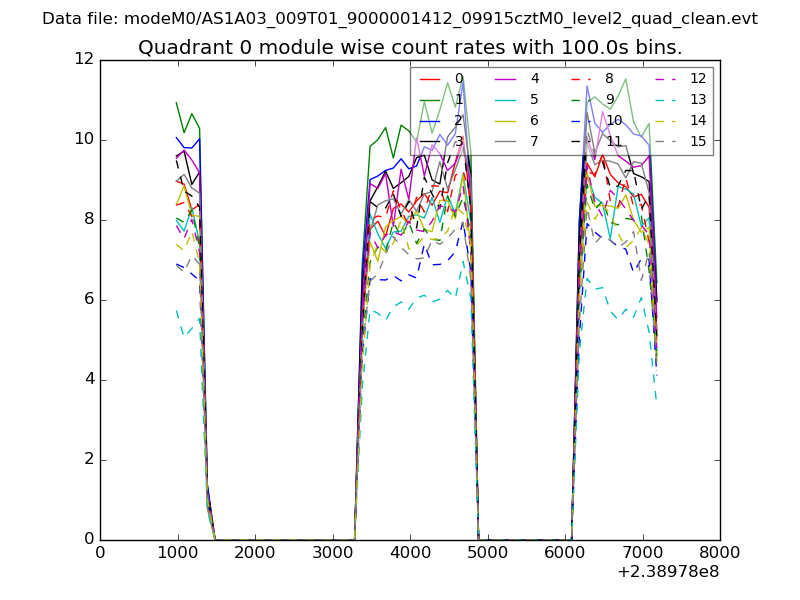 |
 |
| Module-wise count rates for Quadrant B Data is divided into 100 sec bins |
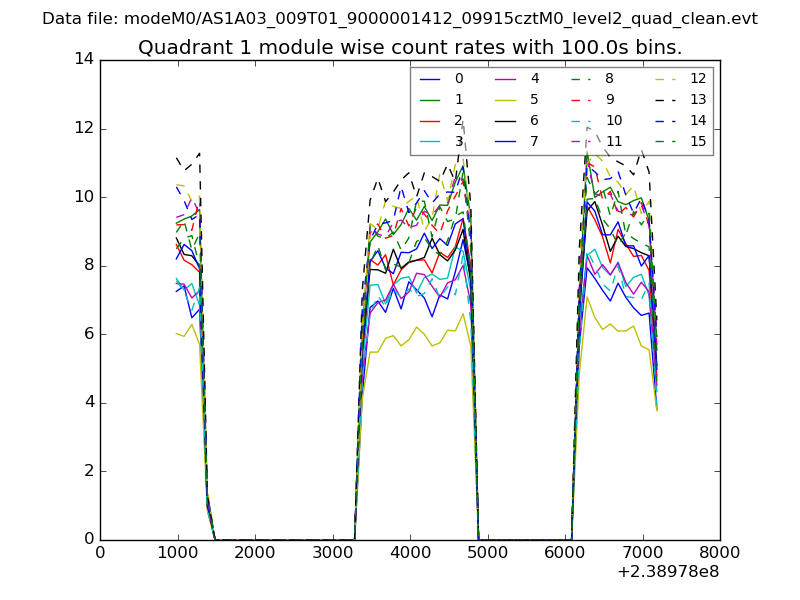 |
 |
| Module-wise count rates for Quadrant C Data is divided into 100 sec bins |
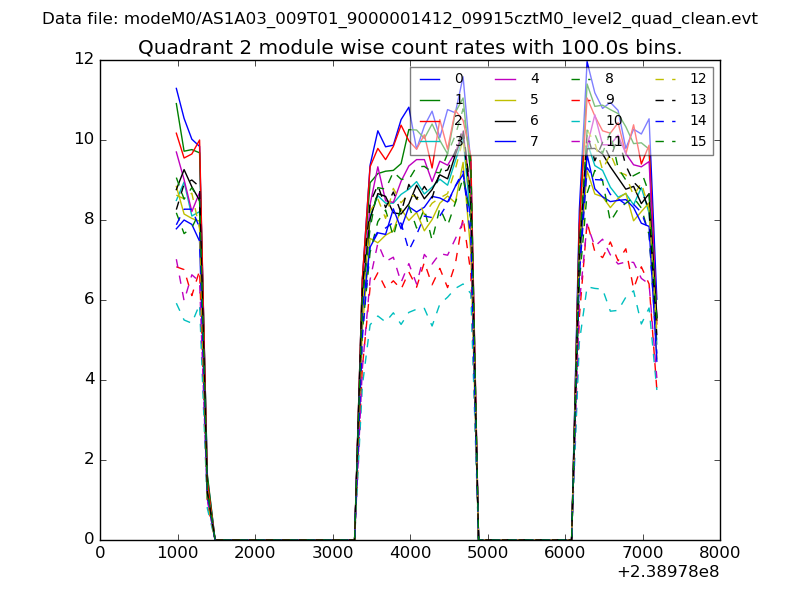 |
 |
| Module-wise count rates for Quadrant D Data is divided into 100 sec bins |
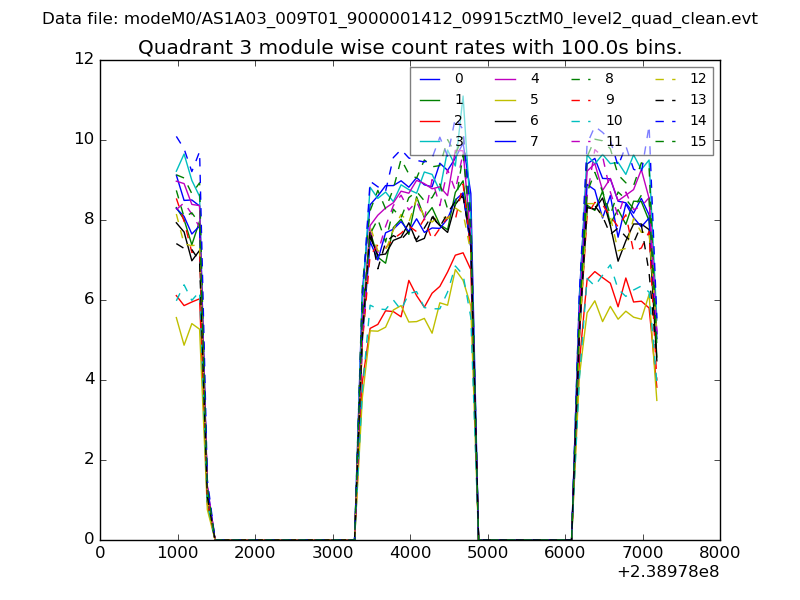 |
 |
| Parameter | Plot |
|---|---|
| CZT HV Monitor | 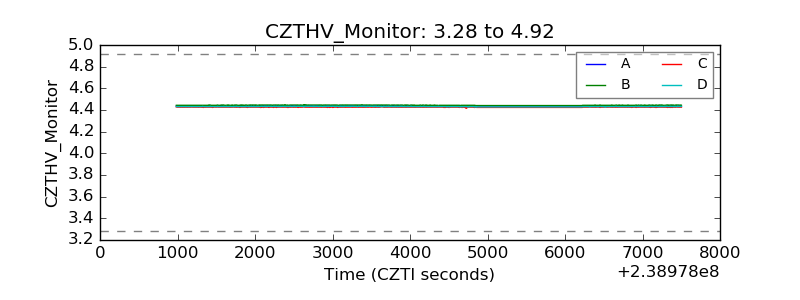 |
| D_VDD | 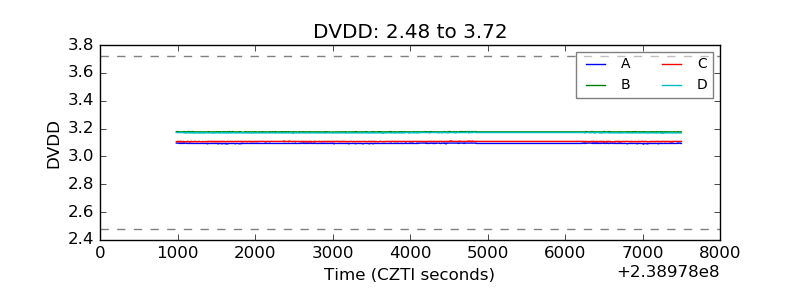 |
| Temperature 1 | 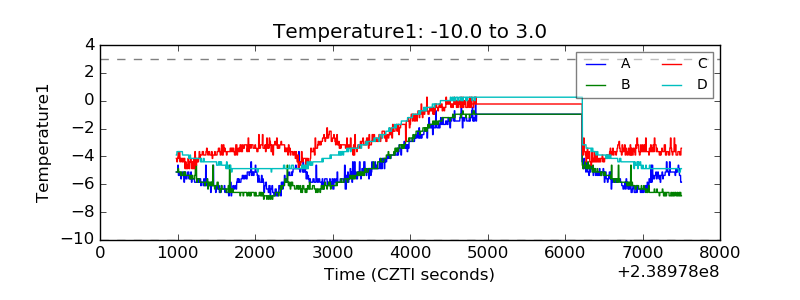 |
| Veto HV Monitor | 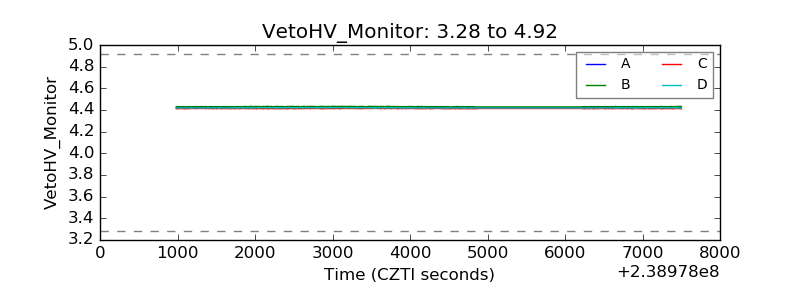 |
| Veto LLD | 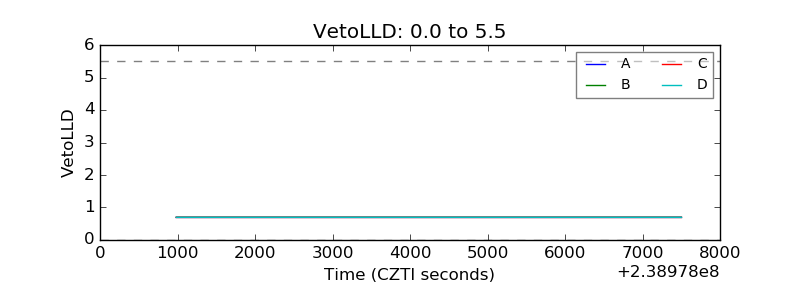 |
| Alpha Counter | 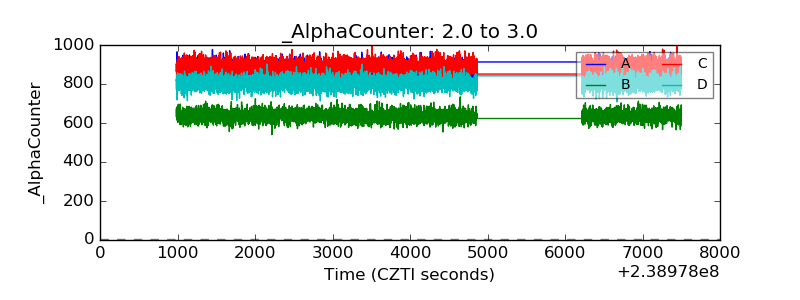 |
| _CPM_Rate | 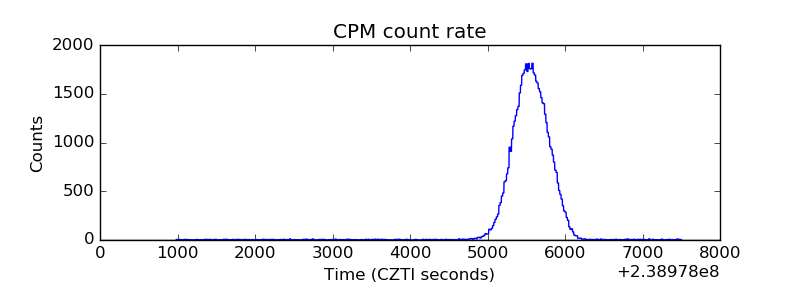 |
| CZT Counter |  |
| +2.5 Volts monitor |  |
| +5 Volts monitor |  |
| _ROLL_ROT | 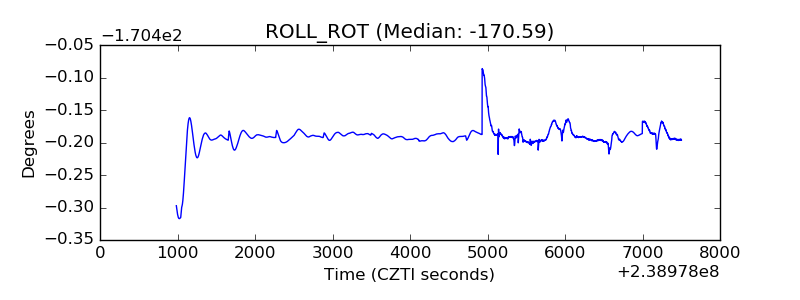 |
| _Roll_DEC | 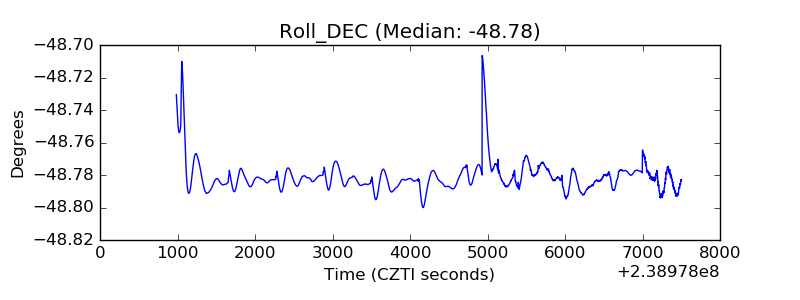 |
| _Roll_RA | 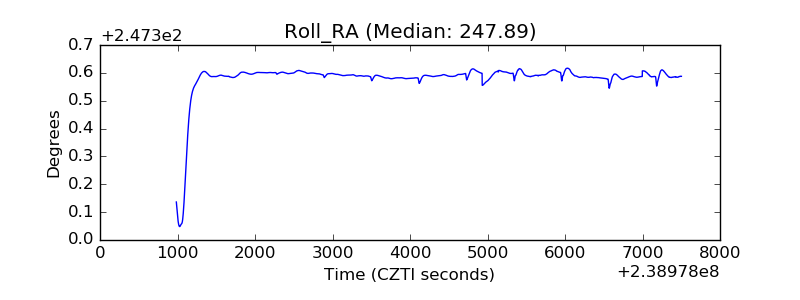 |
| Veto Counter | 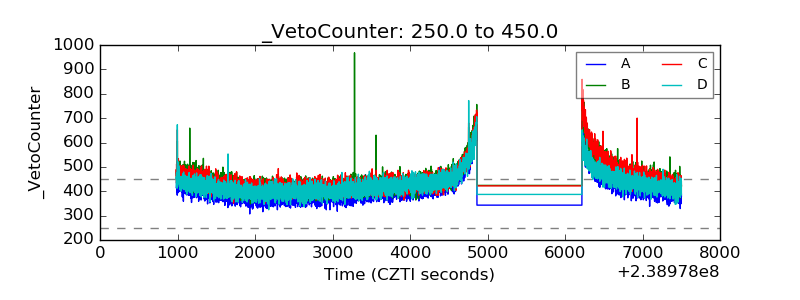 |