| Param | Original file | Final file |
|---|---|---|
| Filename | modeM0/AS1A03_009T01_9000001412_09916cztM0_level2.evt | modeM0/AS1A03_009T01_9000001412_09916cztM0_level2_quad_clean.evt |
| Size (bytes) | 495,028,800 | 81,624,960 |
| Size | 472.1 MB | 77.8 MB |
| Events in quadrant A | 3,234,937 | 501,457 |
| Events in quadrant B | 3,414,709 | 512,854 |
| Events in quadrant C | 3,122,097 | 510,311 |
| Events in quadrant D | 4,761,529 | 476,067 |
| Mode SS | |||
|---|---|---|---|
| Quadrant | BADHDUFLAG | Total packets | Discarded packets |
| A | 0 | 140 | 0 |
| B | 0 | 140 | 0 |
| C | 0 | 140 | 0 |
| D | 0 | 140 | 0 |
| Mode M0 | |||
|---|---|---|---|
| Quadrant | BADHDUFLAG | Total packets | Discarded packets |
| A | 0 | 14199 | 3 |
| B | 0 | 14644 | 2 |
| C | 0 | 13901 | 2 |
| D | 0 | 18546 | 2 |
| Mode M9 | |||
|---|---|---|---|
| Quadrant | BADHDUFLAG | Total packets | Discarded packets |
| A | 0 | 26 | 0 |
| B | 0 | 26 | 0 |
| C | 0 | 26 | 0 |
| D | 0 | 26 | 0 |
| Quadrant | Total seconds | Saturated seconds | Saturation percentage |
|---|---|---|---|
| A | 6754 | 59 | 0.873556% |
| B | 6754 | 90 | 1.332544% |
| C | 6754 | 35 | 0.518211% |
| D | 6754 | 280 | 4.145691% |
Noise dominated data is calculated using 1-second bins in cleaned event files. If a bin has >2000 counts, and if more than 50% of those come from <1% of pixels, then it is considered to be noise-dominated and hence unusable.
| Quadrant | # 1 sec bins | Bins with >0 counts | Bins with >2000 counts | High rate bins dominated by noise | Noise dominated (total time) | Noise dominated (detector-on time) | Marked lightcurve |
|---|---|---|---|---|---|---|---|
| A | 9333 | 6753 | 13 | 13 | 0.14% | 0.19% | 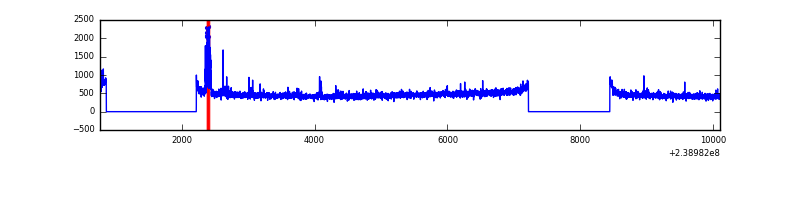 |
| B | 9333 | 6753 | 2 | 2 | 0.02% | 0.03% | 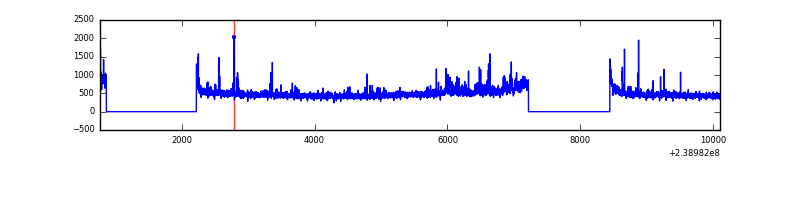 |
| C | 9335 | 6755 | 3 | 3 | 0.03% | 0.04% | 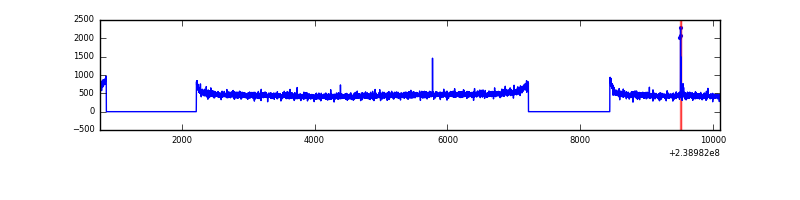 |
| D | 9335 | 6755 | 223 | 223 | 2.39% | 3.30% | 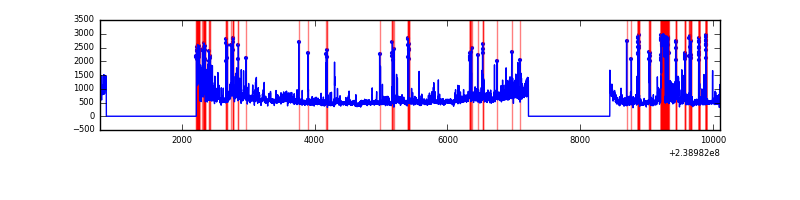 |
Top three noisy pixels from each quadrant. If the there are fewer than three noisy pixels in the level2.evt file, extra rows are filled as -1
| Pixel properties | Quadrant properties | ||||||
|---|---|---|---|---|---|---|---|
| Quadrant | DetID | PixID | Counts | Sigma | Mean | Median | Sigma |
| A | 14 | 254 | 109892 | 670.46 | 807 | 791 | 162.7 |
| A | 15 | 174 | 9091 | 51.01 | 807 | 791 | 162.7 |
| A | 0 | 226 | 7543 | 41.49 | 807 | 791 | 162.7 |
| B | 0 | 214 | 69468 | 439.5 | 820 | 800 | 156.2 |
| B | 4 | 81 | 34001 | 212.5 | 820 | 800 | 156.2 |
| B | 4 | 239 | 25351 | 157.14 | 820 | 800 | 156.2 |
| C | 9 | 221 | 17553 | 91.78 | 794 | 799 | 182.5 |
| C | 13 | 61 | 6039 | 28.71 | 794 | 799 | 182.5 |
| C | 14 | 67 | 3568 | 15.17 | 794 | 799 | 182.5 |
| D | 8 | 195 | 482225 | 2441.93 | 766 | 744 | 197.2 |
| D | 10 | 253 | 375198 | 1899.12 | 766 | 744 | 197.2 |
| D | 2 | 152 | 181338 | 915.92 | 766 | 744 | 197.2 |
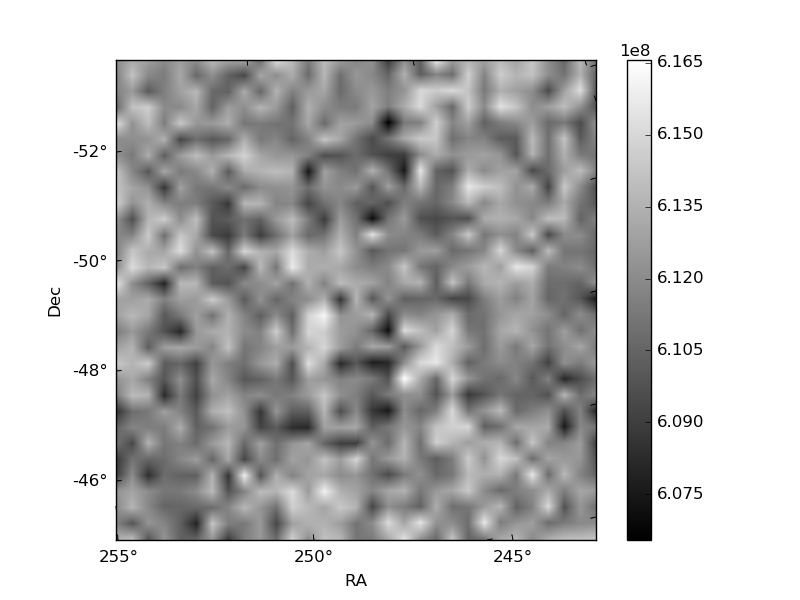
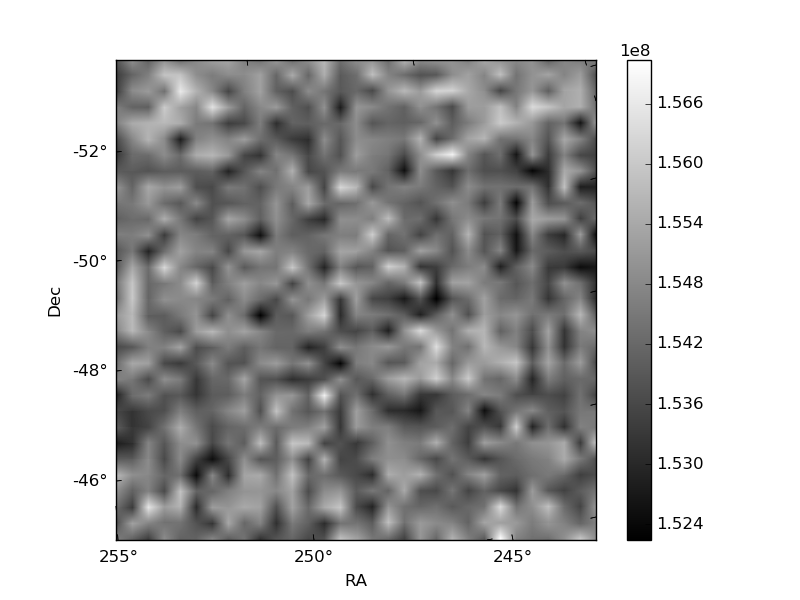
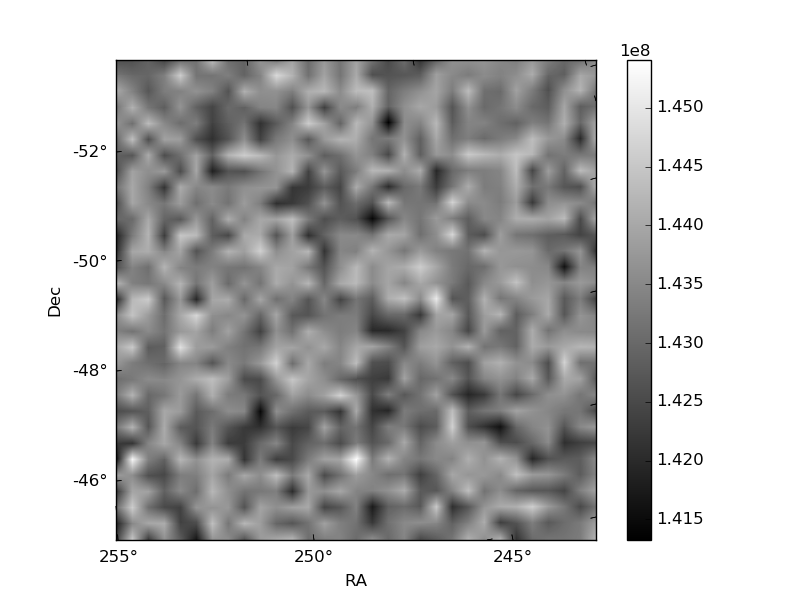
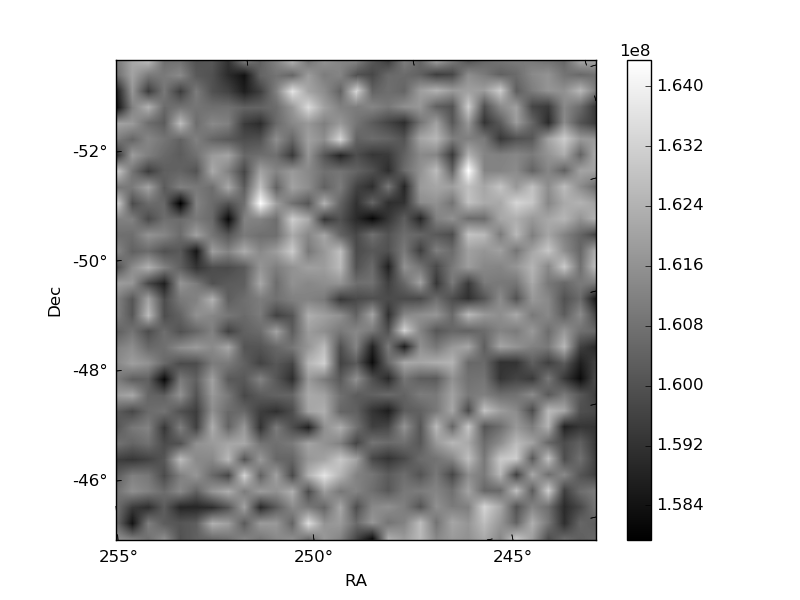
Histogram calculated using DETX and DETY for each event in the final _common_clean file
| Quadrant A | 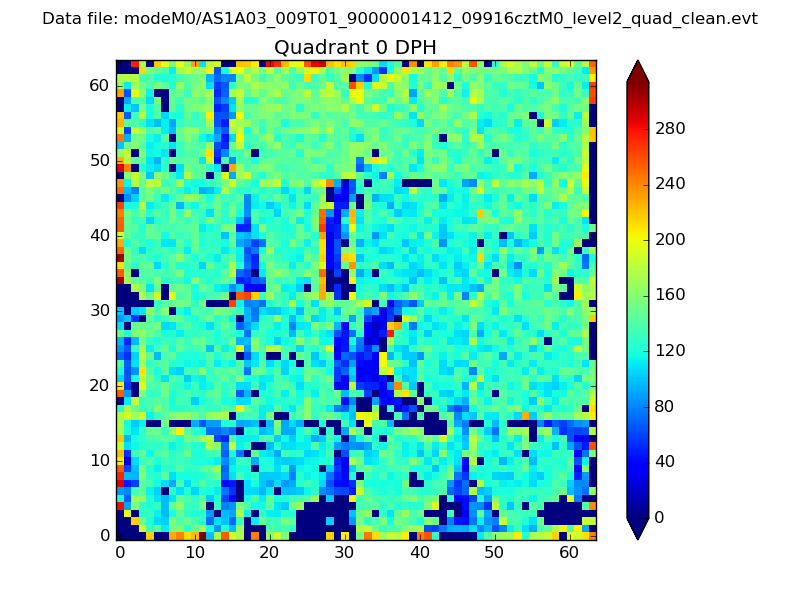 |
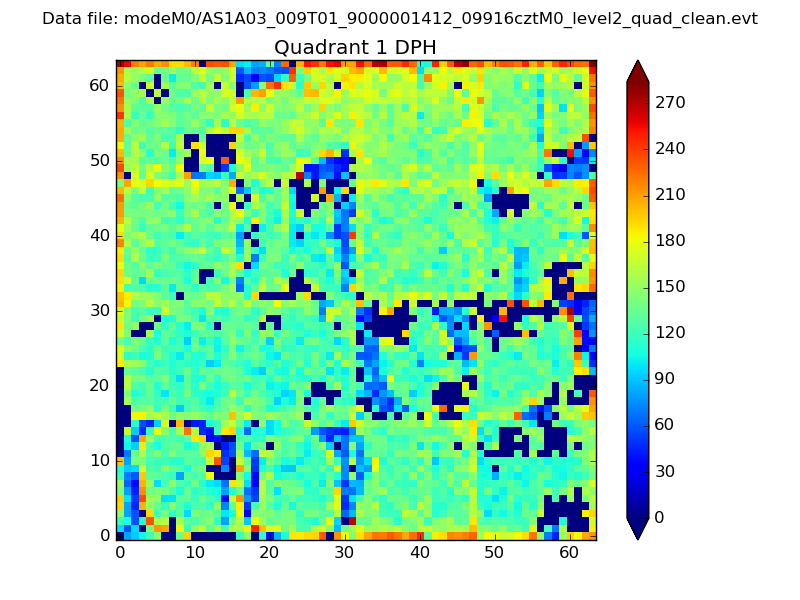 |
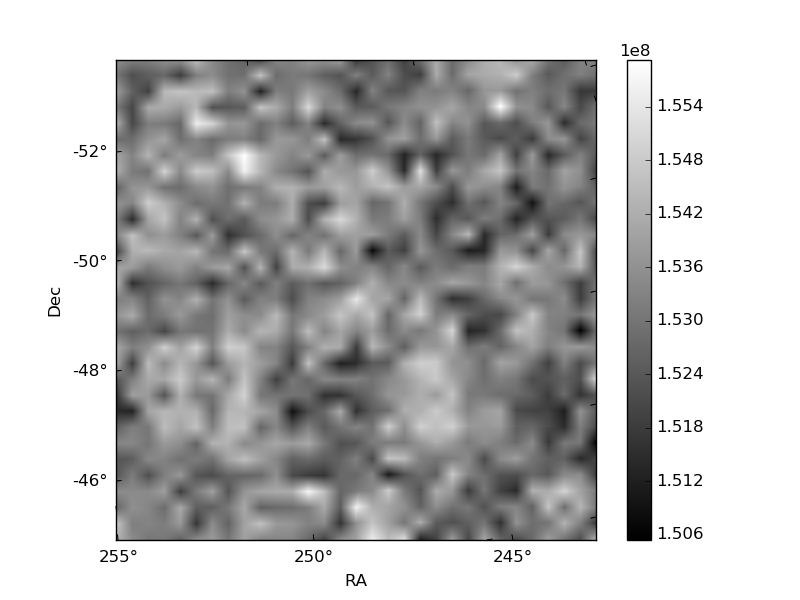
Quadrant B |
|---|---|---|---|
| Quadrant D | 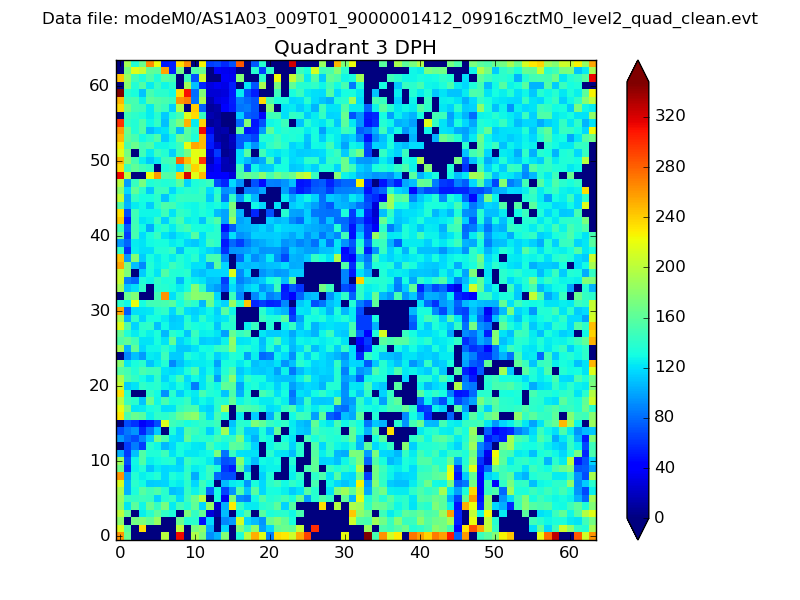 |
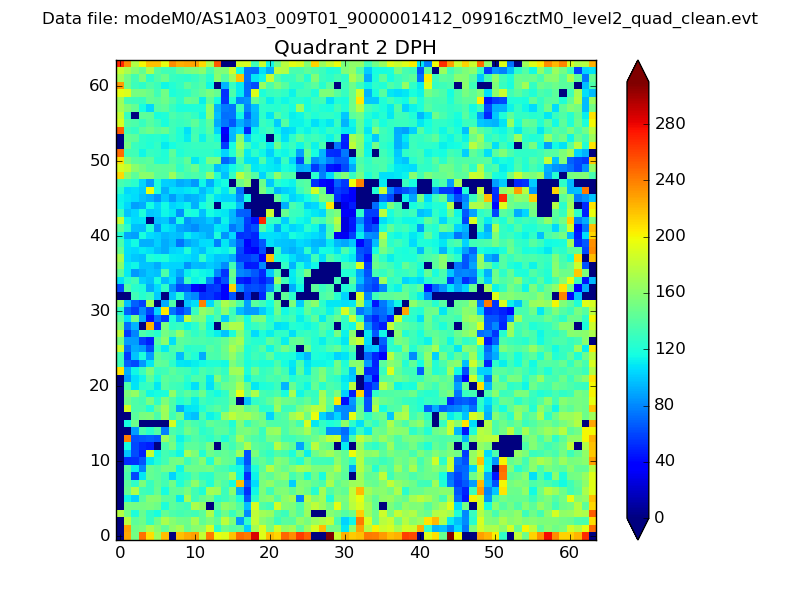 |
Quadrant C |
| Plot type | Count rate plots | Images |
|---|---|---|
| Comparison with Poisson distribution Blue bars denote a histogram of data divided into 1 sec bins. Red curve is a Poisson curve with rate = median count rate of data. |
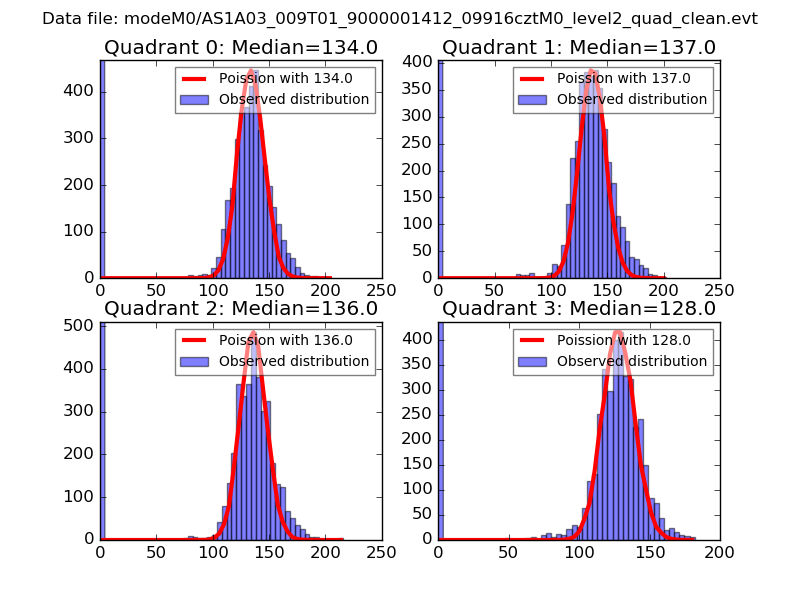 |
 |
| Quadrant-wise count rates Data is divided into 100 sec bins |
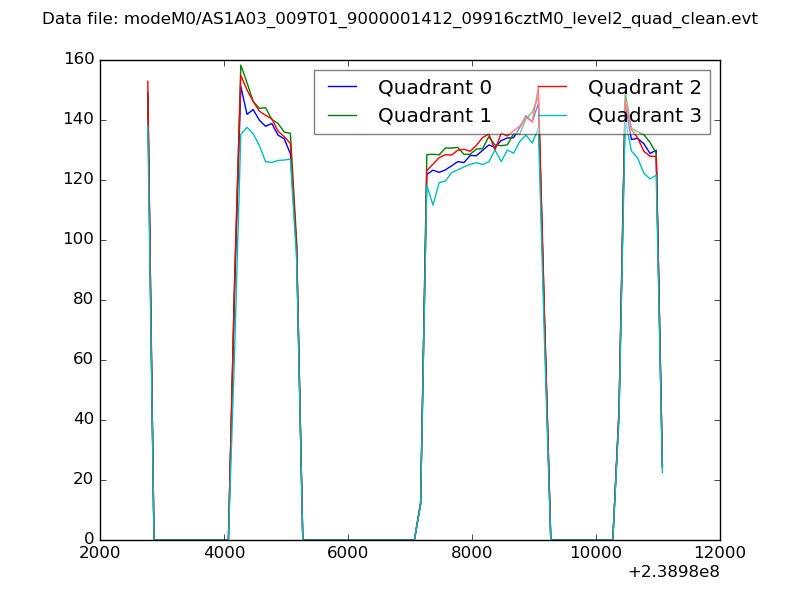 |
|
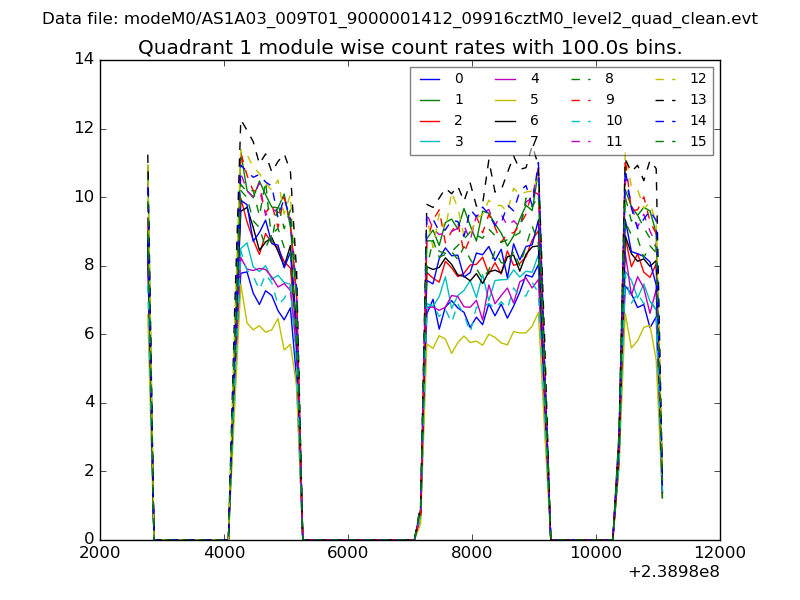
| Module-wise count rates for Quadrant A Data is divided into 100 sec bins |
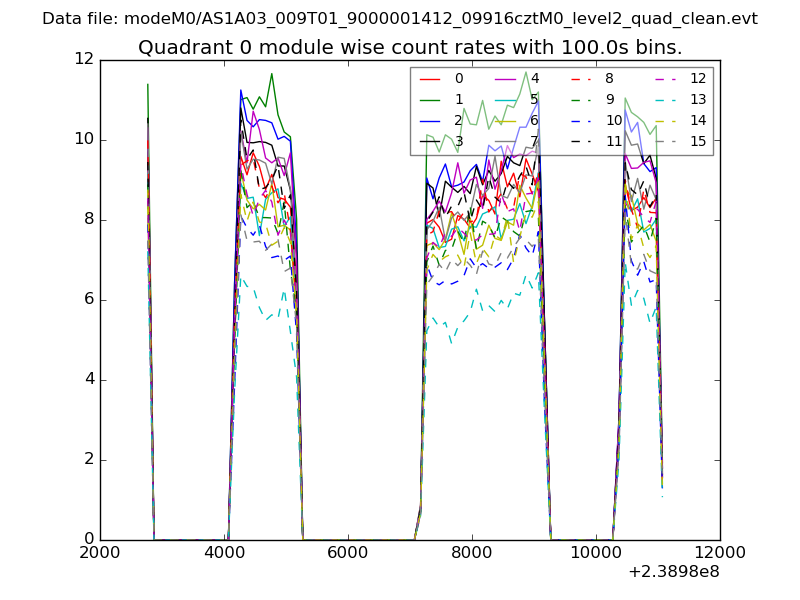 |
 |
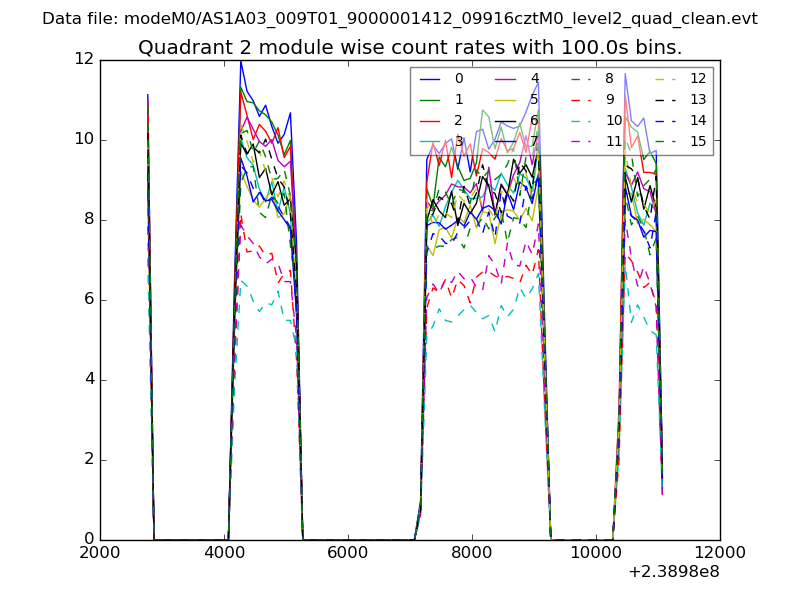
| Module-wise count rates for Quadrant B Data is divided into 100 sec bins |
 |
 |
| Module-wise count rates for Quadrant C Data is divided into 100 sec bins |
 |
 |
| Module-wise count rates for Quadrant D Data is divided into 100 sec bins |
 |
 |
| Parameter | Plot |
|---|---|
| CZT HV Monitor | 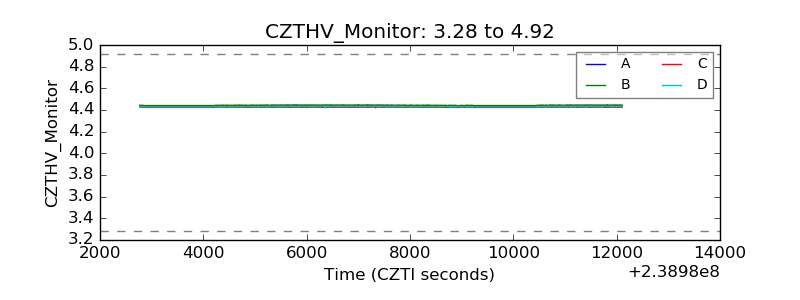 |
| D_VDD | 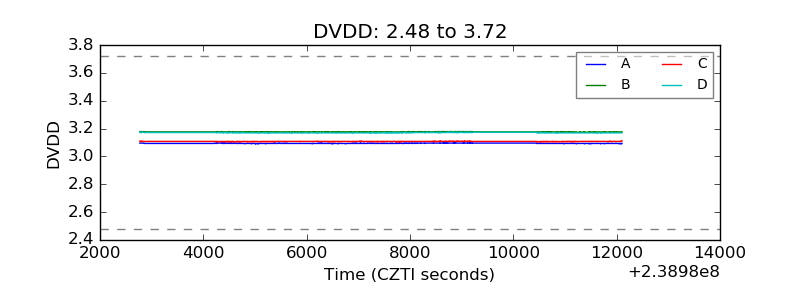 |
| Temperature 1 | 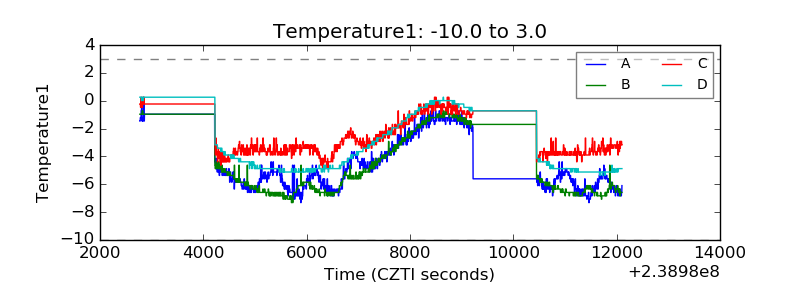 |
| Veto HV Monitor | 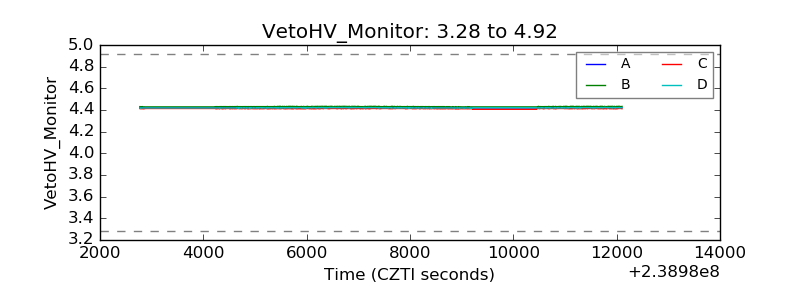 |
| Veto LLD | 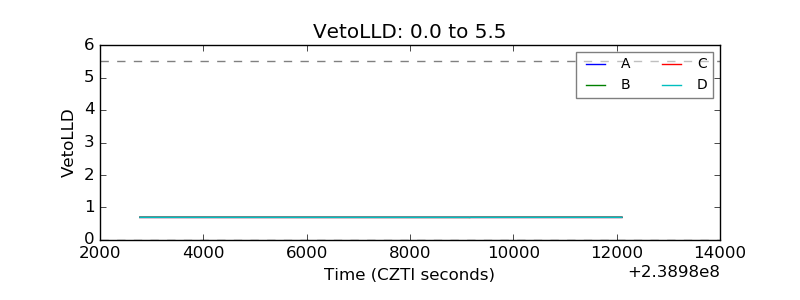 |
| Alpha Counter | 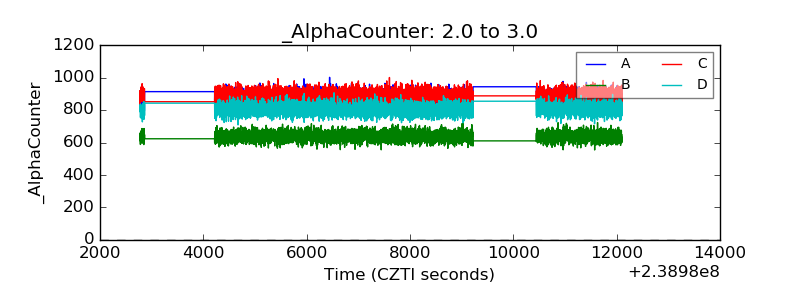 |
| _CPM_Rate | 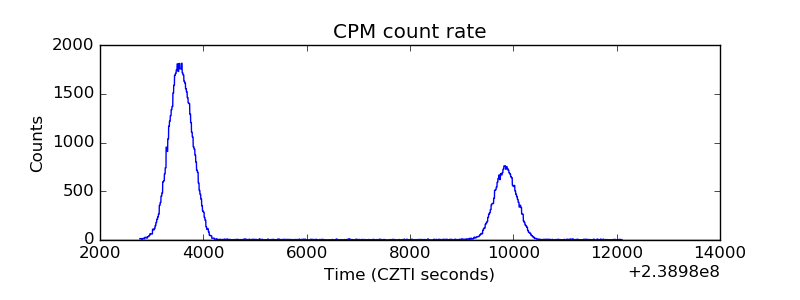 |
| CZT Counter | 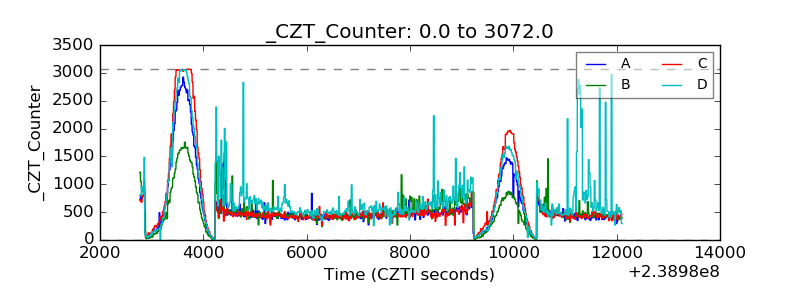 |
| +2.5 Volts monitor |  |
| +5 Volts monitor |  |
| _ROLL_ROT | 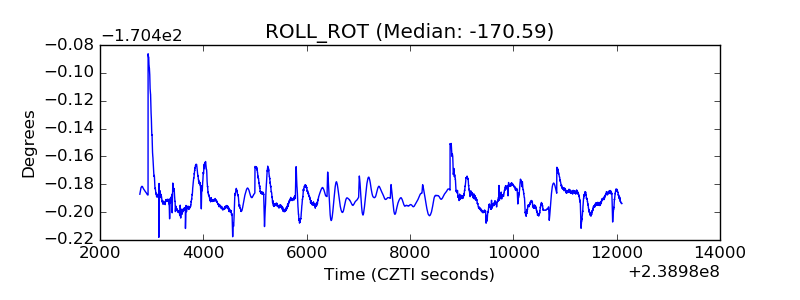 |
| _Roll_DEC | 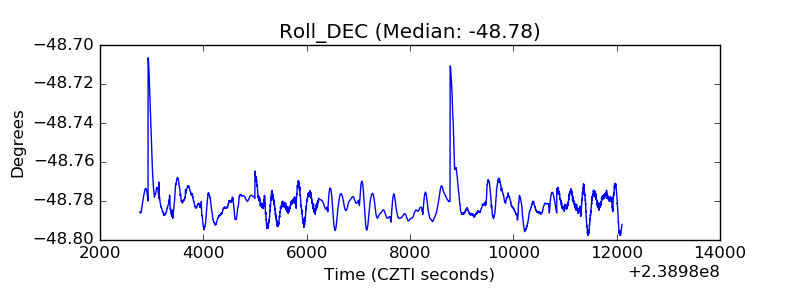 |
| _Roll_RA | 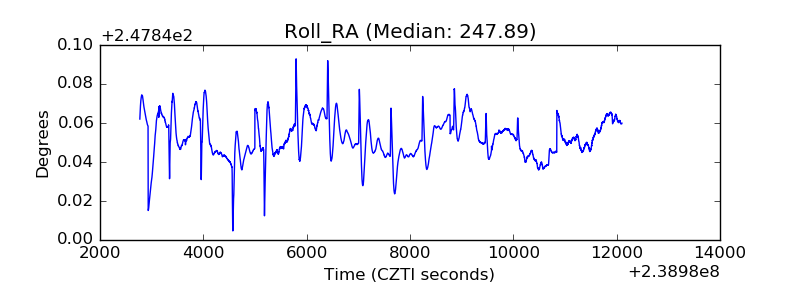 |
| Veto Counter |  |