| Param | Original file | Final file |
|---|---|---|
| Filename | modeM0/AS1A03_009T01_9000001412_09919cztM0_level2.evt | modeM0/AS1A03_009T01_9000001412_09919cztM0_level2_quad_clean.evt |
| Size (bytes) | 477,771,840 | 64,699,200 |
| Size | 455.6 MB | 61.7 MB |
| Events in quadrant A | 2,947,095 | 394,419 |
| Events in quadrant B | 3,040,182 | 393,955 |
| Events in quadrant C | 2,935,233 | 399,804 |
| Events in quadrant D | 5,126,370 | 339,819 |
| Mode SS | |||
|---|---|---|---|
| Quadrant | BADHDUFLAG | Total packets | Discarded packets |
| A | 0 | 164 | 28 |
| B | 0 | 164 | 42 |
| C | 0 | 164 | 34 |
| D | 0 | 164 | 32 |
| Mode M0 | |||
|---|---|---|---|
| Quadrant | BADHDUFLAG | Total packets | Discarded packets |
| A | 0 | 17075 | 3858 |
| B | 0 | 17256 | 4030 |
| C | 0 | 17037 | 3799 |
| D | 0 | 27327 | 8067 |
| Mode M9 | |||
|---|---|---|---|
| Quadrant | BADHDUFLAG | Total packets | Discarded packets |
| A | 0 | 4 | 1 |
| B | 0 | 4 | 0 |
| C | 0 | 4 | 1 |
| D | 0 | 4 | 0 |
| Quadrant | Total seconds | Saturated seconds | Saturation percentage |
|---|---|---|---|
| A | 6270 | 273 | 4.354067% |
| B | 6223 | 292 | 4.692271% |
| C | 6299 | 256 | 4.064137% |
| D | 5751 | 619 | 10.763346% |
Noise dominated data is calculated using 1-second bins in cleaned event files. If a bin has >2000 counts, and if more than 50% of those come from <1% of pixels, then it is considered to be noise-dominated and hence unusable.
| Quadrant | # 1 sec bins | Bins with >0 counts | Bins with >2000 counts | High rate bins dominated by noise | Noise dominated (total time) | Noise dominated (detector-on time) | Marked lightcurve |
|---|---|---|---|---|---|---|---|
| A | 8518 | 7143 | 1 | 1 | 0.01% | 0.01% | 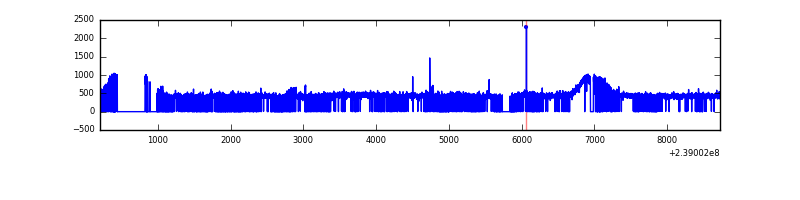 |
| B | 8518 | 7119 | 2 | 2 | 0.02% | 0.03% | 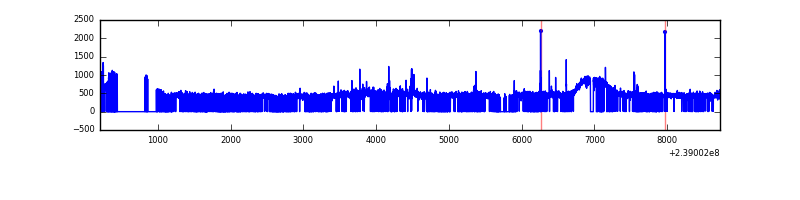 |
| C | 8518 | 7187 | 0 | 0 | 0.00% | 0.00% | 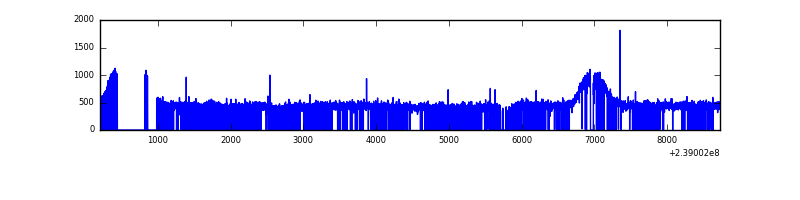 |
| D | 8518 | 6799 | 361 | 361 | 4.24% | 5.31% | 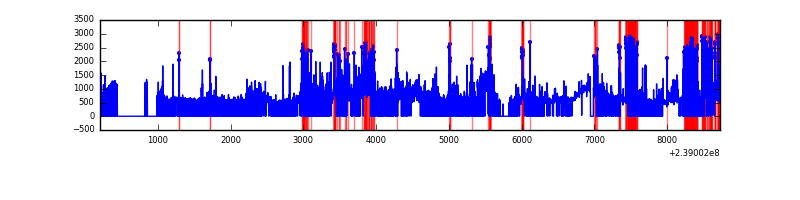 |
Top three noisy pixels from each quadrant. If the there are fewer than three noisy pixels in the level2.evt file, extra rows are filled as -1
| Pixel properties | Quadrant properties | ||||||
|---|---|---|---|---|---|---|---|
| Quadrant | DetID | PixID | Counts | Sigma | Mean | Median | Sigma |
| A | 14 | 111 | 30940 | 194.72 | 754 | 737 | 155.1 |
| A | 13 | 253 | 7800 | 45.53 | 754 | 737 | 155.1 |
| A | 0 | 226 | 6892 | 39.68 | 754 | 737 | 155.1 |
| B | 0 | 214 | 33694 | 223.67 | 753 | 733 | 147.4 |
| B | 4 | 239 | 18837 | 122.85 | 753 | 733 | 147.4 |
| B | 4 | 81 | 16627 | 107.86 | 753 | 733 | 147.4 |
| C | 8 | 128 | 7014 | 35.79 | 747 | 748 | 175.1 |
| C | 13 | 61 | 5499 | 27.13 | 747 | 748 | 175.1 |
| C | 12 | 4 | 5161 | 25.2 | 747 | 748 | 175.1 |
| D | 2 | 16 | 695224 | 4237.77 | 655 | 639 | 163.9 |
| D | 8 | 195 | 575995 | 3510.33 | 655 | 639 | 163.9 |
| D | 1 | 52 | 484816 | 2954.04 | 655 | 639 | 163.9 |
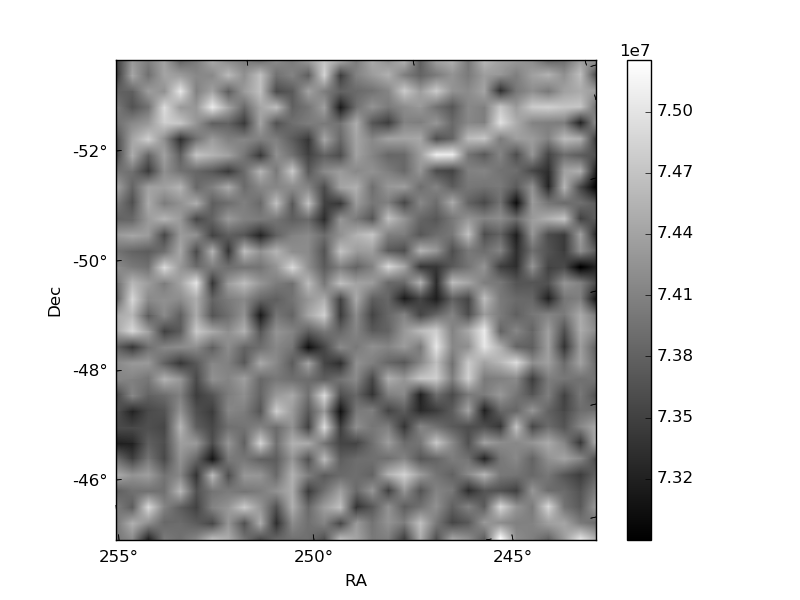
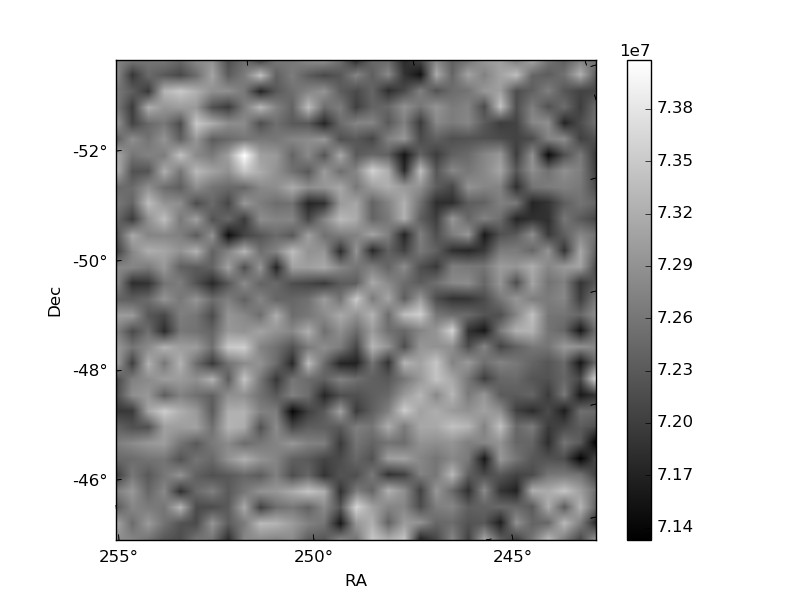
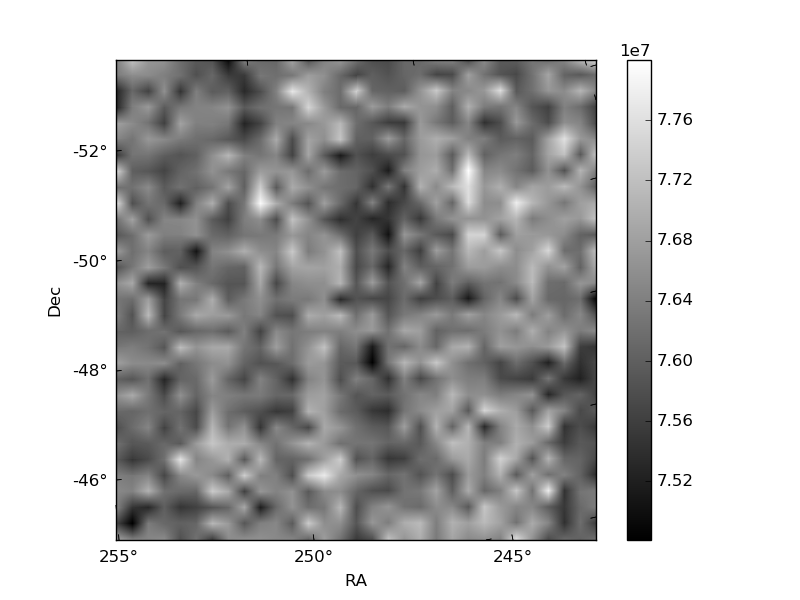
Histogram calculated using DETX and DETY for each event in the final _common_clean file
| Quadrant A | 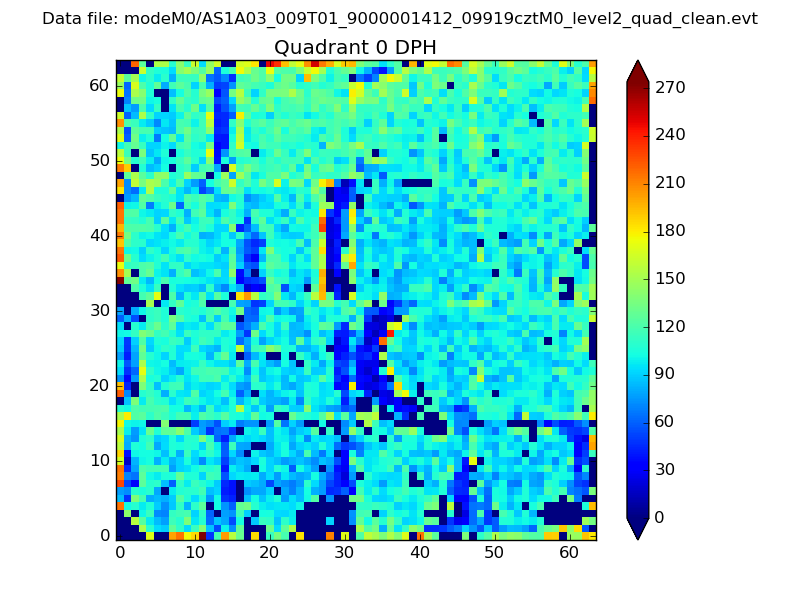 |
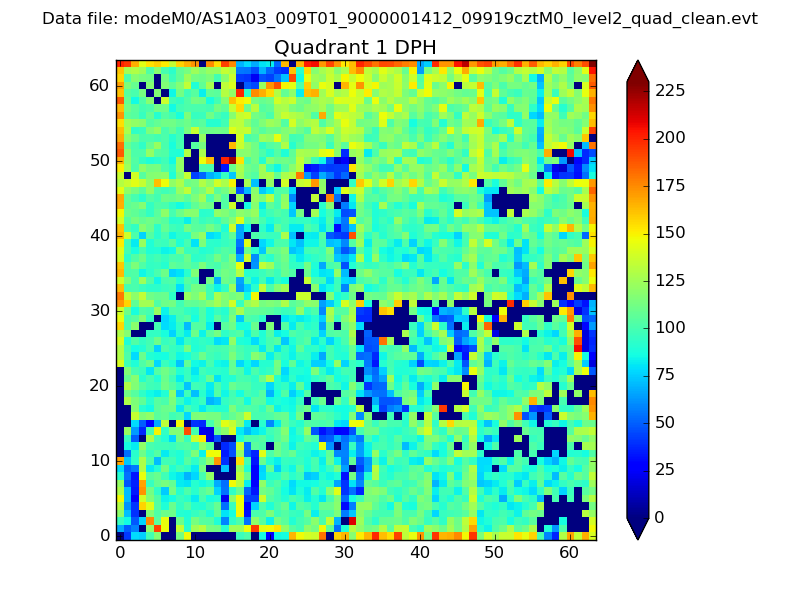 |
Quadrant B |
|---|---|---|---|
| Quadrant D | 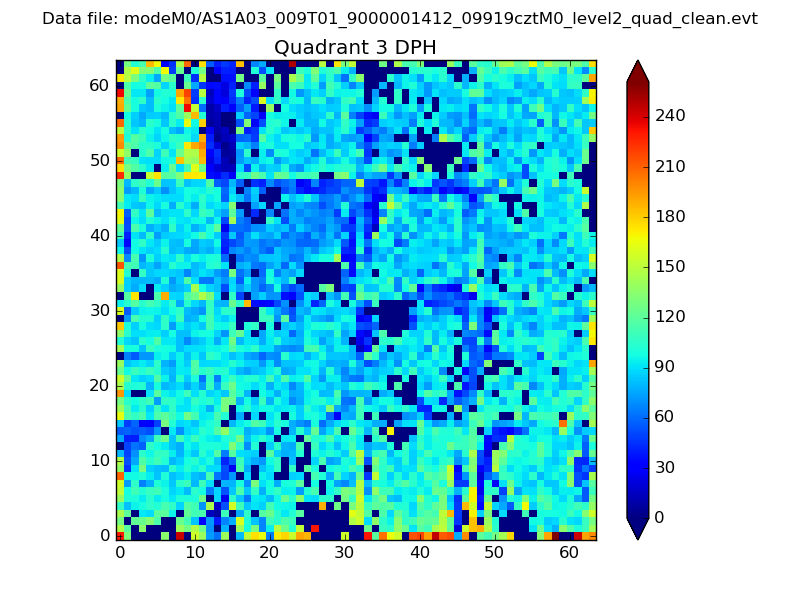 |
 |
Quadrant C |
| Plot type | Count rate plots | Images |
|---|---|---|
| Comparison with Poisson distribution Blue bars denote a histogram of data divided into 1 sec bins. Red curve is a Poisson curve with rate = median count rate of data. |
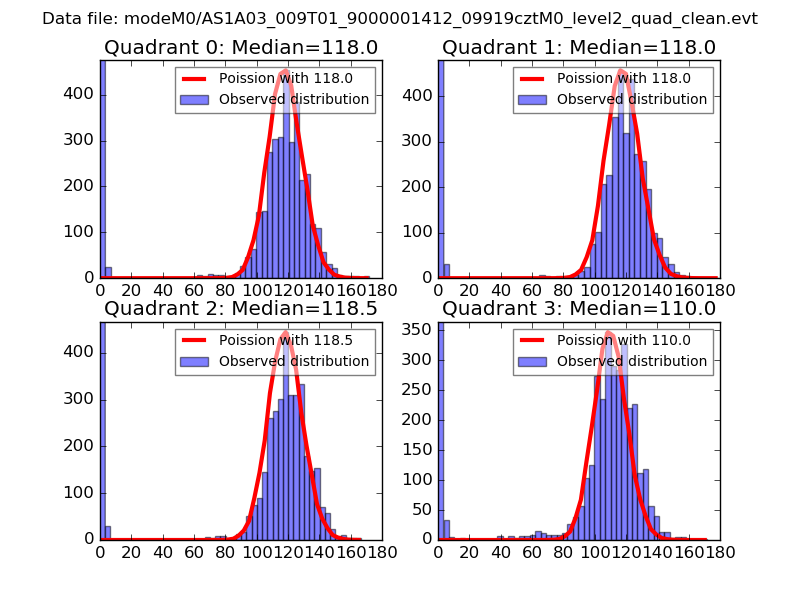 |
 |
| Quadrant-wise count rates Data is divided into 100 sec bins |
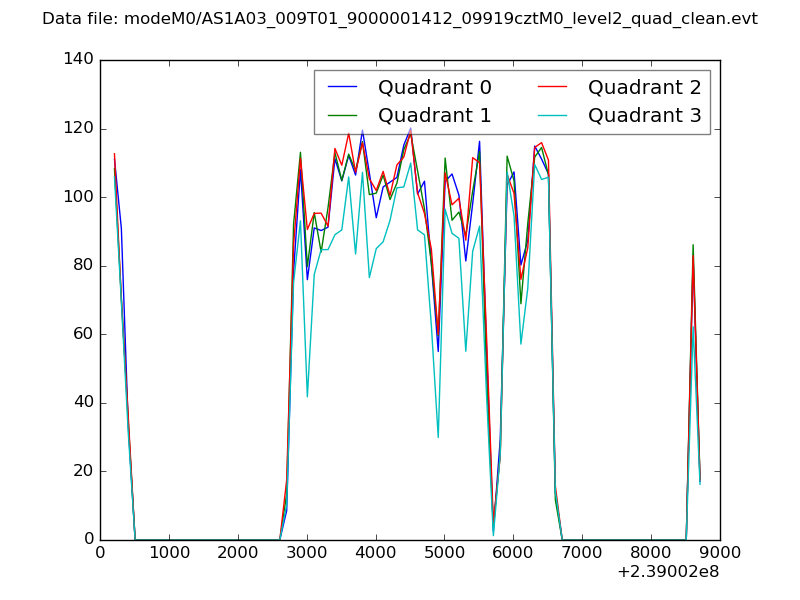 |
|
| Module-wise count rates for Quadrant A Data is divided into 100 sec bins |
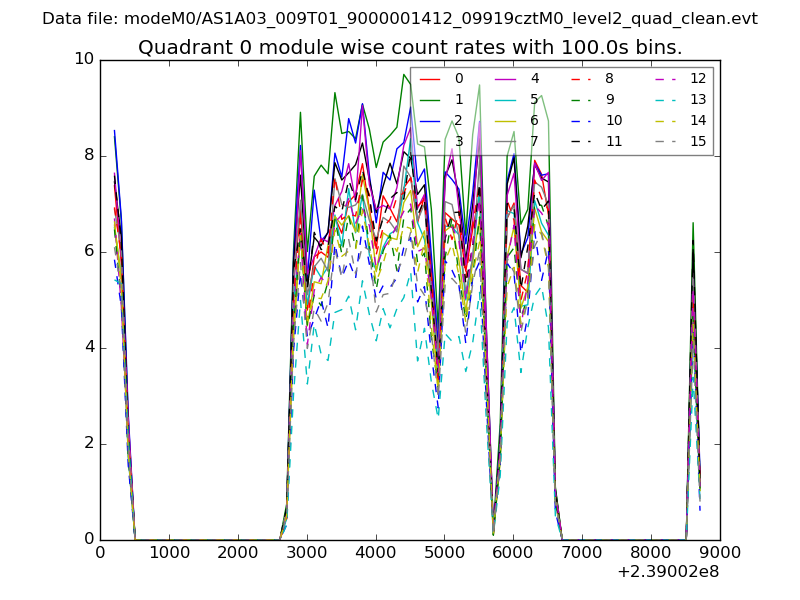 |
 |
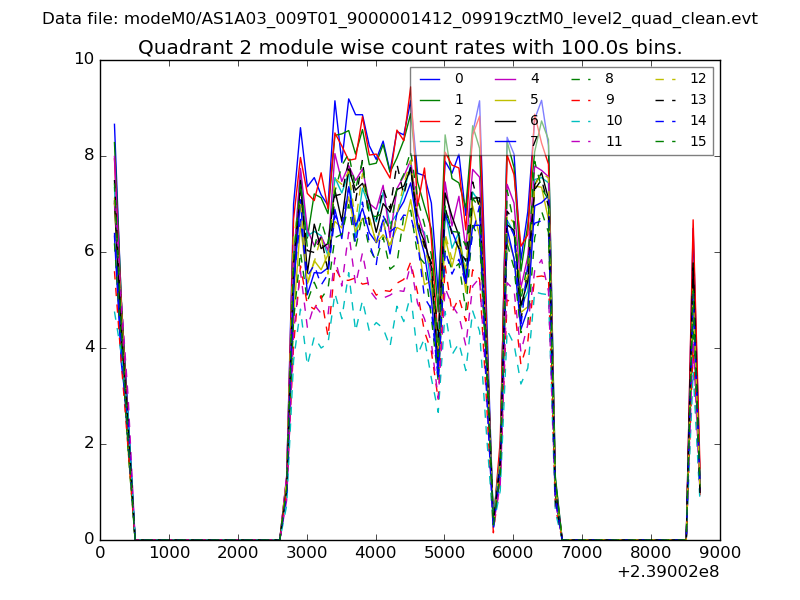
| Module-wise count rates for Quadrant B Data is divided into 100 sec bins |
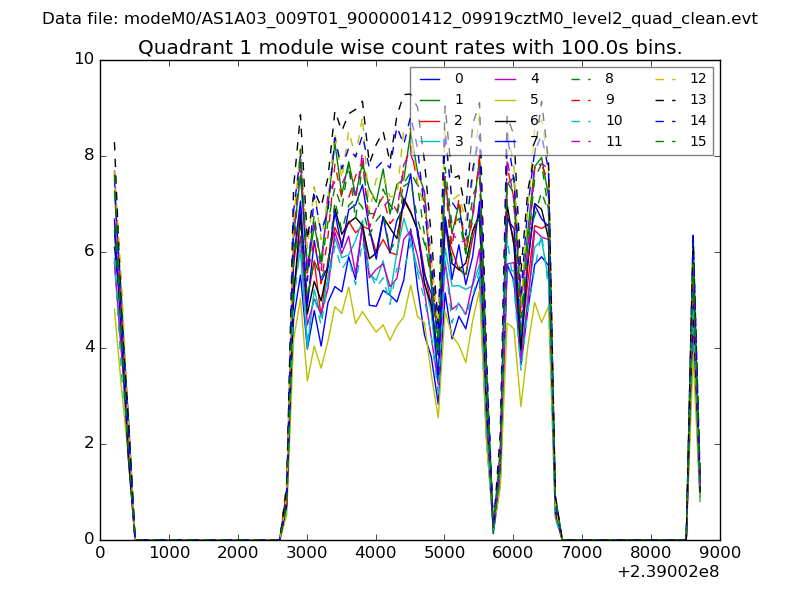 |
 |
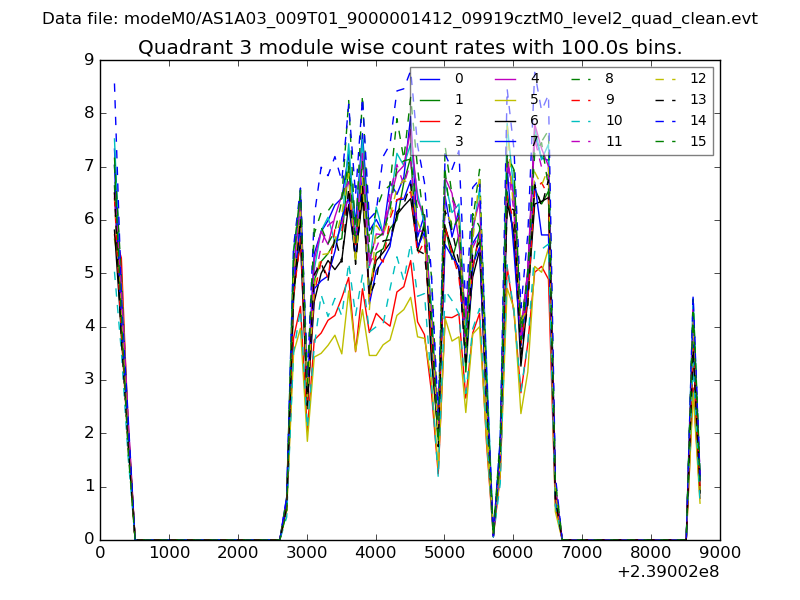
| Module-wise count rates for Quadrant C Data is divided into 100 sec bins |
 |
 |
| Module-wise count rates for Quadrant D Data is divided into 100 sec bins |
 |
 |
| Parameter | Plot |
|---|---|
| CZT HV Monitor |  |
| D_VDD |  |
| Temperature 1 | 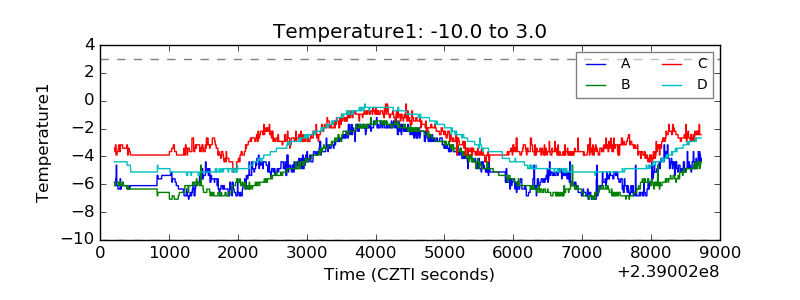 |
| Veto HV Monitor | 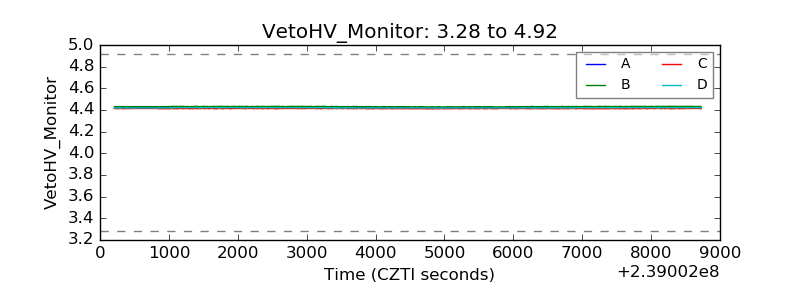 |
| Veto LLD | 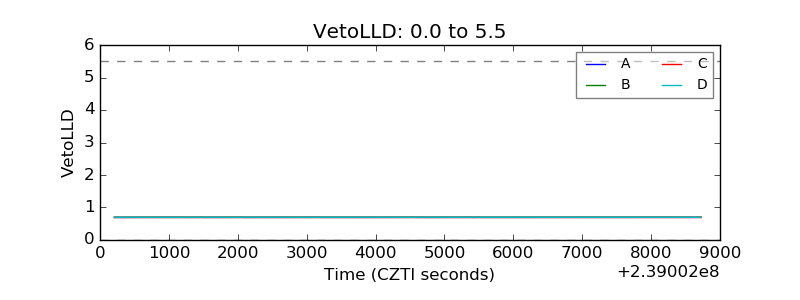 |
| Alpha Counter | 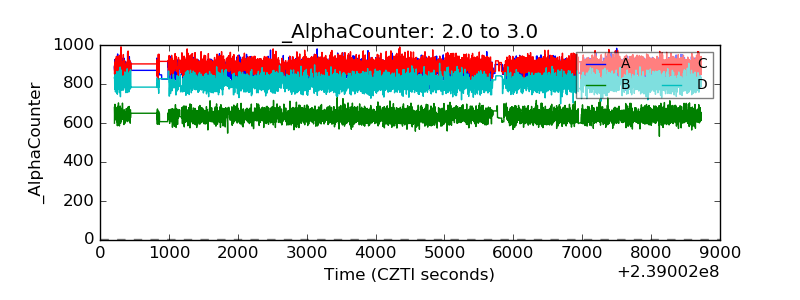 |
| _CPM_Rate | 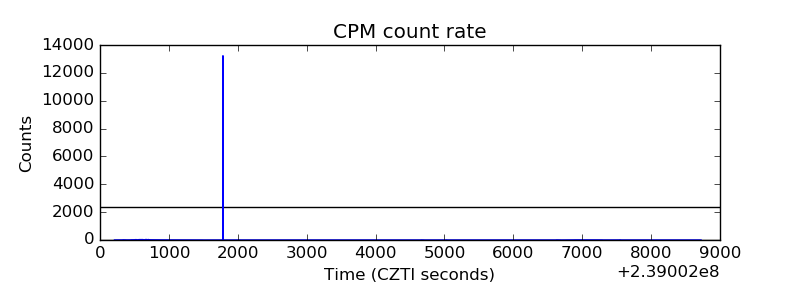 |
| CZT Counter |  |
| +2.5 Volts monitor |  |
| +5 Volts monitor | 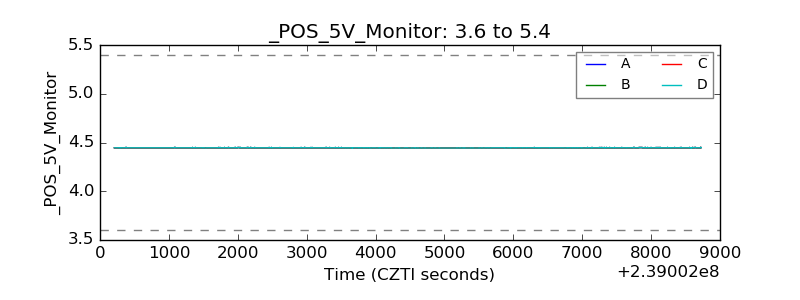 |
| _ROLL_ROT | 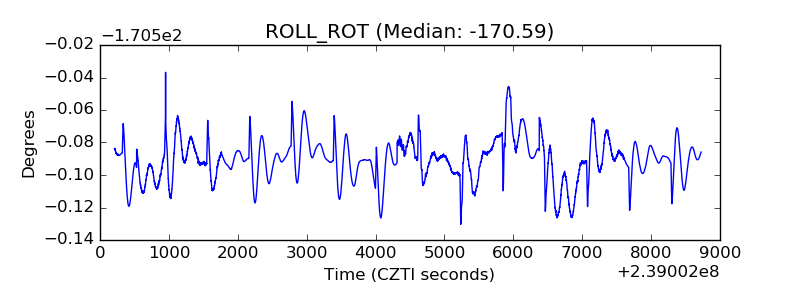 |
| _Roll_DEC | 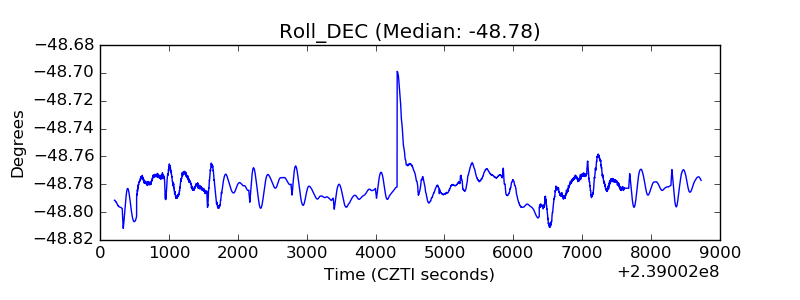 |
| _Roll_RA |  |
| Veto Counter | 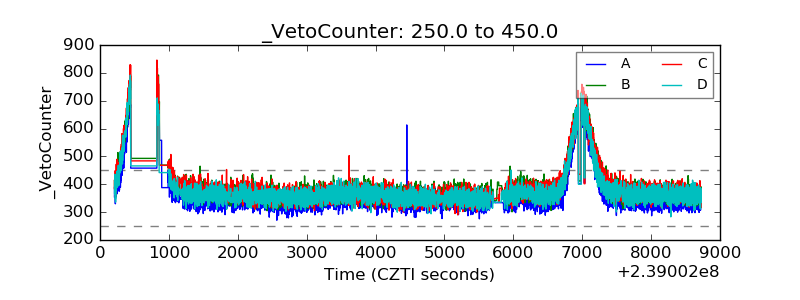 |