| Param | Original file | Final file |
|---|---|---|
| Filename | modeM0/AS1A03_009T01_9000001412_09920cztM0_level2.evt | modeM0/AS1A03_009T01_9000001412_09920cztM0_level2_quad_clean.evt |
| Size (bytes) | 526,717,440 | 73,105,920 |
| Size | 502.3 MB | 69.7 MB |
| Events in quadrant A | 3,587,916 | 448,359 |
| Events in quadrant B | 3,222,092 | 465,556 |
| Events in quadrant C | 3,031,893 | 465,271 |
| Events in quadrant D | 5,672,590 | 386,242 |
| Mode SS | |||
|---|---|---|---|
| Quadrant | BADHDUFLAG | Total packets | Discarded packets |
| A | 0 | 171 | 41 |
| B | 0 | 171 | 35 |
| C | 0 | 172 | 36 |
| D | 0 | 172 | 42 |
| Mode M0 | |||
|---|---|---|---|
| Quadrant | BADHDUFLAG | Total packets | Discarded packets |
| A | 0 | 19830 | 4633 |
| B | 0 | 18021 | 4059 |
| C | 0 | 17672 | 3906 |
| D | 0 | 31624 | 10673 |
| Mode M9 | |||
|---|---|---|---|
| Quadrant | BADHDUFLAG | Total packets | Discarded packets |
| A | 0 | 1 | 0 |
| B | 0 | 1 | 0 |
| C | 0 | 1 | 0 |
| D | 0 | 1 | 0 |
| Quadrant | Total seconds | Saturated seconds | Saturation percentage |
|---|---|---|---|
| A | 6514 | 395 | 6.063862% |
| B | 6559 | 346 | 5.275194% |
| C | 6588 | 279 | 4.234973% |
| D | 5951 | 686 | 11.527474% |
Noise dominated data is calculated using 1-second bins in cleaned event files. If a bin has >2000 counts, and if more than 50% of those come from <1% of pixels, then it is considered to be noise-dominated and hence unusable.
| Quadrant | # 1 sec bins | Bins with >0 counts | Bins with >2000 counts | High rate bins dominated by noise | Noise dominated (total time) | Noise dominated (detector-on time) | Marked lightcurve |
|---|---|---|---|---|---|---|---|
| A | 8659 | 7257 | 74 | 74 | 0.85% | 1.02% | 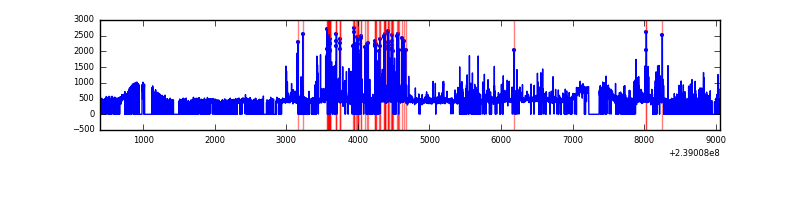 |
| B | 8659 | 7316 | 11 | 11 | 0.13% | 0.15% | 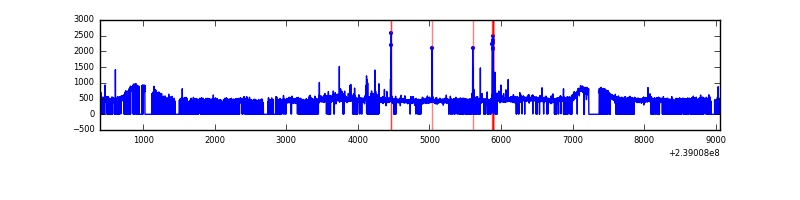 |
| C | 8660 | 7356 | 0 | 0 | 0.00% | 0.00% | 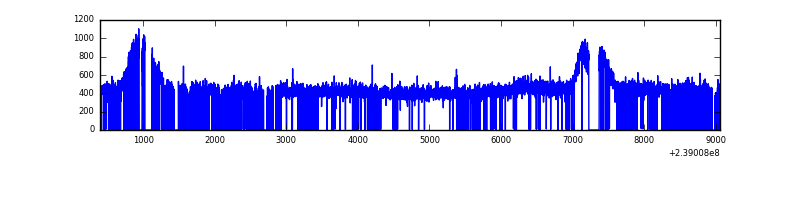 |
| D | 8659 | 6719 | 366 | 366 | 4.23% | 5.45% | 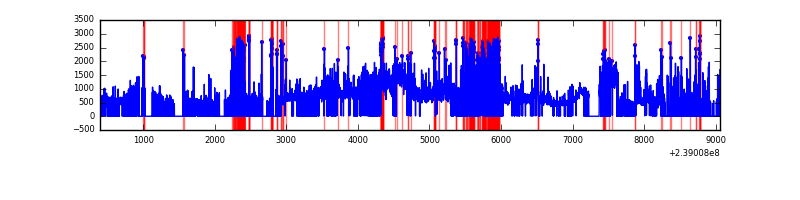 |
Top three noisy pixels from each quadrant. If the there are fewer than three noisy pixels in the level2.evt file, extra rows are filled as -1
| Pixel properties | Quadrant properties | ||||||
|---|---|---|---|---|---|---|---|
| Quadrant | DetID | PixID | Counts | Sigma | Mean | Median | Sigma |
| A | 15 | 239 | 595062 | 3689.33 | 774 | 755 | 161.1 |
| A | 14 | 111 | 7862 | 44.12 | 774 | 755 | 161.1 |
| A | 0 | 226 | 6961 | 38.53 | 774 | 755 | 161.1 |
| B | 0 | 214 | 33468 | 212.43 | 789 | 766 | 153.9 |
| B | 4 | 239 | 31115 | 197.14 | 789 | 766 | 153.9 |
| B | 15 | 85 | 30613 | 193.88 | 789 | 766 | 153.9 |
| C | 13 | 61 | 5904 | 28.46 | 775 | 776 | 180.2 |
| C | 14 | 67 | 3817 | 16.87 | 775 | 776 | 180.2 |
| C | 12 | 4 | 3239 | 13.67 | 775 | 776 | 180.2 |
| D | 2 | 16 | 1367042 | 8087.35 | 673 | 654 | 169.0 |
| D | 1 | 52 | 642866 | 3801.11 | 673 | 654 | 169.0 |
| D | 8 | 195 | 527928 | 3120.82 | 673 | 654 | 169.0 |
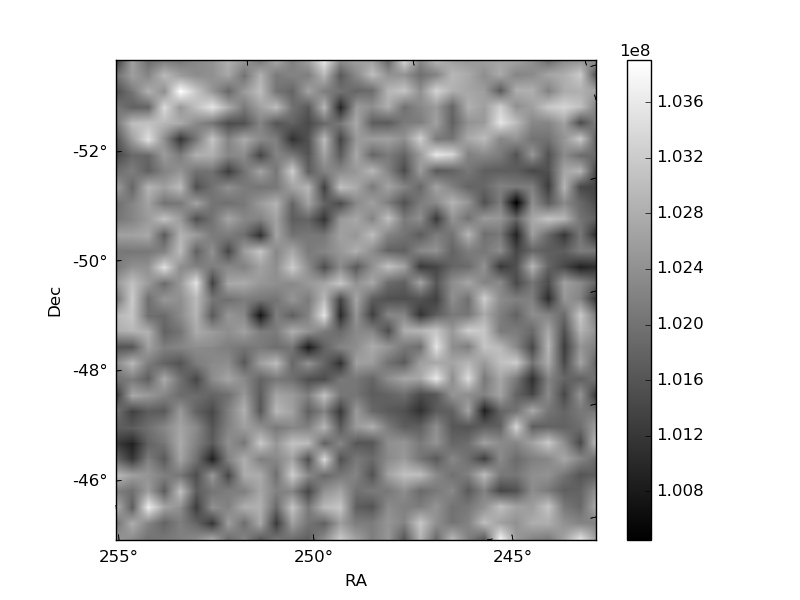
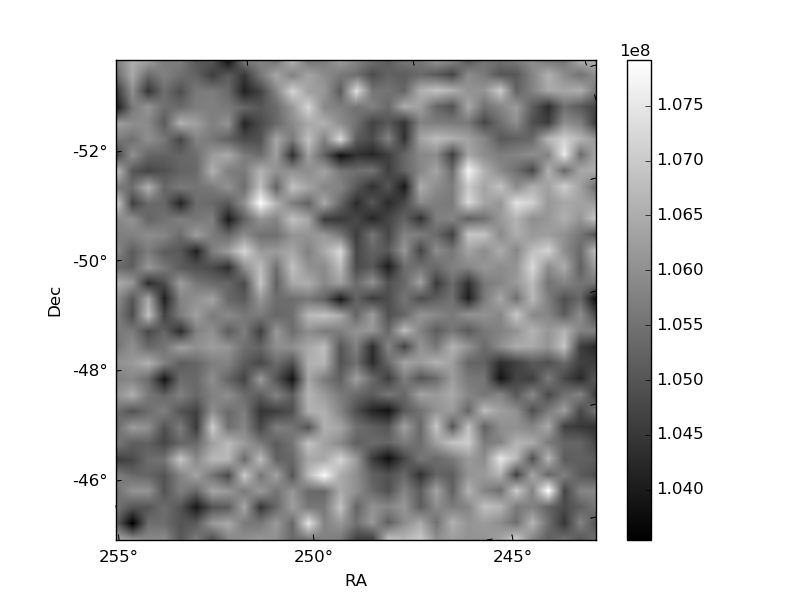
Histogram calculated using DETX and DETY for each event in the final _common_clean file
| Quadrant A |  |
 |
Quadrant B |
|---|---|---|---|
| Quadrant D | 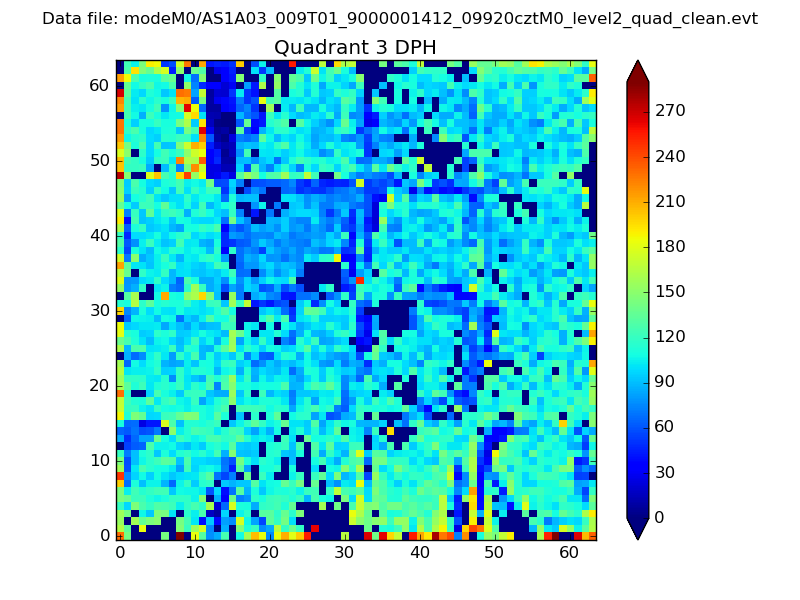 |
 |
Quadrant C |
| Plot type | Count rate plots | Images |
|---|---|---|
| Comparison with Poisson distribution Blue bars denote a histogram of data divided into 1 sec bins. Red curve is a Poisson curve with rate = median count rate of data. |
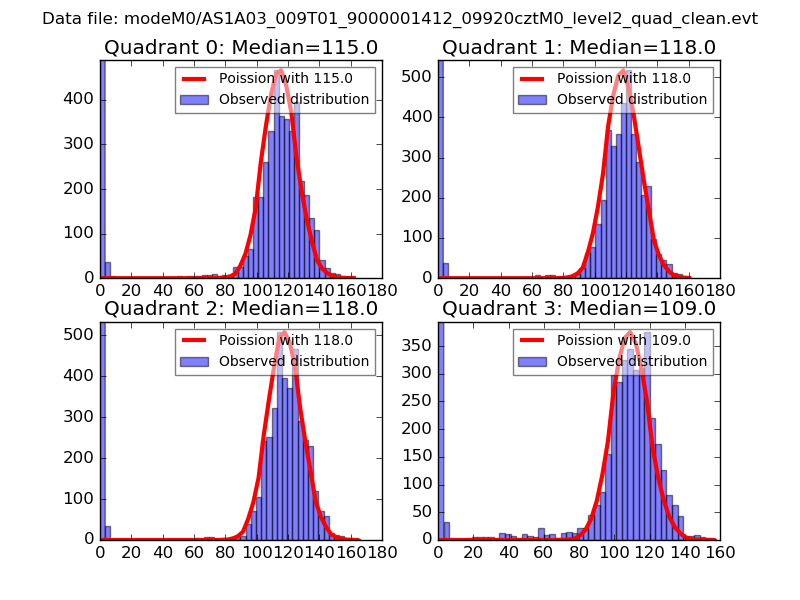 |
 |
| Quadrant-wise count rates Data is divided into 100 sec bins |
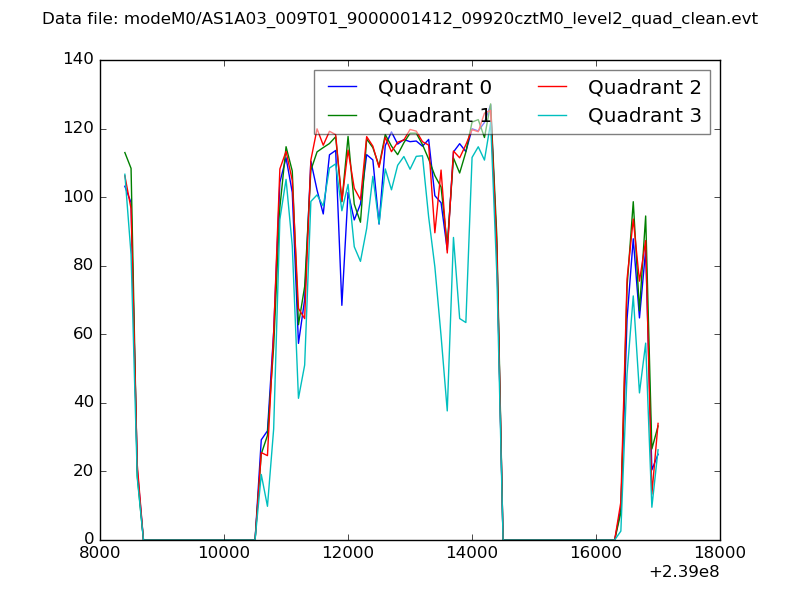 |
|
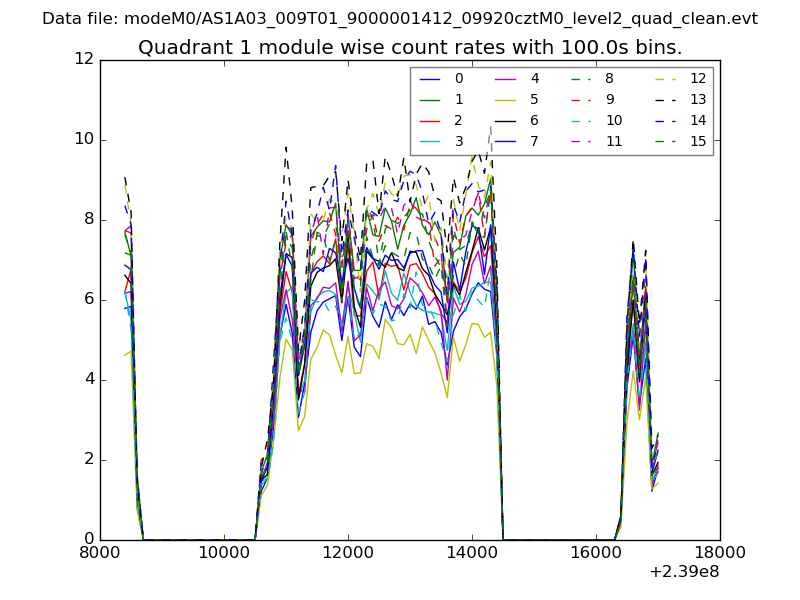
| Module-wise count rates for Quadrant A Data is divided into 100 sec bins |
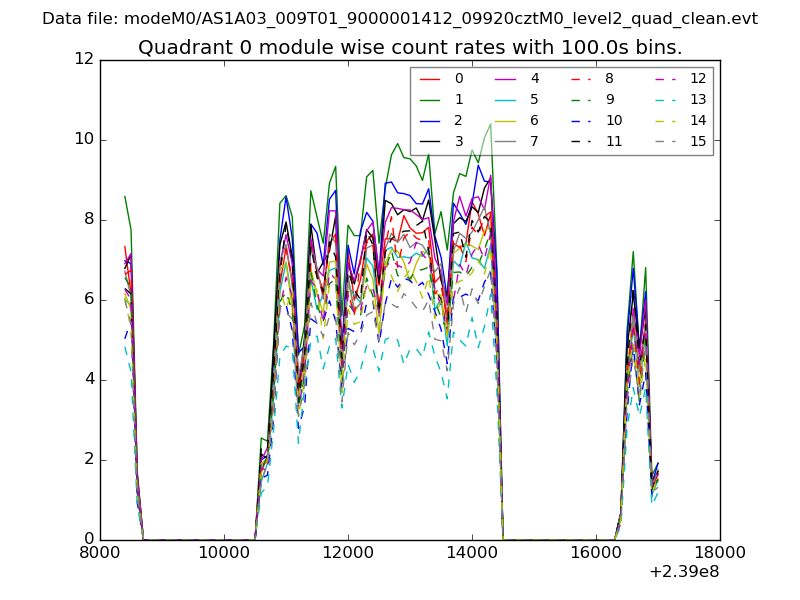 |
 |
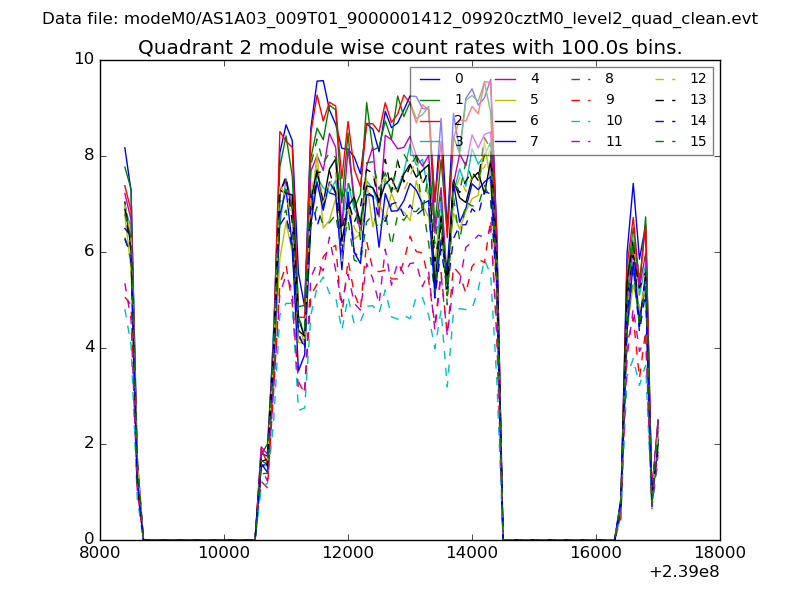
| Module-wise count rates for Quadrant B Data is divided into 100 sec bins |
 |
 |
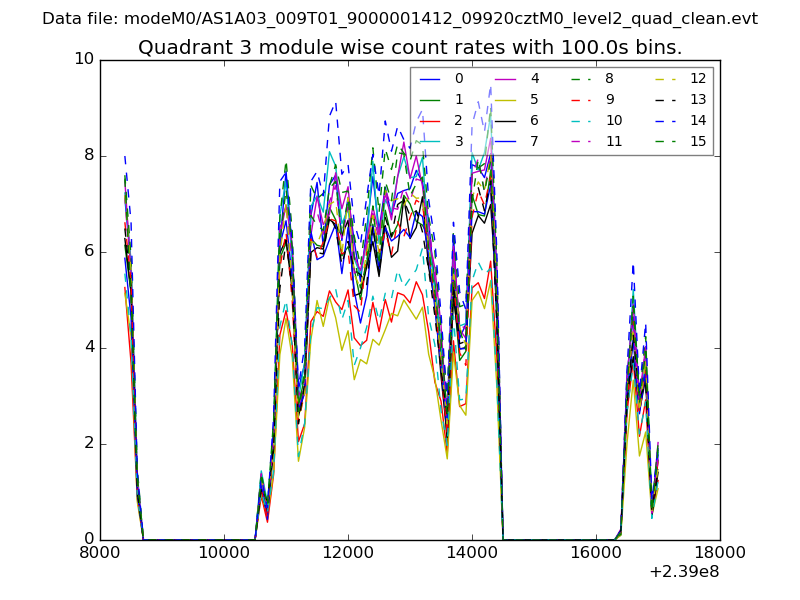
| Module-wise count rates for Quadrant C Data is divided into 100 sec bins |
 |
 |
| Module-wise count rates for Quadrant D Data is divided into 100 sec bins |
 |
 |
| Parameter | Plot |
|---|---|
| CZT HV Monitor | 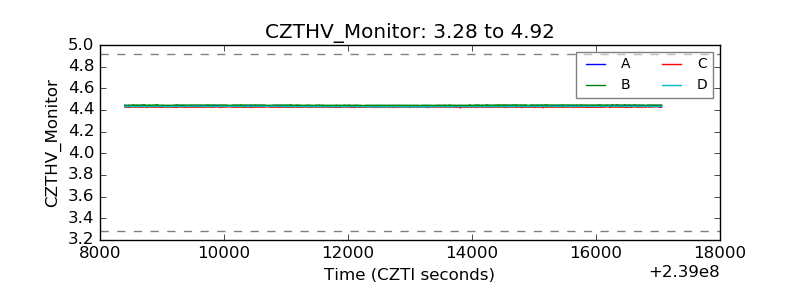 |
| D_VDD | 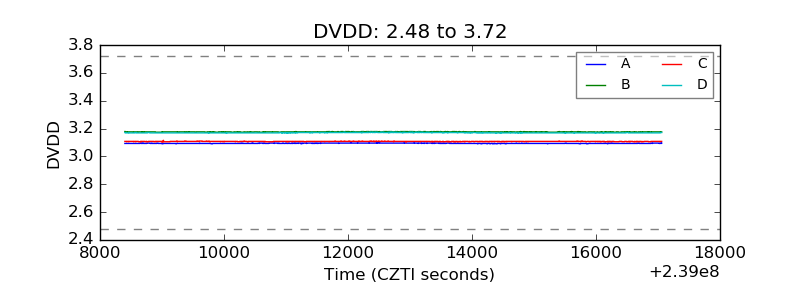 |
| Temperature 1 | 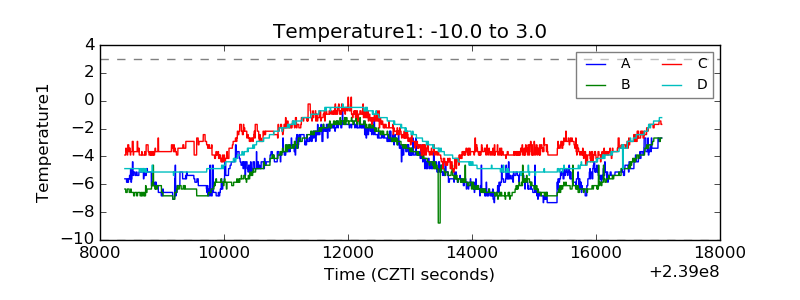 |
| Veto HV Monitor | 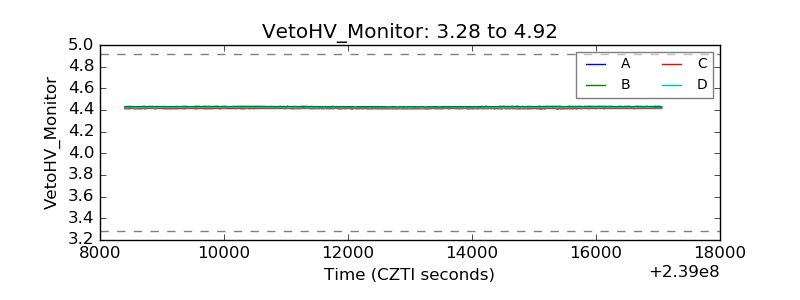 |
| Veto LLD | 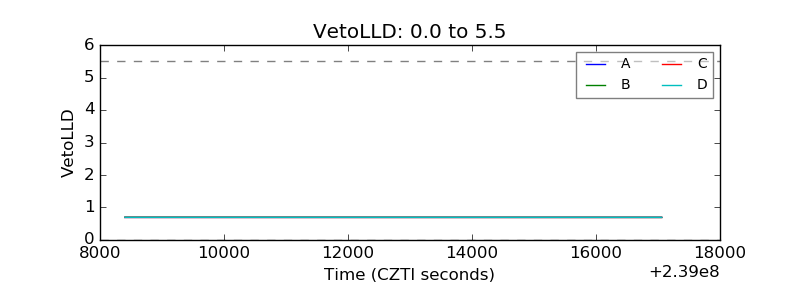 |
| Alpha Counter | 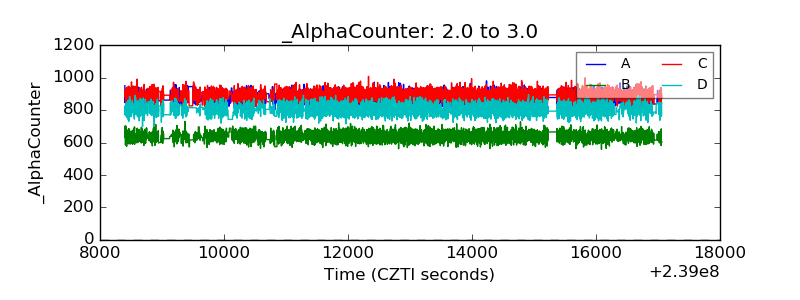 |
| _CPM_Rate | 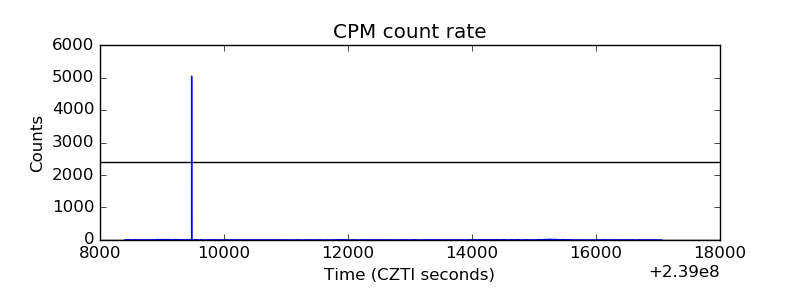 |
| CZT Counter |  |
| +2.5 Volts monitor |  |
| +5 Volts monitor |  |
| _ROLL_ROT | 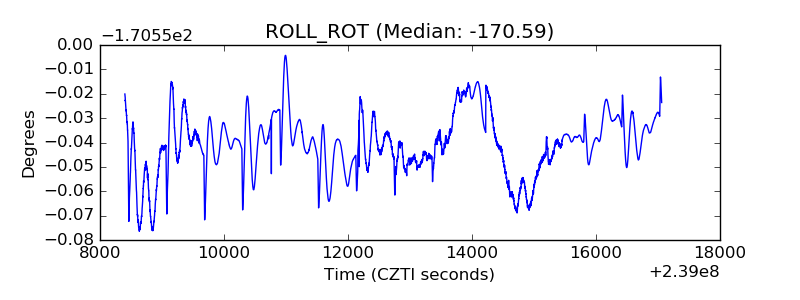 |
| _Roll_DEC | 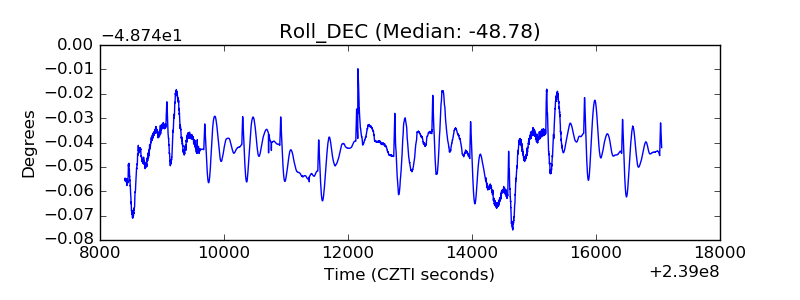 |
| _Roll_RA | 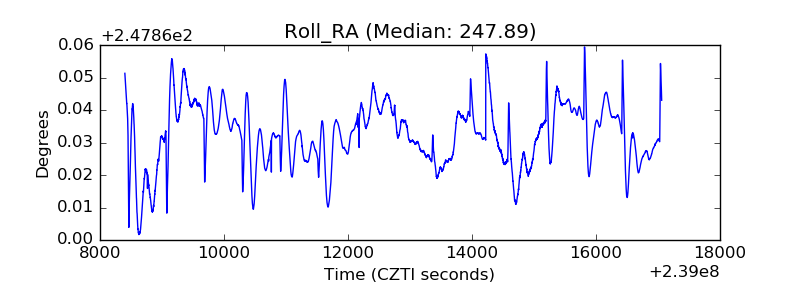 |
| Veto Counter | 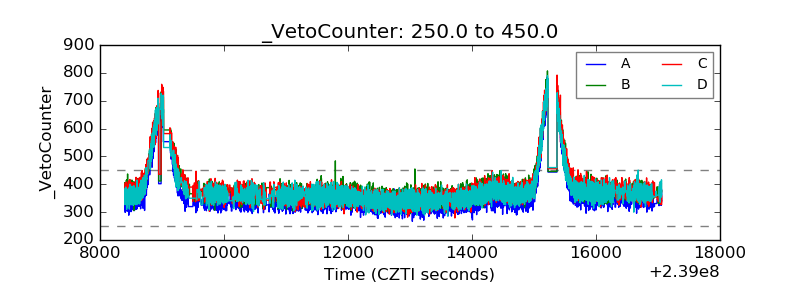 |