| Param | Original file | Final file |
|---|---|---|
| Filename | modeM0/AS1A03_009T01_9000001412_09922cztM0_level2.evt | modeM0/AS1A03_009T01_9000001412_09922cztM0_level2_quad_clean.evt |
| Size (bytes) | 221,762,880 | 36,054,720 |
| Size | 211.5 MB | 34.4 MB |
| Events in quadrant A | 1,493,771 | 223,972 |
| Events in quadrant B | 1,350,361 | 227,794 |
| Events in quadrant C | 1,253,760 | 231,570 |
| Events in quadrant D | 2,421,399 | 203,360 |
| Mode SS | |||
|---|---|---|---|
| Quadrant | BADHDUFLAG | Total packets | Discarded packets |
| A | 0 | 62 | 6 |
| B | 0 | 62 | 4 |
| C | 0 | 62 | 4 |
| D | 0 | 62 | 4 |
| Mode M0 | |||
|---|---|---|---|
| Quadrant | BADHDUFLAG | Total packets | Discarded packets |
| A | 0 | 6908 | 537 |
| B | 0 | 6301 | 440 |
| C | 0 | 6218 | 404 |
| D | 0 | 10190 | 1075 |
| Quadrant | Total seconds | Saturated seconds | Saturation percentage |
|---|---|---|---|
| A | 2876 | 17 | 0.591099% |
| B | 2888 | 2 | 0.069252% |
| C | 2899 | 0 | 0.000000% |
| D | 2790 | 148 | 5.304659% |
Noise dominated data is calculated using 1-second bins in cleaned event files. If a bin has >2000 counts, and if more than 50% of those come from <1% of pixels, then it is considered to be noise-dominated and hence unusable.
| Quadrant | # 1 sec bins | Bins with >0 counts | Bins with >2000 counts | High rate bins dominated by noise | Noise dominated (total time) | Noise dominated (detector-on time) | Marked lightcurve |
|---|---|---|---|---|---|---|---|
| A | 3101 | 3033 | 8 | 8 | 0.26% | 0.26% | 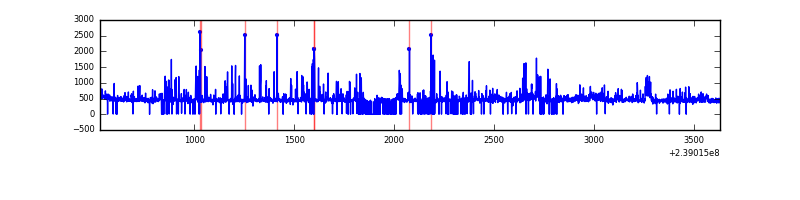 |
| B | 3101 | 3030 | 0 | 0 | 0.00% | 0.00% | 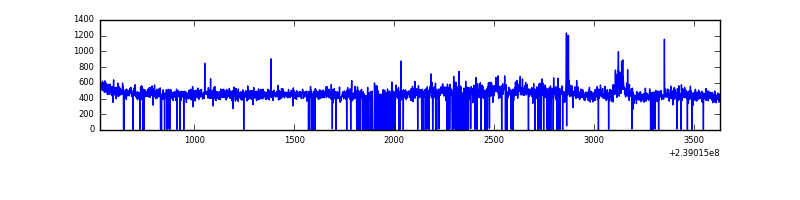 |
| C | 3101 | 3052 | 0 | 0 | 0.00% | 0.00% | 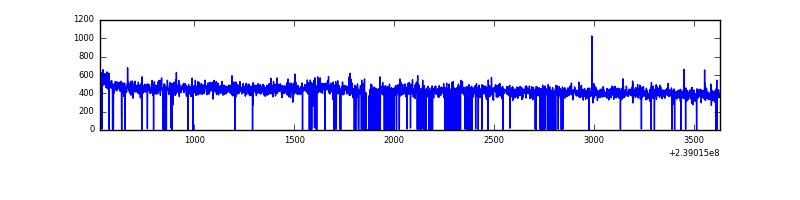 |
| D | 3101 | 2994 | 113 | 113 | 3.64% | 3.77% | 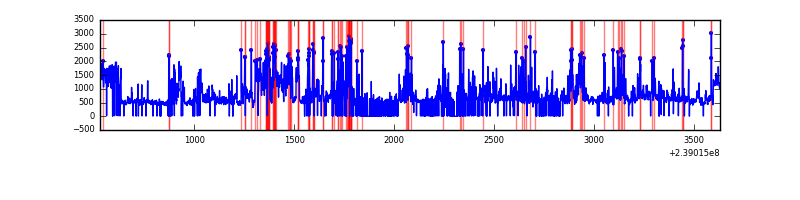 |
Top three noisy pixels from each quadrant. If the there are fewer than three noisy pixels in the level2.evt file, extra rows are filled as -1
| Pixel properties | Quadrant properties | ||||||
|---|---|---|---|---|---|---|---|
| Quadrant | DetID | PixID | Counts | Sigma | Mean | Median | Sigma |
| A | 15 | 239 | 212494 | 3096.59 | 326 | 318 | 68.5 |
| A | 8 | 15 | 26339 | 379.76 | 326 | 318 | 68.5 |
| A | 0 | 226 | 3023 | 39.48 | 326 | 318 | 68.5 |
| B | 0 | 219 | 28216 | 432.17 | 326 | 318 | 64.6 |
| B | 0 | 214 | 27369 | 419.05 | 326 | 318 | 64.6 |
| B | 4 | 81 | 11927 | 179.84 | 326 | 318 | 64.6 |
| C | 14 | 67 | 2488 | 28.49 | 320 | 321 | 76.1 |
| C | 13 | 61 | 2407 | 27.43 | 320 | 321 | 76.1 |
| C | 8 | 222 | 1102 | 10.27 | 320 | 321 | 76.1 |
| D | 1 | 52 | 609303 | 7966.51 | 302 | 295 | 76.4 |
| D | 8 | 195 | 249448 | 3259.2 | 302 | 295 | 76.4 |
| D | 10 | 253 | 144707 | 1889.07 | 302 | 295 | 76.4 |
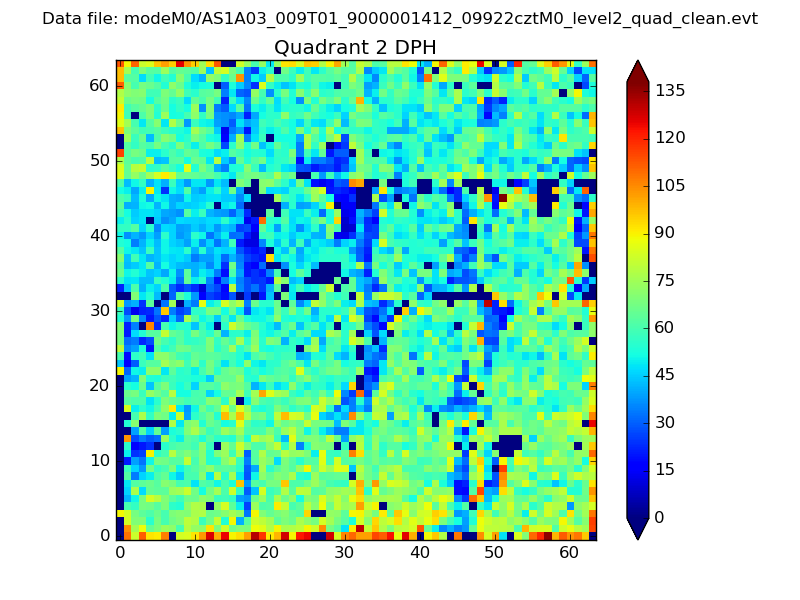
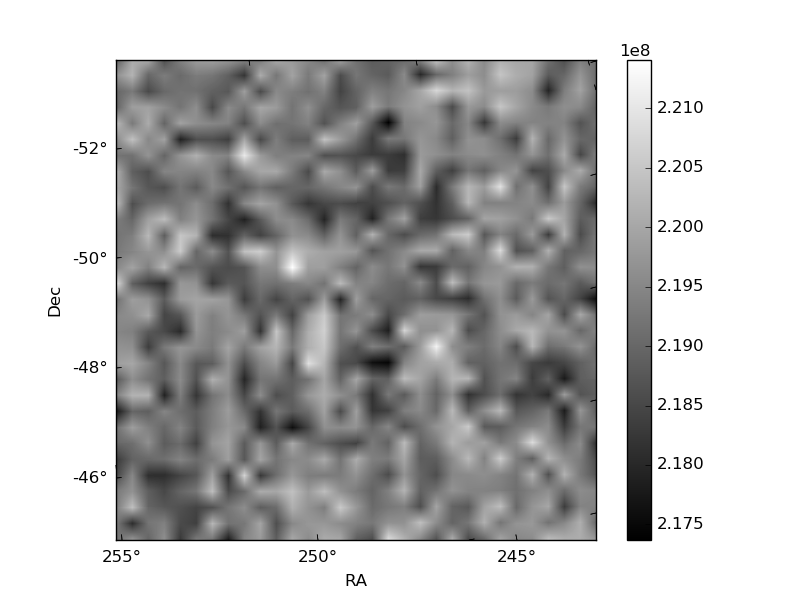
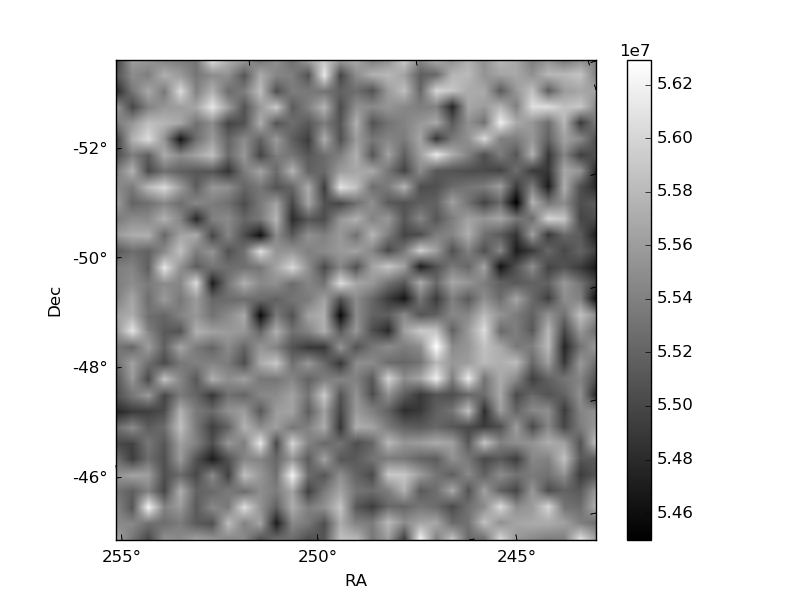
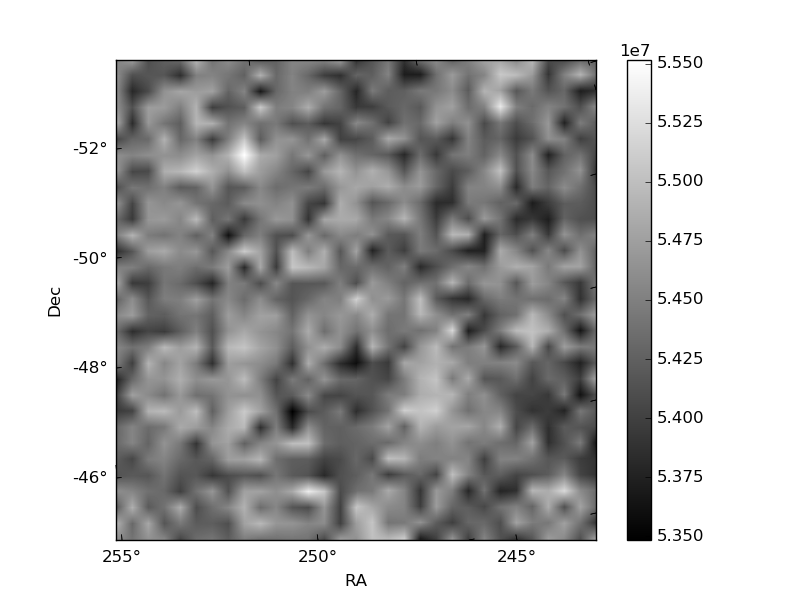
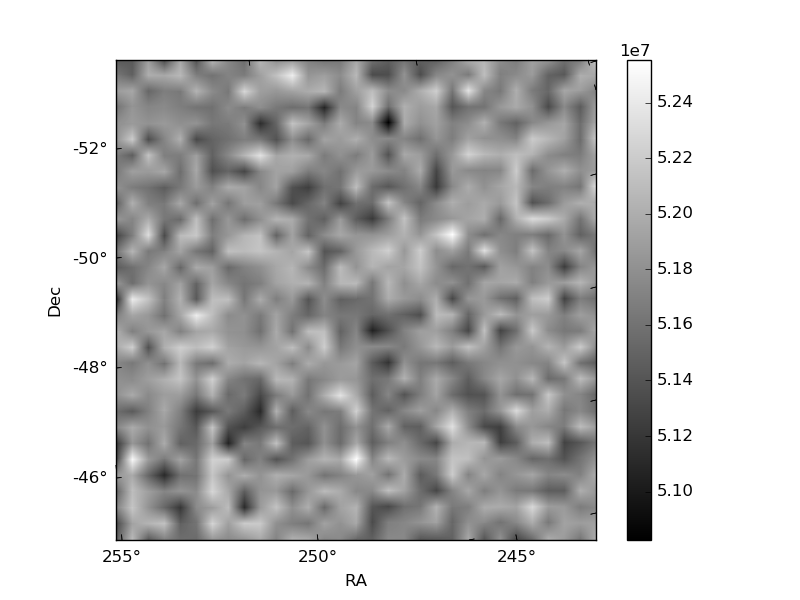
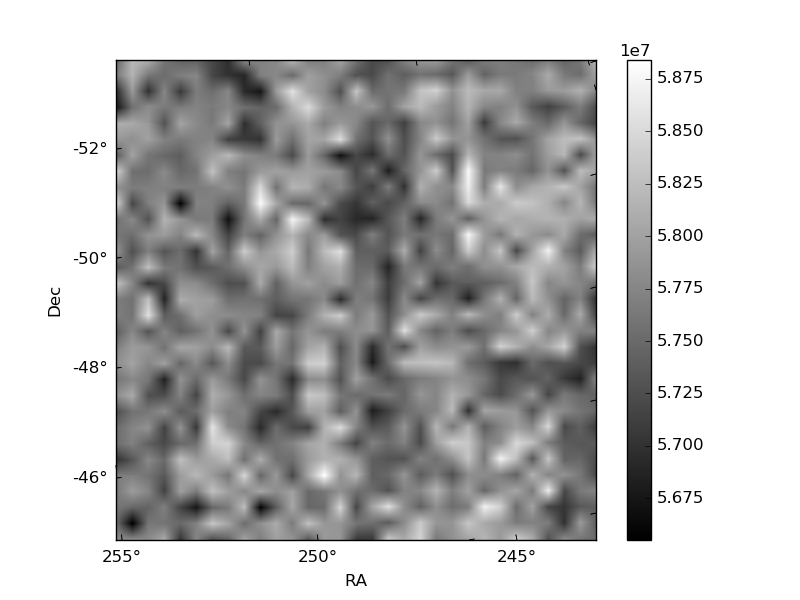
Histogram calculated using DETX and DETY for each event in the final _common_clean file
| Quadrant A | 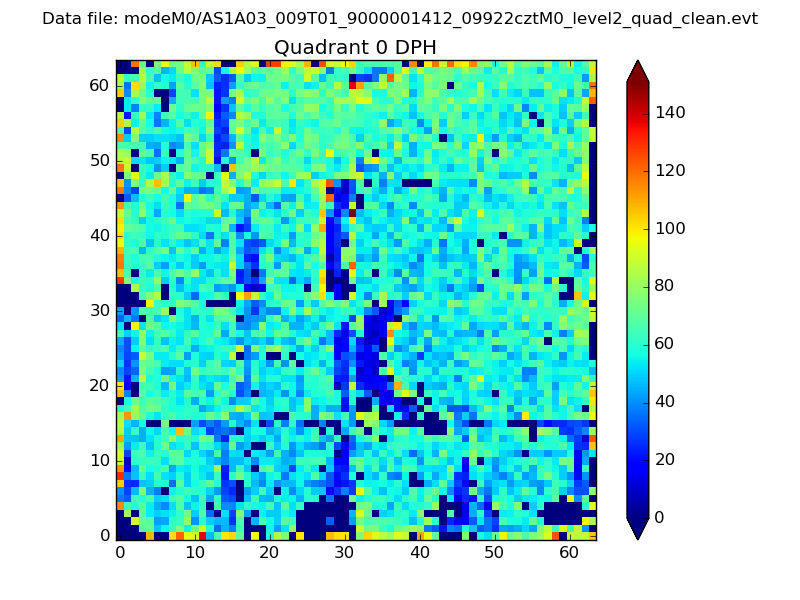 |
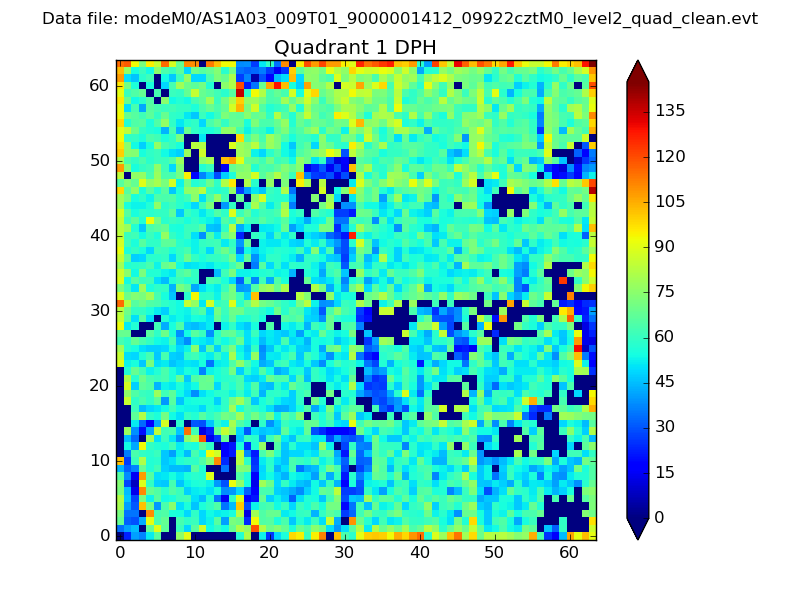 |
Quadrant B |
|---|---|---|---|
| Quadrant D | 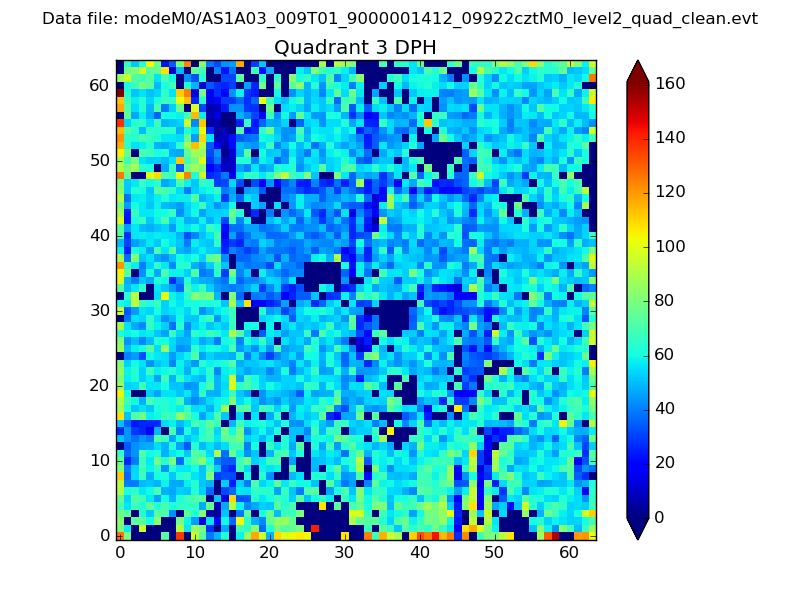 |
 |
Quadrant C |
| Plot type | Count rate plots | Images |
|---|---|---|
| Comparison with Poisson distribution Blue bars denote a histogram of data divided into 1 sec bins. Red curve is a Poisson curve with rate = median count rate of data. |
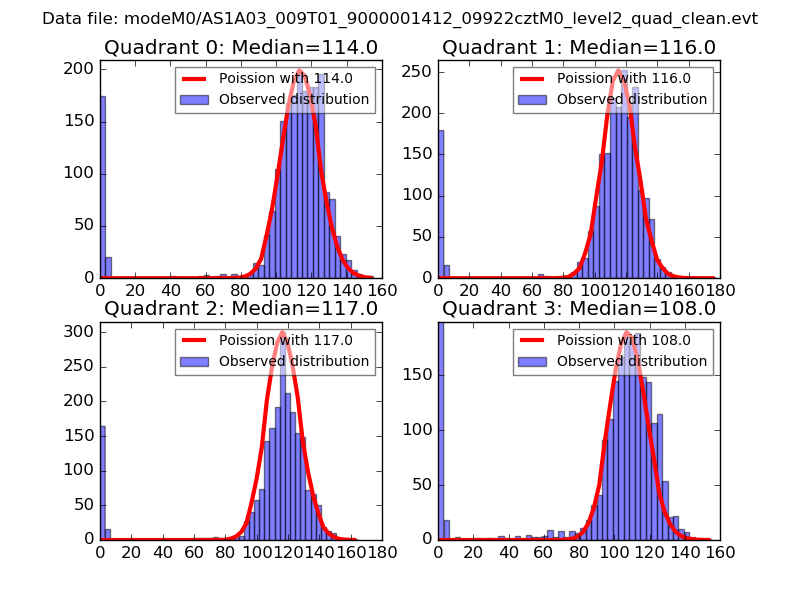 |
 |
| Quadrant-wise count rates Data is divided into 100 sec bins |
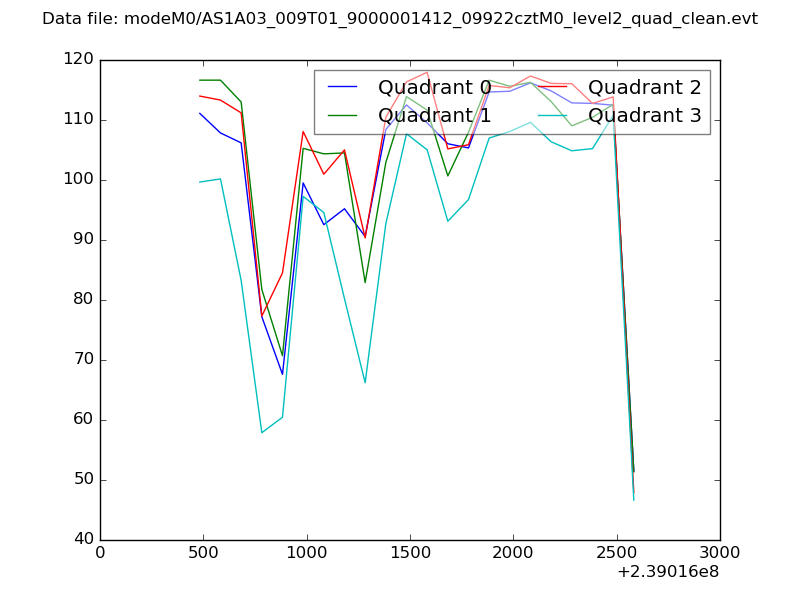 |
|
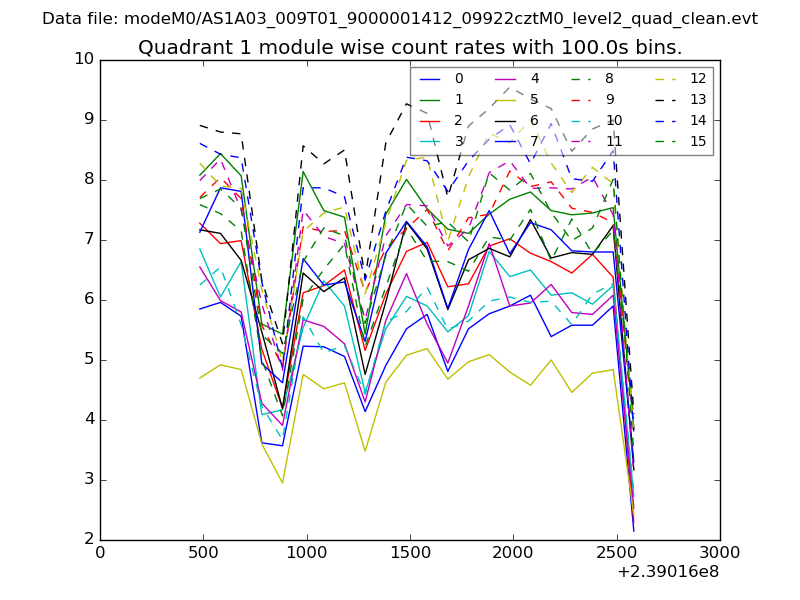
| Module-wise count rates for Quadrant A Data is divided into 100 sec bins |
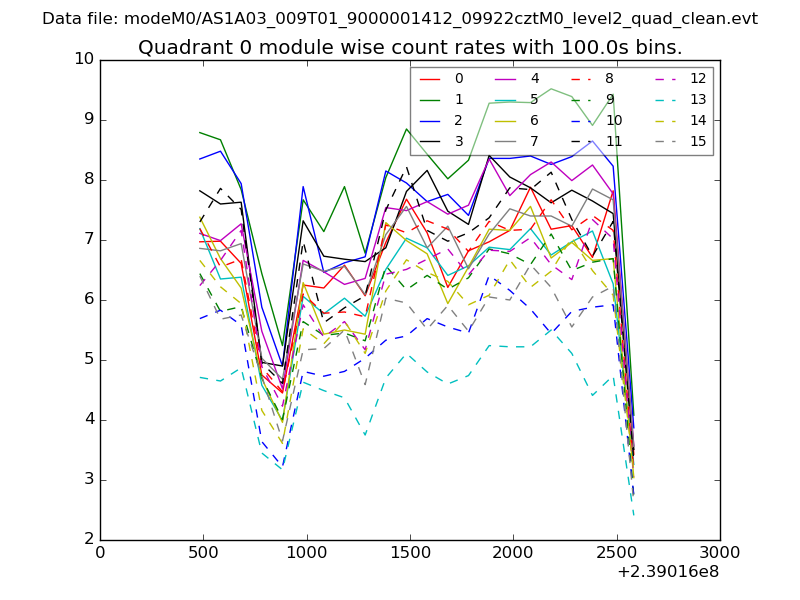 |
 |
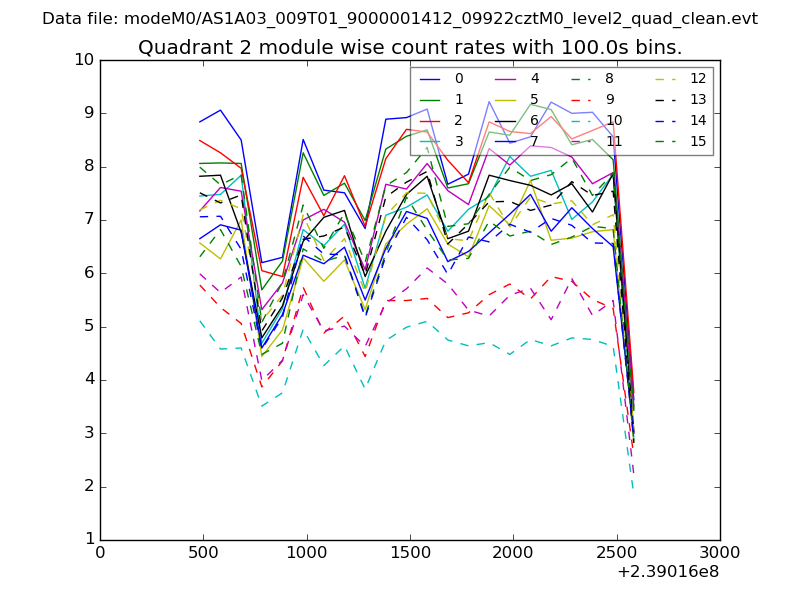
| Module-wise count rates for Quadrant B Data is divided into 100 sec bins |
 |
 |
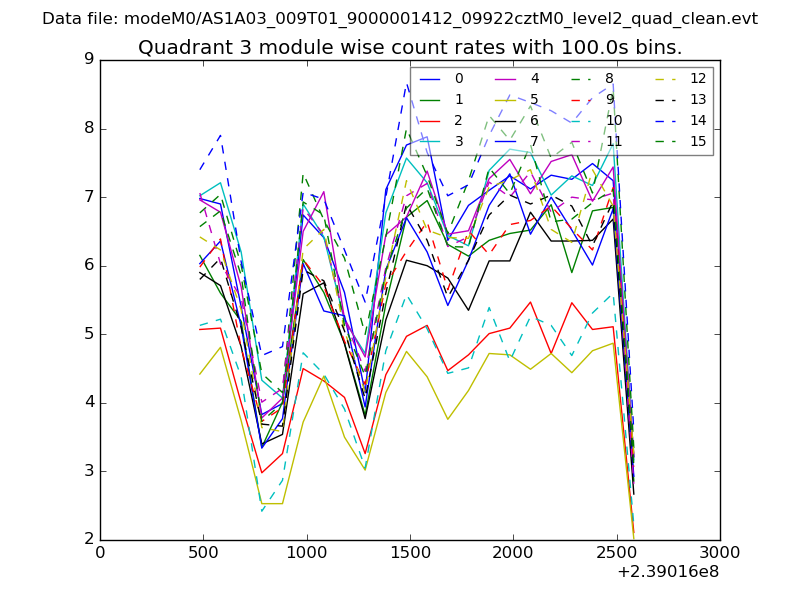
| Module-wise count rates for Quadrant C Data is divided into 100 sec bins |
 |
 |
| Module-wise count rates for Quadrant D Data is divided into 100 sec bins |
 |
 |
| Parameter | Plot |
|---|---|
| CZT HV Monitor | 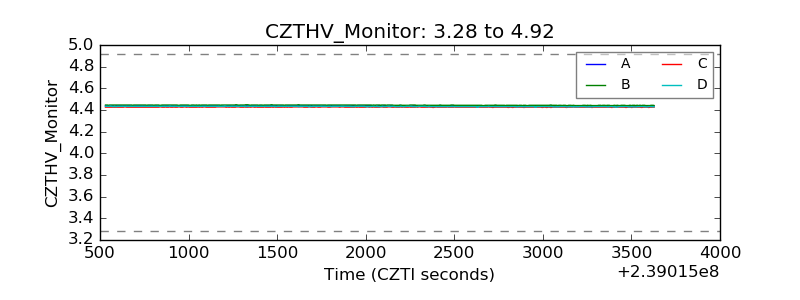 |
| D_VDD | 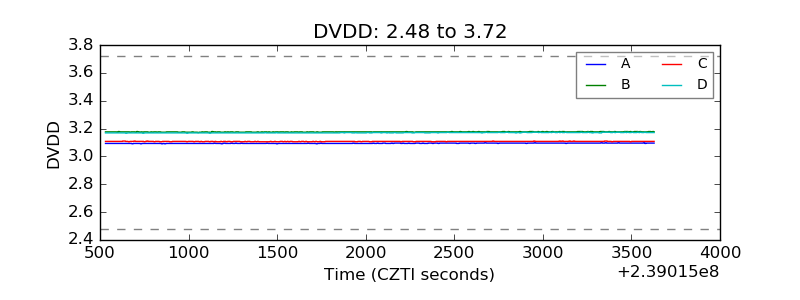 |
| Temperature 1 | 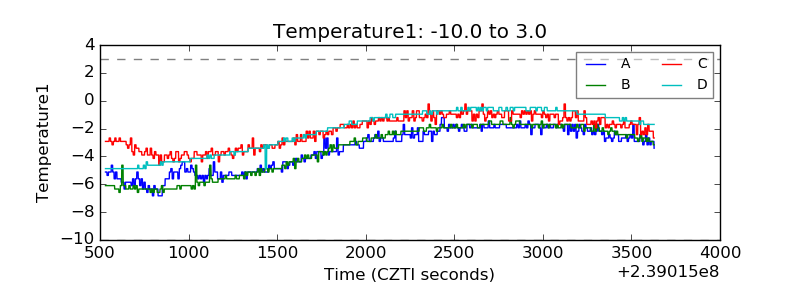 |
| Veto HV Monitor | 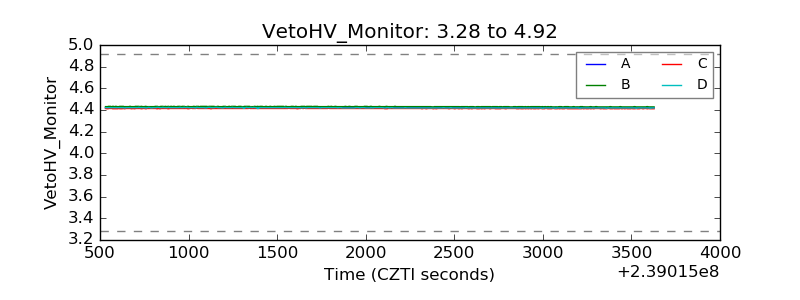 |
| Veto LLD | 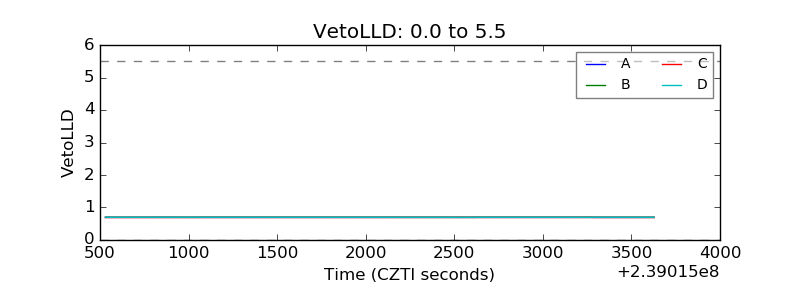 |
| Alpha Counter | 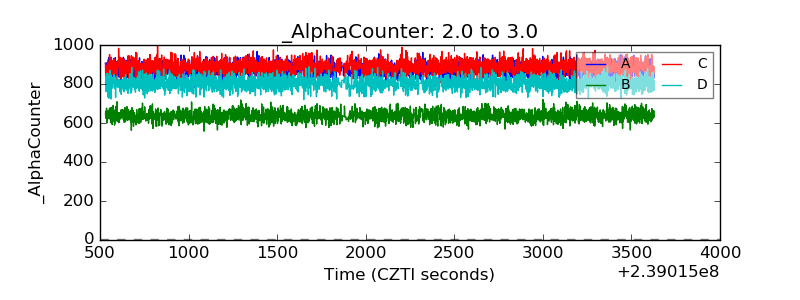 |
| _CPM_Rate | 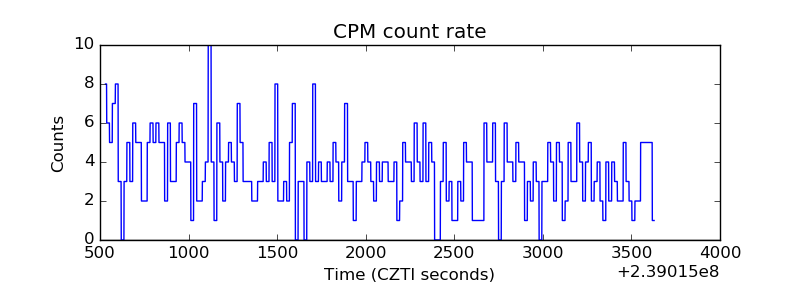 |
| CZT Counter | 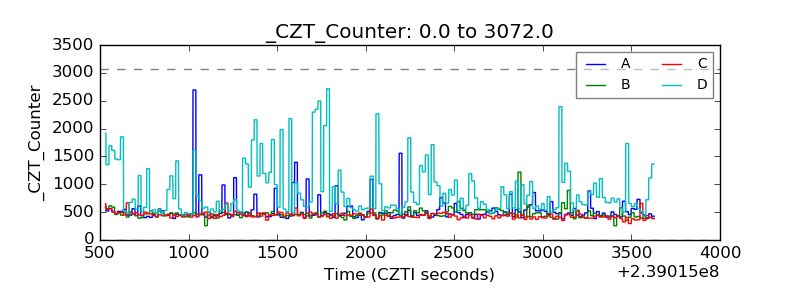 |
| +2.5 Volts monitor |  |
| +5 Volts monitor |  |
| _ROLL_ROT | 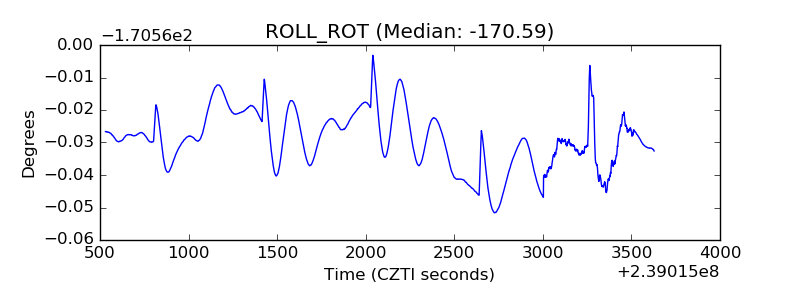 |
| _Roll_DEC | 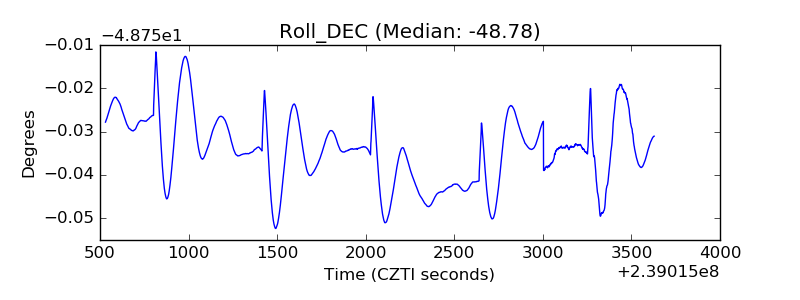 |
| _Roll_RA | 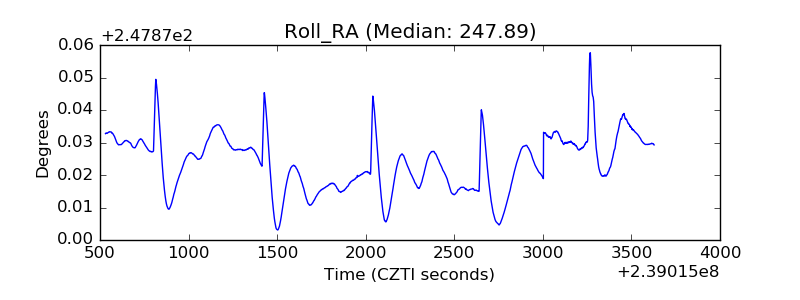 |
| Veto Counter | 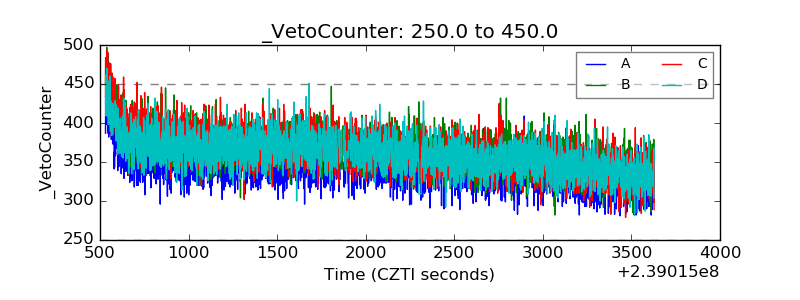 |