| Param | Original file | Final file |
|---|---|---|
| Filename | modeM0/AS1A03_053T01_9000001410_09903cztM0_level2.evt | modeM0/AS1A03_053T01_9000001410_09903cztM0_level2_quad_clean.evt |
| Size (bytes) | 169,251,840 | 18,089,280 |
| Size | 161.4 MB | 17.3 MB |
| Events in quadrant A | 1,268,151 | 97,968 |
| Events in quadrant B | 1,047,576 | 101,496 |
| Events in quadrant C | 1,025,041 | 100,647 |
| Events in quadrant D | 1,637,615 | 92,289 |
| Mode M9 | |||
|---|---|---|---|
| Quadrant | BADHDUFLAG | Total packets | Discarded packets |
| A | 0 | 7 | 0 |
| B | 0 | 7 | 0 |
| C | 0 | 7 | 0 |
| D | 0 | 7 | 0 |
| Mode SS | |||
|---|---|---|---|
| Quadrant | BADHDUFLAG | Total packets | Discarded packets |
| A | 0 | 44 | 0 |
| B | 0 | 44 | 0 |
| C | 0 | 44 | 0 |
| D | 0 | 44 | 0 |
| Mode M0 | |||
|---|---|---|---|
| Quadrant | BADHDUFLAG | Total packets | Discarded packets |
| A | 0 | 5253 | 2 |
| B | 0 | 4562 | 1 |
| C | 0 | 4570 | 1 |
| D | 0 | 6232 | 1 |
| Quadrant | Total seconds | Saturated seconds | Saturation percentage |
|---|---|---|---|
| A | 2138 | 108 | 5.051450% |
| B | 2138 | 76 | 3.554724% |
| C | 2138 | 44 | 2.057998% |
| D | 2138 | 117 | 5.472404% |
Noise dominated data is calculated using 1-second bins in cleaned event files. If a bin has >2000 counts, and if more than 50% of those come from <1% of pixels, then it is considered to be noise-dominated and hence unusable.
| Quadrant | # 1 sec bins | Bins with >0 counts | Bins with >2000 counts | High rate bins dominated by noise | Noise dominated (total time) | Noise dominated (detector-on time) | Marked lightcurve |
|---|---|---|---|---|---|---|---|
| A | 2803 | 2139 | 46 | 46 | 1.64% | 2.15% | 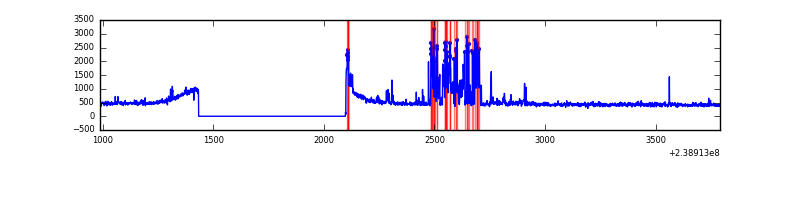 |
| B | 2803 | 2139 | 0 | 0 | 0.00% | 0.00% |  |
| C | 2803 | 2139 | 0 | 0 | 0.00% | 0.00% | 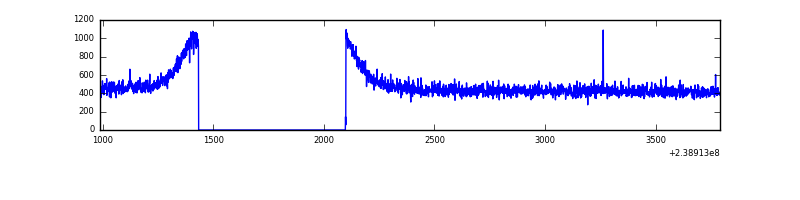 |
| D | 2803 | 2139 | 10 | 10 | 0.36% | 0.47% |  |
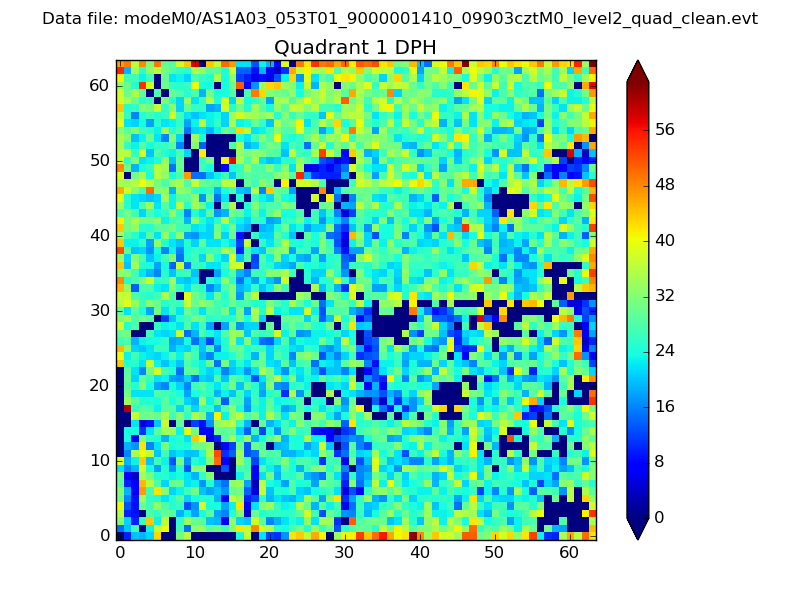
Top three noisy pixels from each quadrant. If the there are fewer than three noisy pixels in the level2.evt file, extra rows are filled as -1
| Pixel properties | Quadrant properties | ||||||
|---|---|---|---|---|---|---|---|
| Quadrant | DetID | PixID | Counts | Sigma | Mean | Median | Sigma |
| A | 15 | 239 | 263898 | 4741.46 | 261 | 254 | 55.6 |
| A | 0 | 226 | 2331 | 37.35 | 261 | 254 | 55.6 |
| A | 12 | 194 | 1996 | 31.33 | 261 | 254 | 55.6 |
| B | 12 | 111 | 6523 | 113.96 | 267 | 260 | 55.0 |
| B | 11 | 111 | 5331 | 92.27 | 267 | 260 | 55.0 |
| B | 4 | 173 | 4777 | 82.19 | 267 | 260 | 55.0 |
| C | 13 | 61 | 1968 | 27.0 | 262 | 263 | 63.2 |
| C | 14 | 234 | 1268 | 15.91 | 262 | 263 | 63.2 |
| C | 14 | 67 | 1160 | 14.2 | 262 | 263 | 63.2 |
| D | 2 | 16 | 449253 | 6568.37 | 252 | 246 | 68.4 |
| D | 8 | 195 | 191183 | 2793.15 | 252 | 246 | 68.4 |
| D | 1 | 52 | 9832 | 140.23 | 252 | 246 | 68.4 |
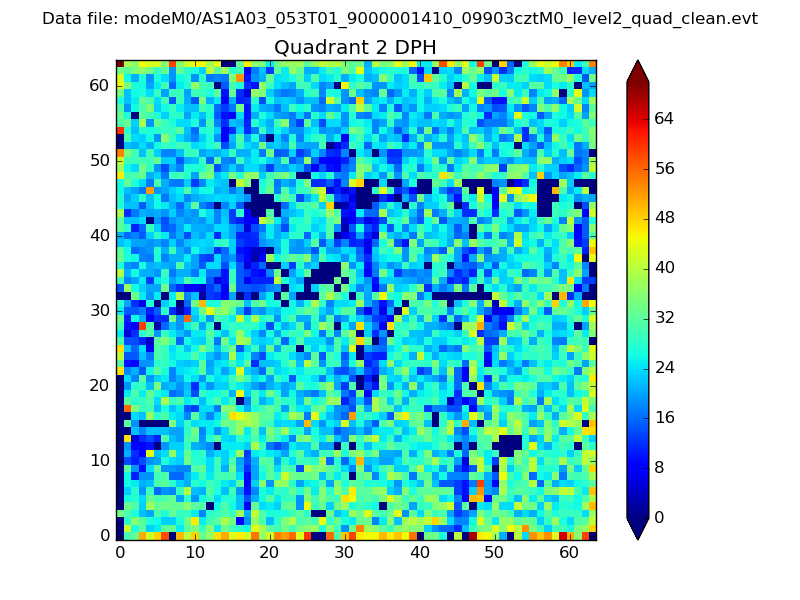
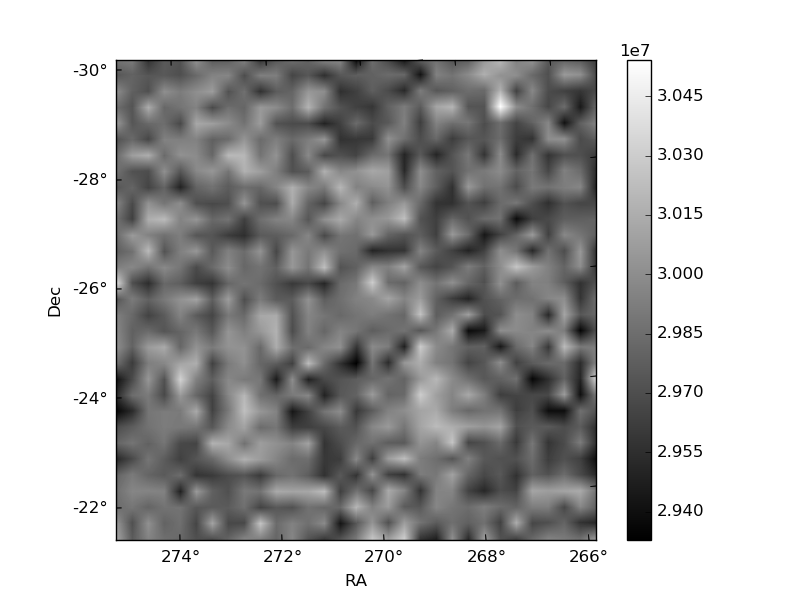
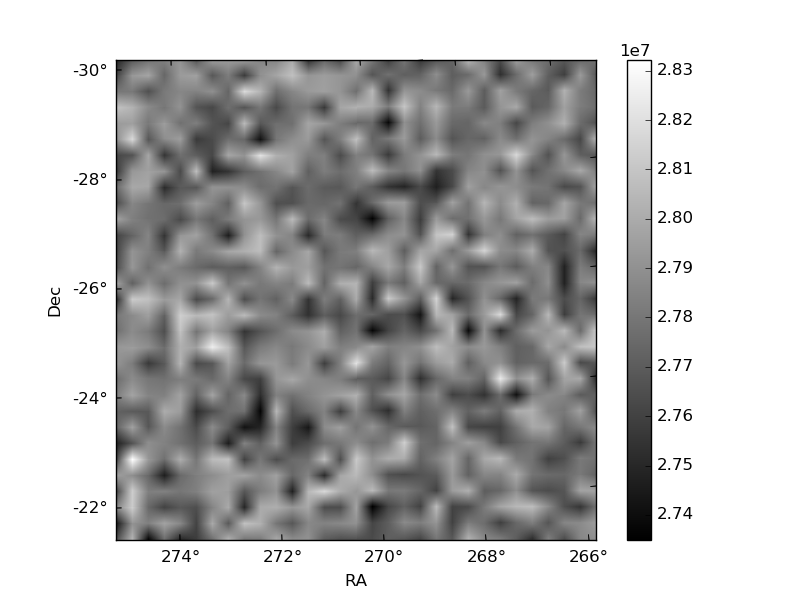
Histogram calculated using DETX and DETY for each event in the final _common_clean file
| Quadrant A | 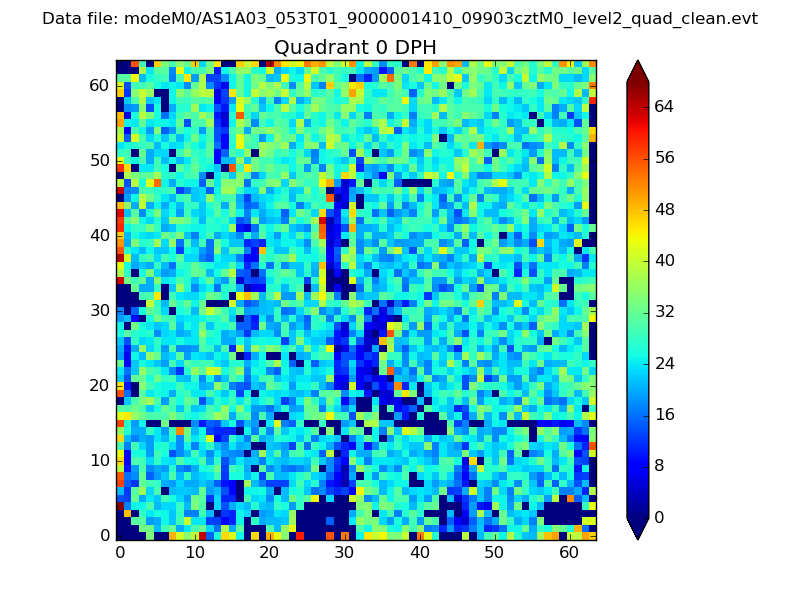 |
 |
Quadrant B |
|---|---|---|---|
| Quadrant D | 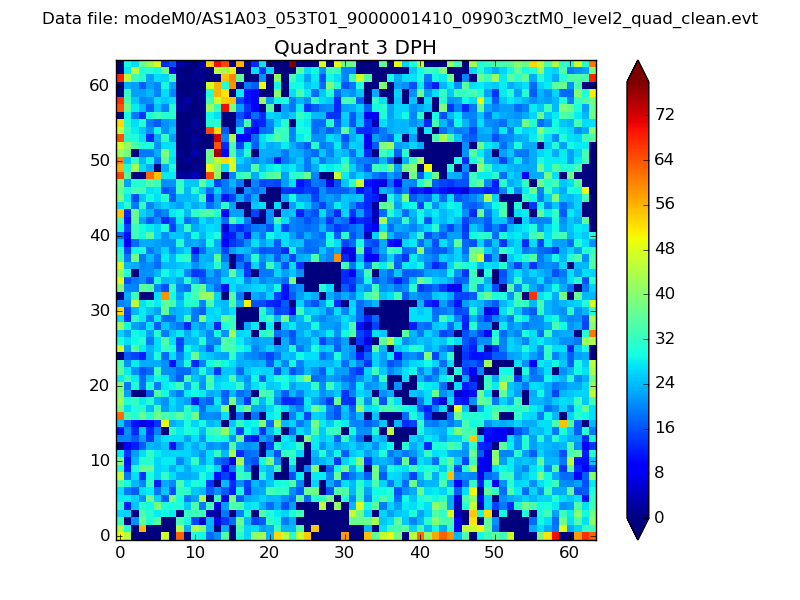 |
 |
Quadrant C |
| Plot type | Count rate plots | Images |
|---|---|---|
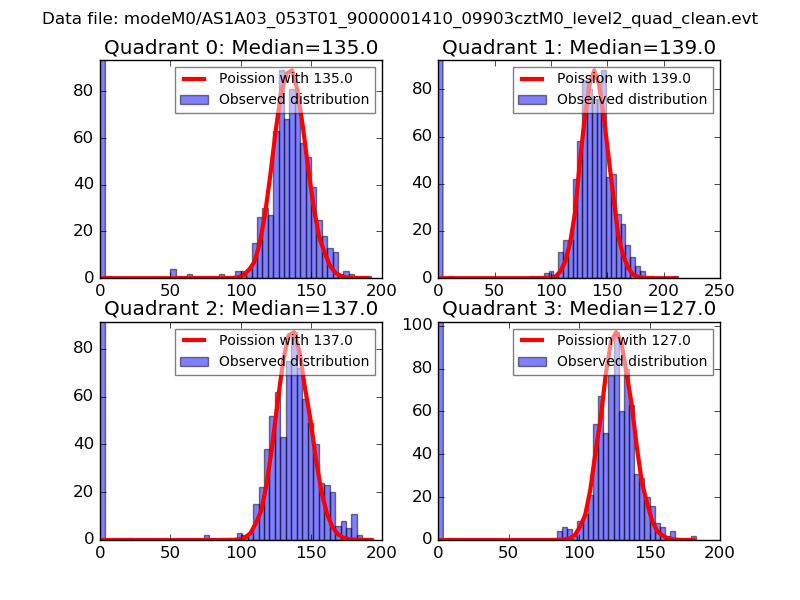
| Comparison with Poisson distribution Blue bars denote a histogram of data divided into 1 sec bins. Red curve is a Poisson curve with rate = median count rate of data. |
 |
 |
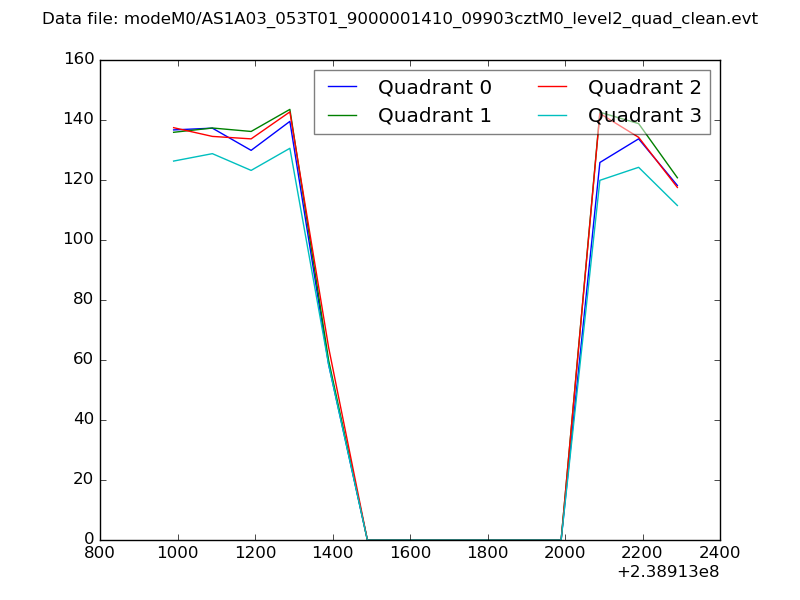
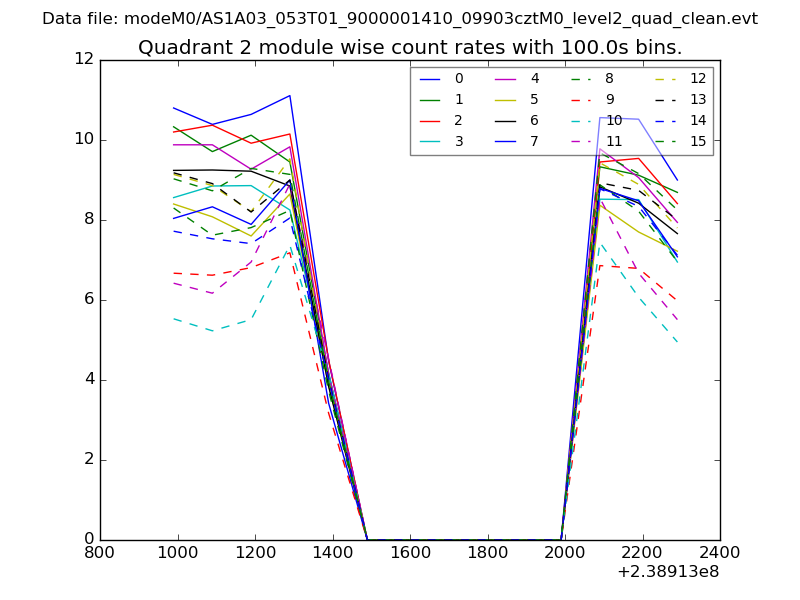
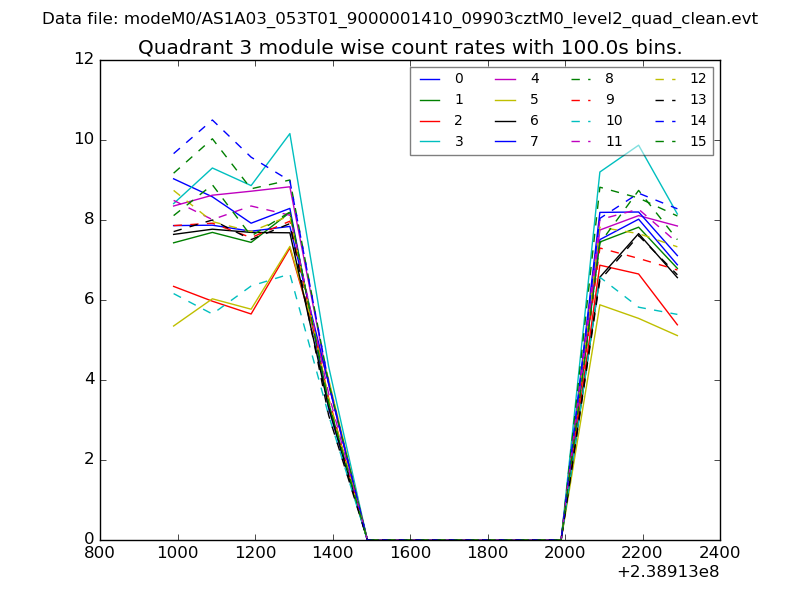
| Quadrant-wise count rates Data is divided into 100 sec bins |
 |
|
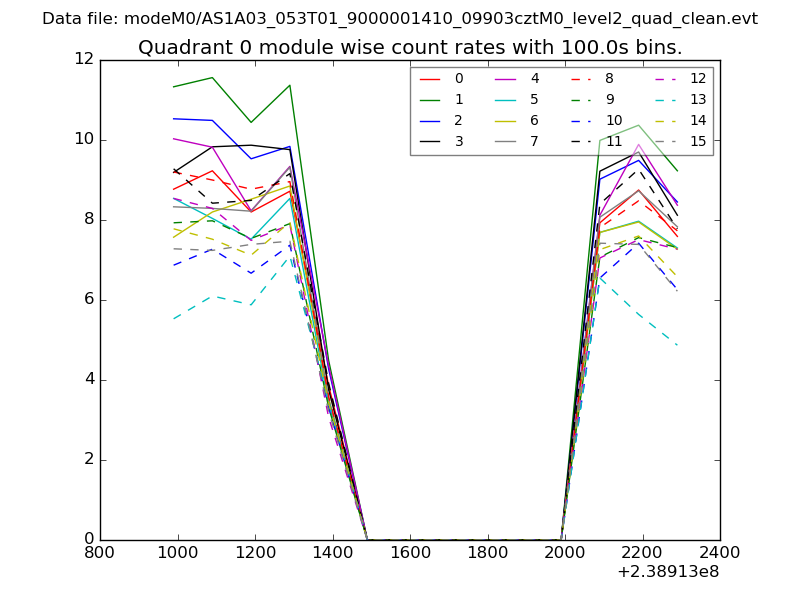
| Module-wise count rates for Quadrant A Data is divided into 100 sec bins |
 |
 |
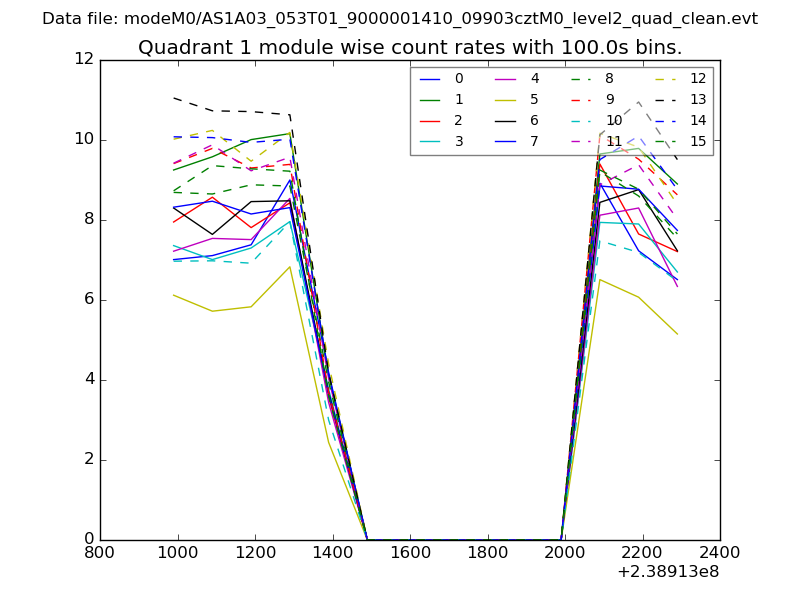
| Module-wise count rates for Quadrant B Data is divided into 100 sec bins |
 |
 |
| Module-wise count rates for Quadrant C Data is divided into 100 sec bins |
 |
 |
| Module-wise count rates for Quadrant D Data is divided into 100 sec bins |
 |
 |
| Parameter | Plot |
|---|---|
| CZT HV Monitor | 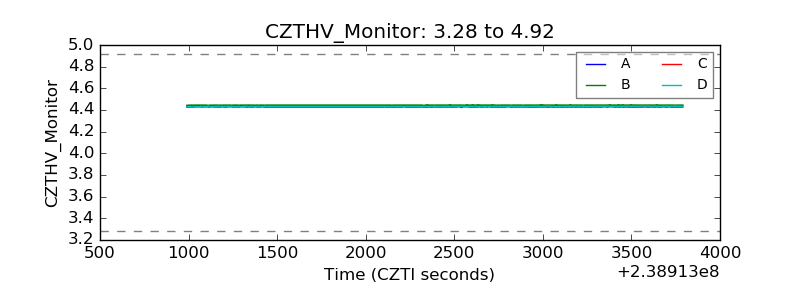 |
| D_VDD | 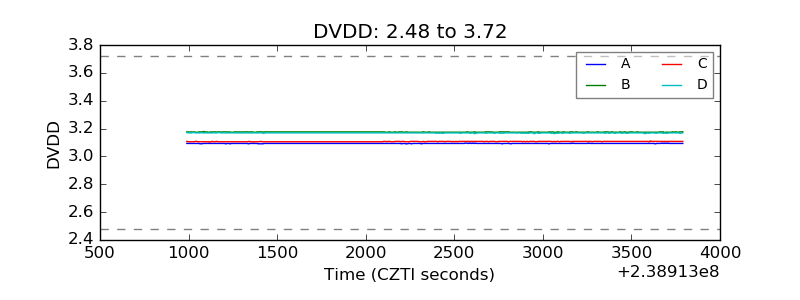 |
| Temperature 1 | 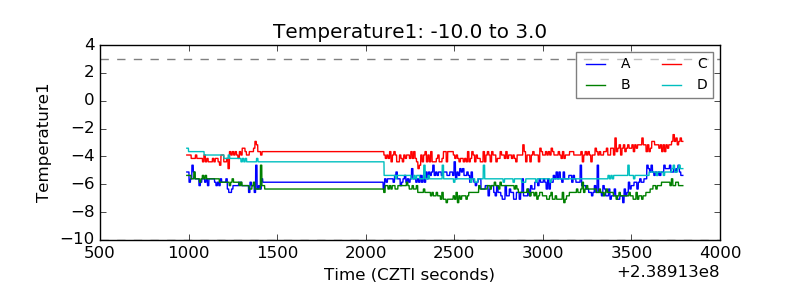 |
| Veto HV Monitor |  |
| Veto LLD | 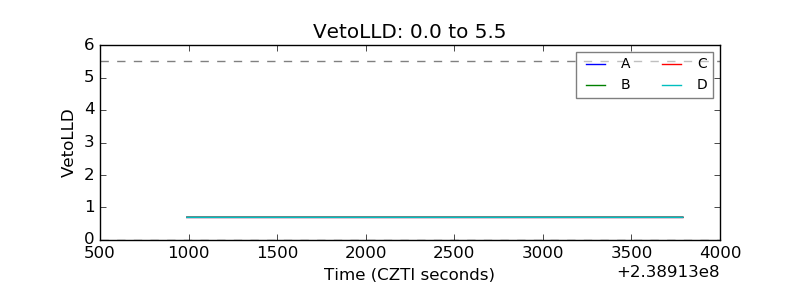 |
| Alpha Counter | 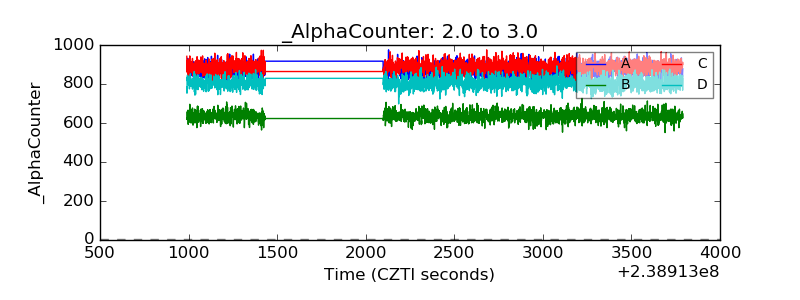 |
| _CPM_Rate | 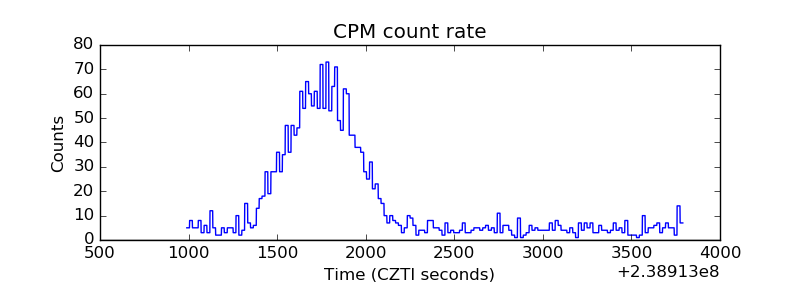 |
| CZT Counter | 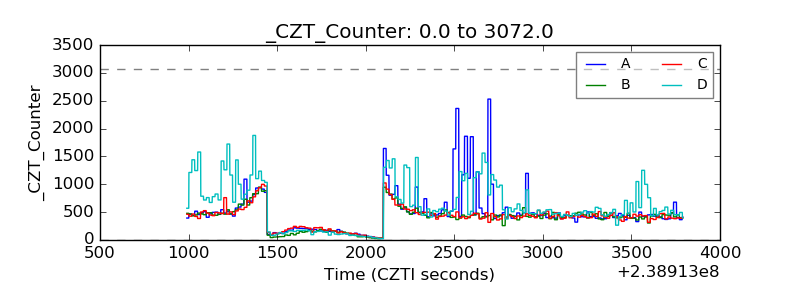 |
| +2.5 Volts monitor |  |
| +5 Volts monitor |  |
| _ROLL_ROT | 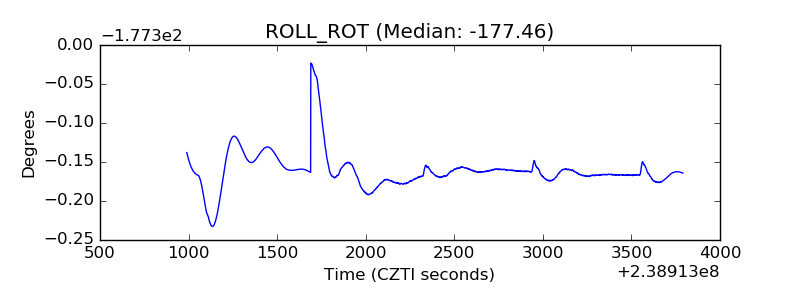 |
| _Roll_DEC |  |
| _Roll_RA | 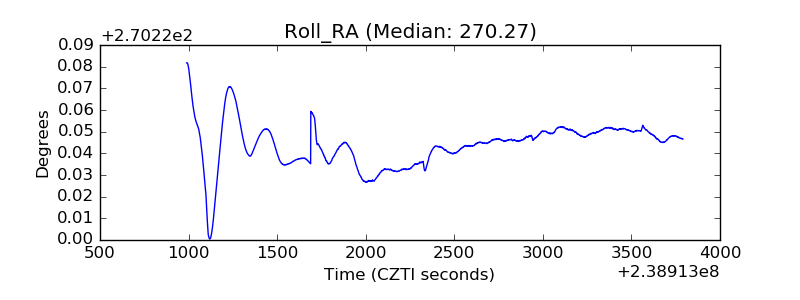 |
| Veto Counter | 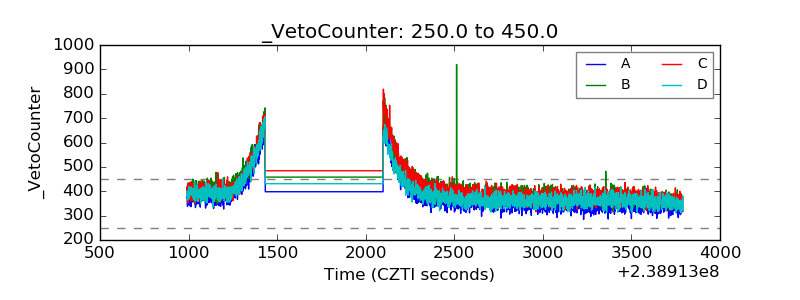 |