| Param | Original file | Final file |
|---|---|---|
| Filename | modeM0/AS1A03_053T01_9000001410_09904cztM0_level2.evt | modeM0/AS1A03_053T01_9000001410_09904cztM0_level2_quad_clean.evt |
| Size (bytes) | 611,305,920 | 82,128,960 |
| Size | 583.0 MB | 78.3 MB |
| Events in quadrant A | 4,486,072 | 486,569 |
| Events in quadrant B | 3,931,501 | 499,749 |
| Events in quadrant C | 3,660,038 | 497,836 |
| Events in quadrant D | 5,906,840 | 459,847 |
| Mode M9 | |||
|---|---|---|---|
| Quadrant | BADHDUFLAG | Total packets | Discarded packets |
| A | 0 | 7 | 0 |
| B | 0 | 7 | 0 |
| C | 0 | 7 | 0 |
| D | 0 | 7 | 0 |
| Mode SS | |||
|---|---|---|---|
| Quadrant | BADHDUFLAG | Total packets | Discarded packets |
| A | 0 | 162 | 2 |
| B | 0 | 162 | 6 |
| C | 0 | 162 | 4 |
| D | 0 | 162 | 6 |
| Mode M0 | |||
|---|---|---|---|
| Quadrant | BADHDUFLAG | Total packets | Discarded packets |
| A | 0 | 19133 | 488 |
| B | 0 | 17401 | 469 |
| C | 0 | 16965 | 484 |
| D | 0 | 23443 | 766 |
| Quadrant | Total seconds | Saturated seconds | Saturation percentage |
|---|---|---|---|
| A | 7810 | 395 | 5.057618% |
| B | 7805 | 316 | 4.048687% |
| C | 7805 | 226 | 2.895580% |
| D | 7770 | 350 | 4.504505% |
Noise dominated data is calculated using 1-second bins in cleaned event files. If a bin has >2000 counts, and if more than 50% of those come from <1% of pixels, then it is considered to be noise-dominated and hence unusable.
| Quadrant | # 1 sec bins | Bins with >0 counts | Bins with >2000 counts | High rate bins dominated by noise | Noise dominated (total time) | Noise dominated (detector-on time) | Marked lightcurve |
|---|---|---|---|---|---|---|---|
| A | 8722 | 7914 | 89 | 89 | 1.02% | 1.12% | 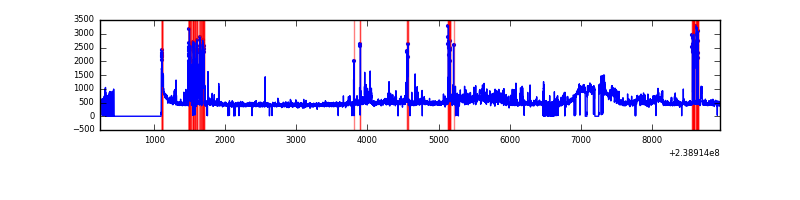 |
| B | 8721 | 7905 | 3 | 3 | 0.03% | 0.04% | 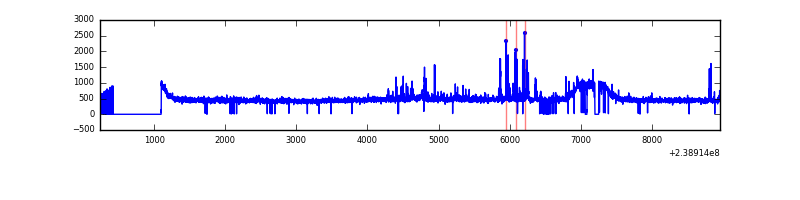 |
| C | 8722 | 7901 | 0 | 0 | 0.00% | 0.00% | 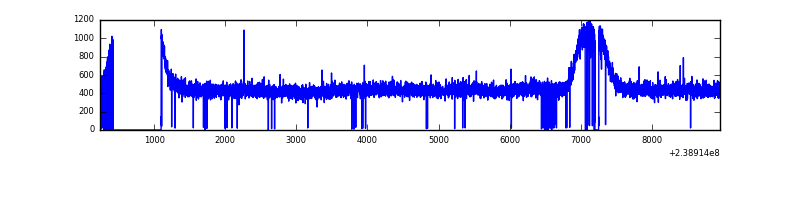 |
| D | 8722 | 7902 | 67 | 67 | 0.77% | 0.85% | 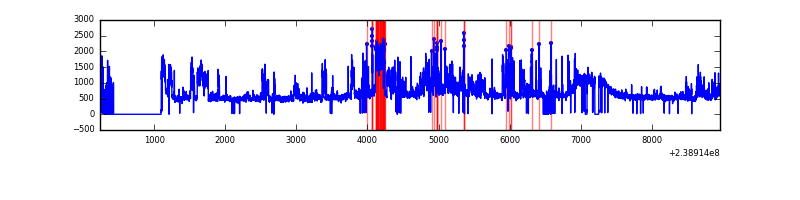 |
Top three noisy pixels from each quadrant. If the there are fewer than three noisy pixels in the level2.evt file, extra rows are filled as -1
| Pixel properties | Quadrant properties | ||||||
|---|---|---|---|---|---|---|---|
| Quadrant | DetID | PixID | Counts | Sigma | Mean | Median | Sigma |
| A | 15 | 239 | 828521 | 4239.49 | 946 | 925 | 195.2 |
| A | 13 | 251 | 14769 | 70.92 | 946 | 925 | 195.2 |
| A | 0 | 226 | 8586 | 39.24 | 946 | 925 | 195.2 |
| B | 4 | 81 | 58680 | 304.19 | 959 | 935 | 189.8 |
| B | 4 | 239 | 58485 | 303.16 | 959 | 935 | 189.8 |
| B | 0 | 214 | 24972 | 126.62 | 959 | 935 | 189.8 |
| C | 13 | 61 | 7080 | 27.76 | 936 | 942 | 221.1 |
| C | 14 | 67 | 5283 | 19.63 | 936 | 942 | 221.1 |
| C | 9 | 221 | 2803 | 8.42 | 936 | 942 | 221.1 |
| D | 2 | 16 | 1310748 | 5669.64 | 913 | 890 | 231.0 |
| D | 8 | 195 | 833513 | 3603.96 | 913 | 890 | 231.0 |
| D | 12 | 233 | 105081 | 450.98 | 913 | 890 | 231.0 |
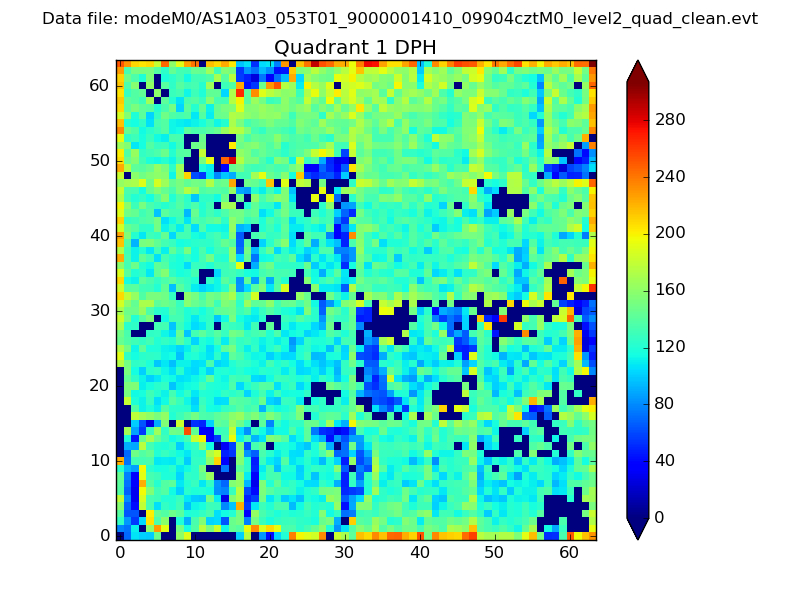
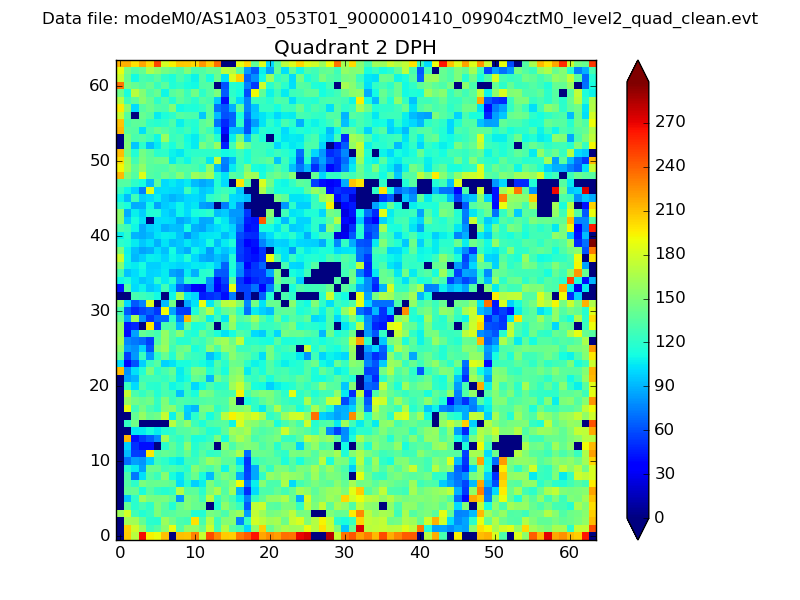
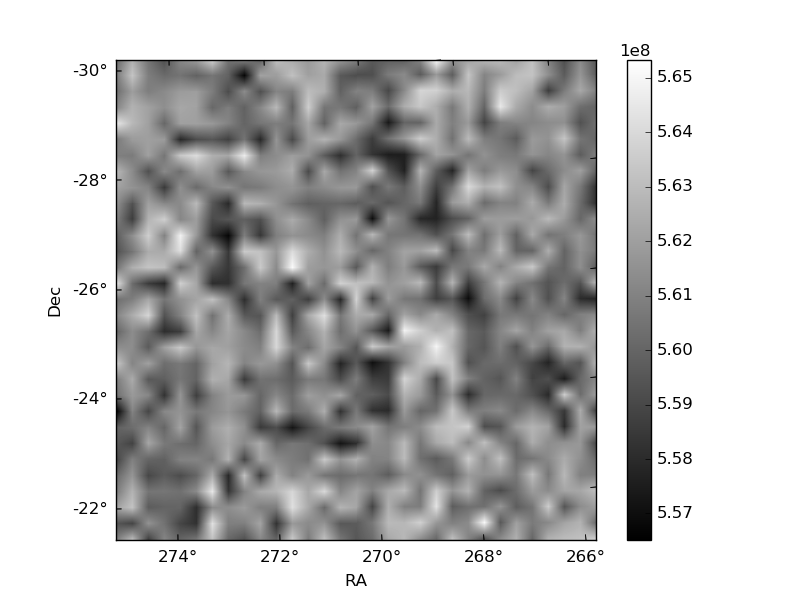
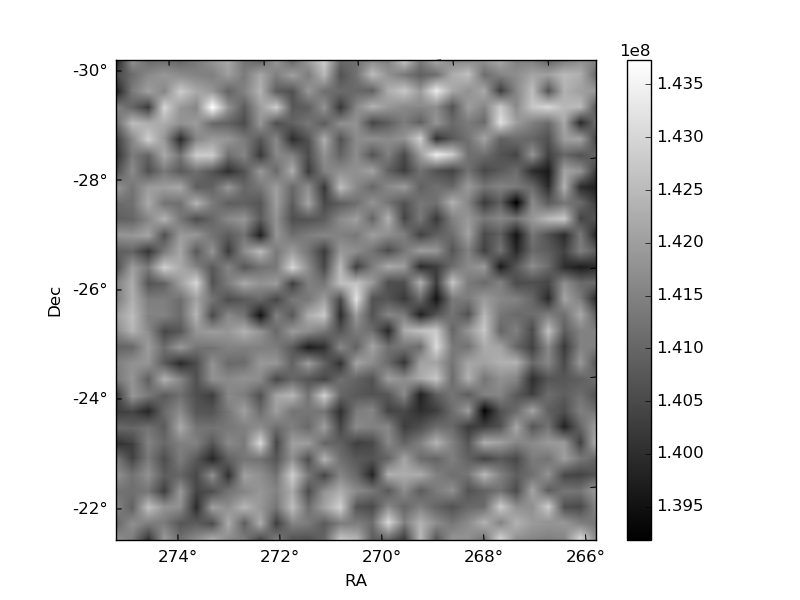
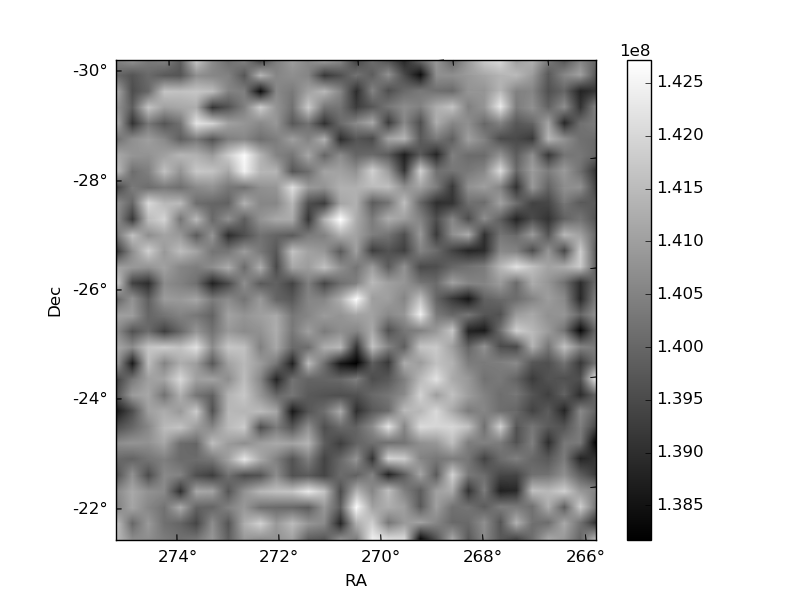
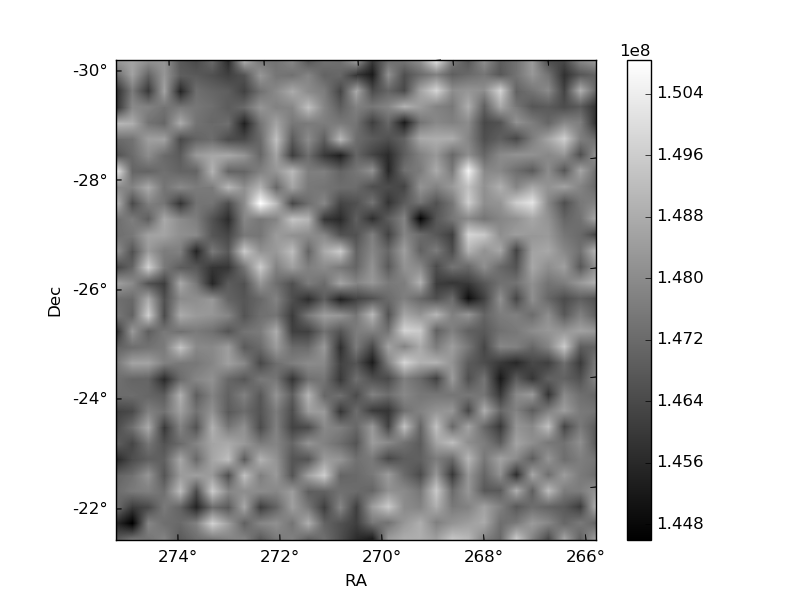
Histogram calculated using DETX and DETY for each event in the final _common_clean file
| Quadrant A |  |
 |
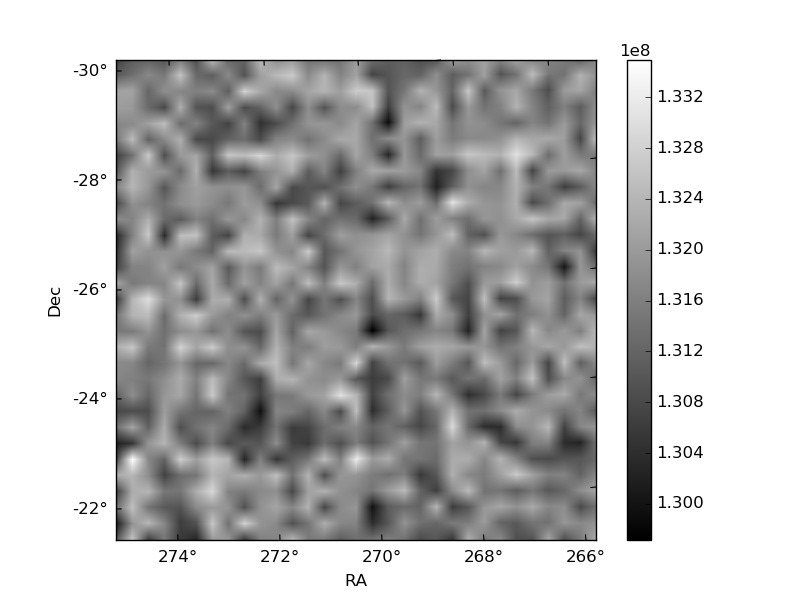
Quadrant B |
|---|---|---|---|
| Quadrant D | 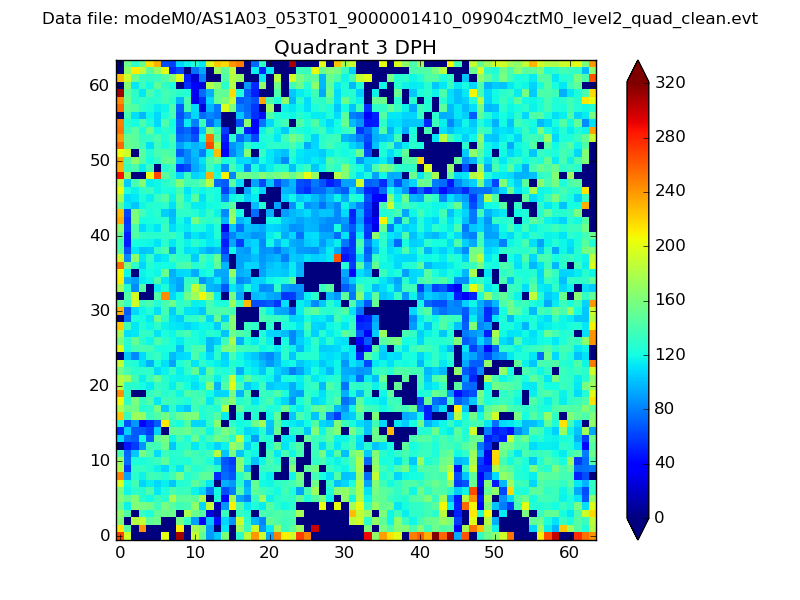 |
 |
Quadrant C |
| Plot type | Count rate plots | Images |
|---|---|---|
| Comparison with Poisson distribution Blue bars denote a histogram of data divided into 1 sec bins. Red curve is a Poisson curve with rate = median count rate of data. |
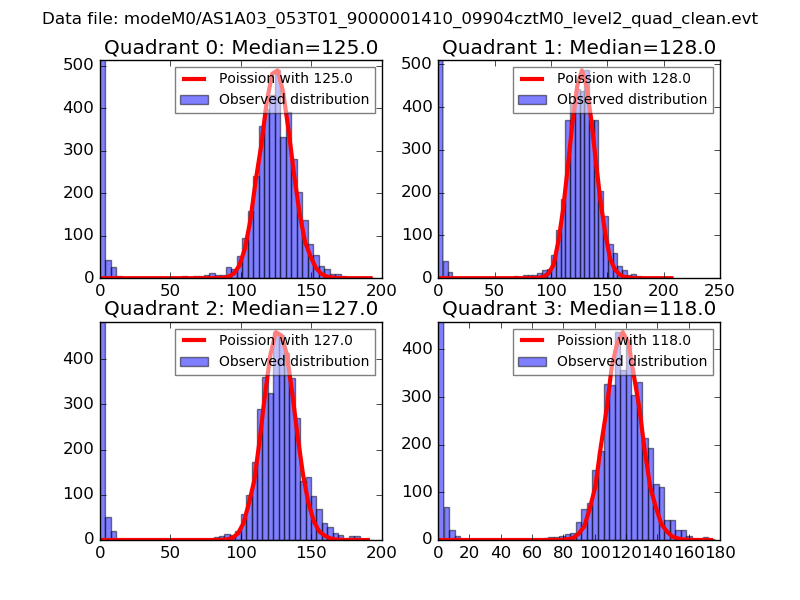 |
 |
| Quadrant-wise count rates Data is divided into 100 sec bins |
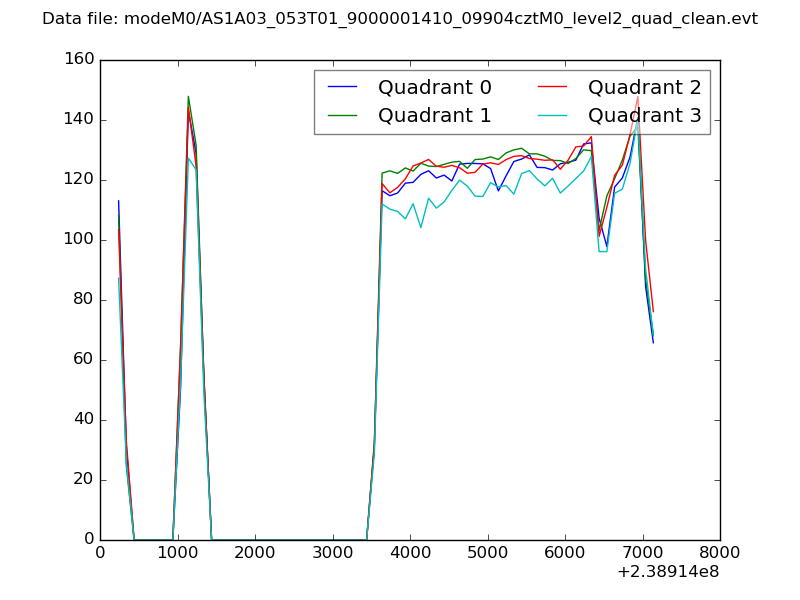 |
|
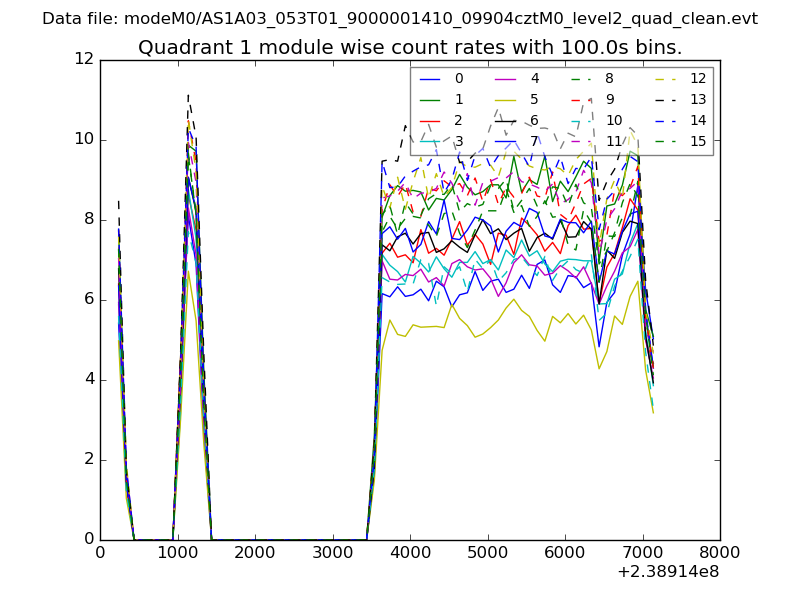
| Module-wise count rates for Quadrant A Data is divided into 100 sec bins |
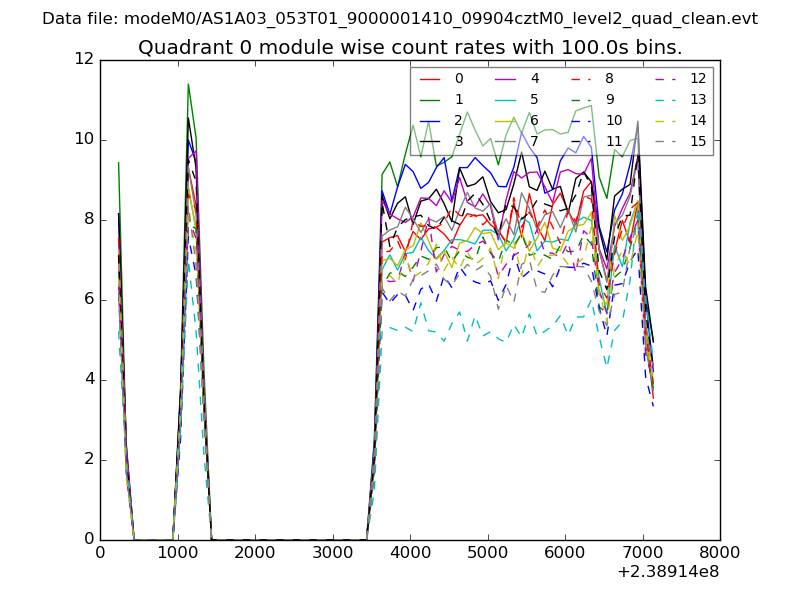 |
 |
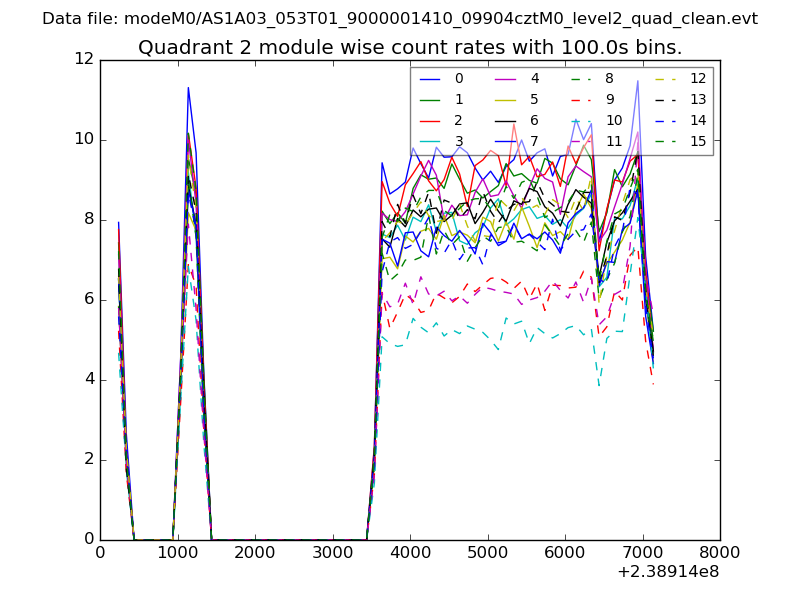
| Module-wise count rates for Quadrant B Data is divided into 100 sec bins |
 |
 |
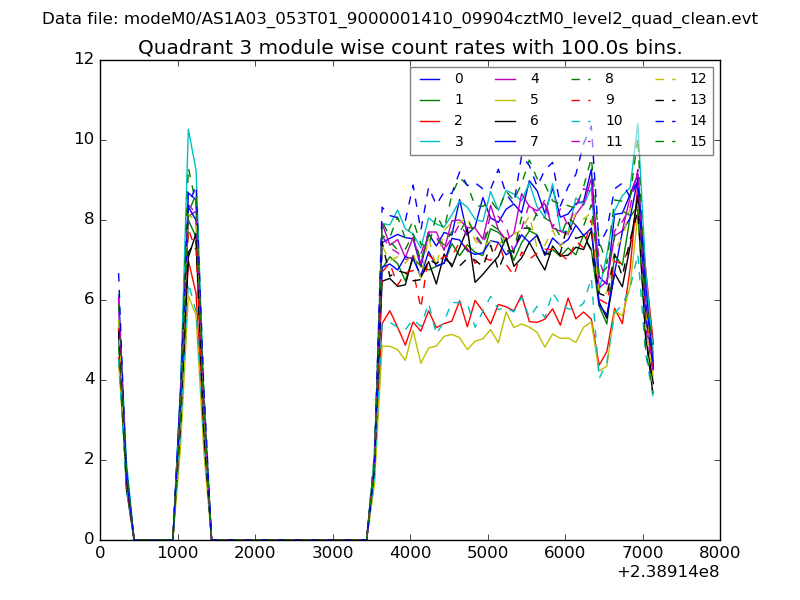
| Module-wise count rates for Quadrant C Data is divided into 100 sec bins |
 |
 |
| Module-wise count rates for Quadrant D Data is divided into 100 sec bins |
 |
 |
| Parameter | Plot |
|---|---|
| CZT HV Monitor | 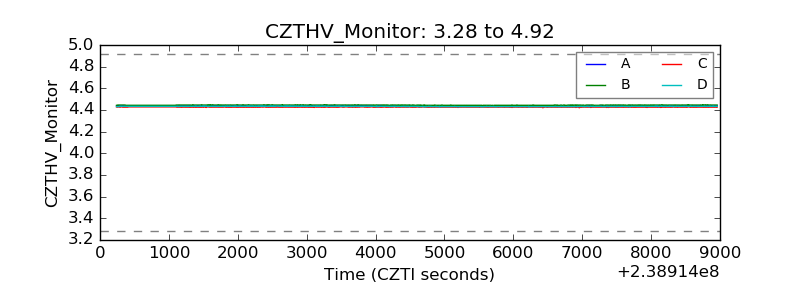 |
| D_VDD | 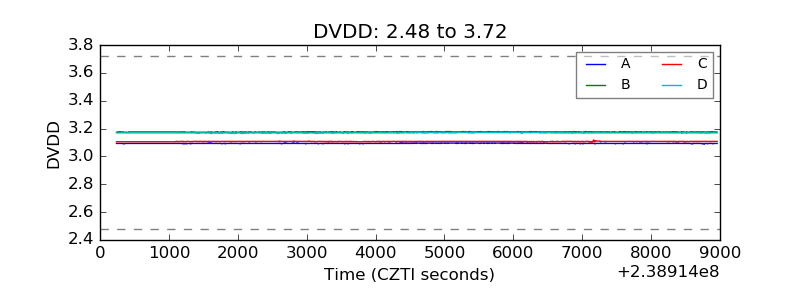 |
| Temperature 1 | 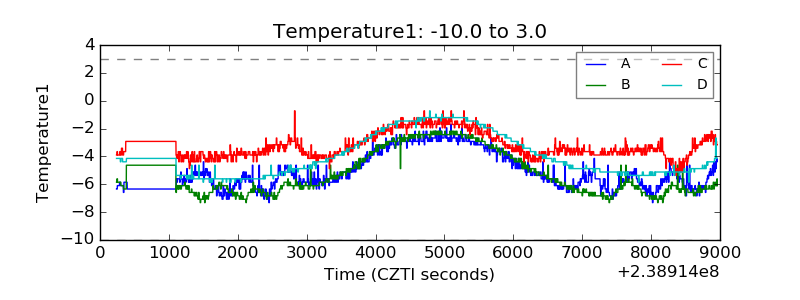 |
| Veto HV Monitor | 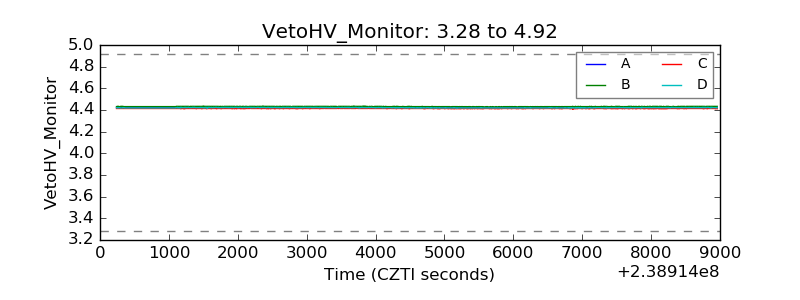 |
| Veto LLD | 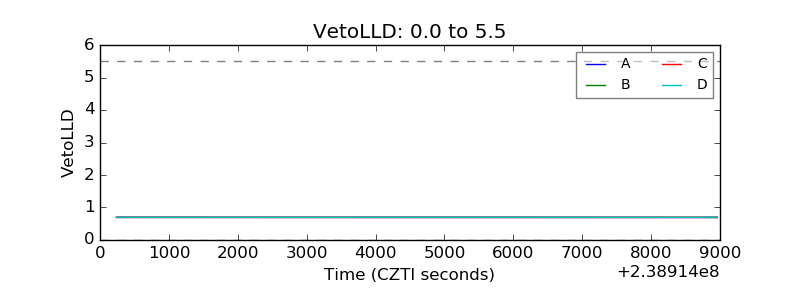 |
| Alpha Counter | 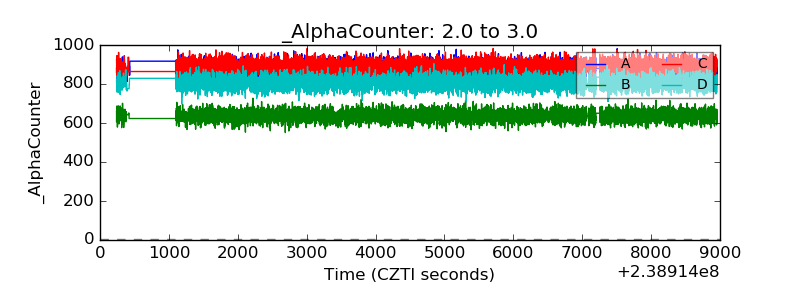 |
| _CPM_Rate | 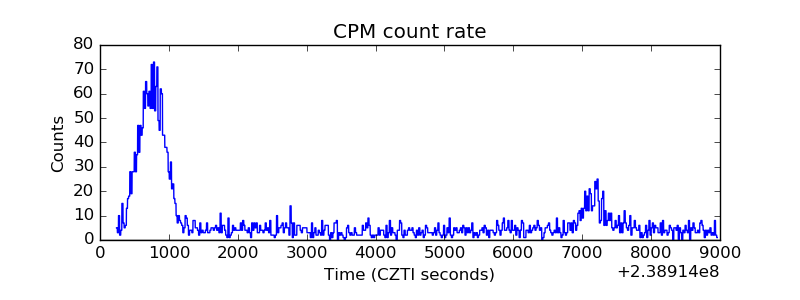 |
| CZT Counter | 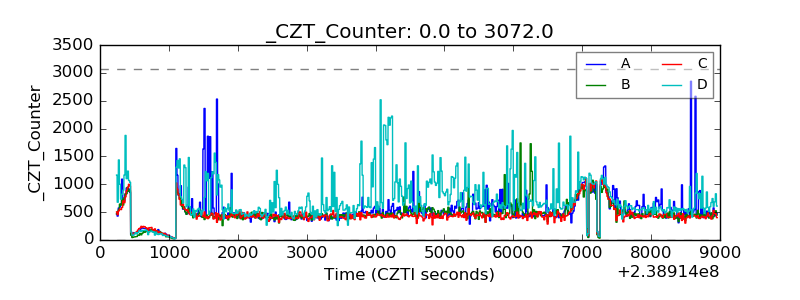 |
| +2.5 Volts monitor |  |
| +5 Volts monitor |  |
| _ROLL_ROT | 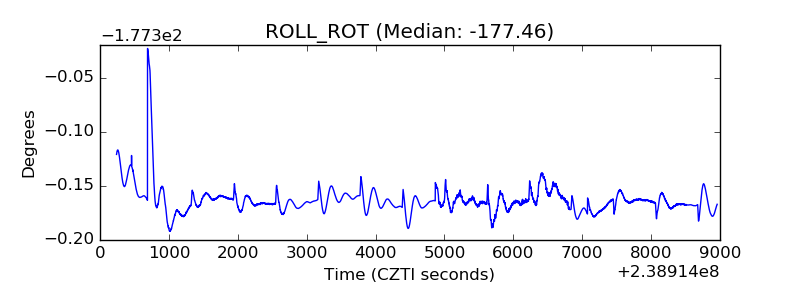 |
| _Roll_DEC | 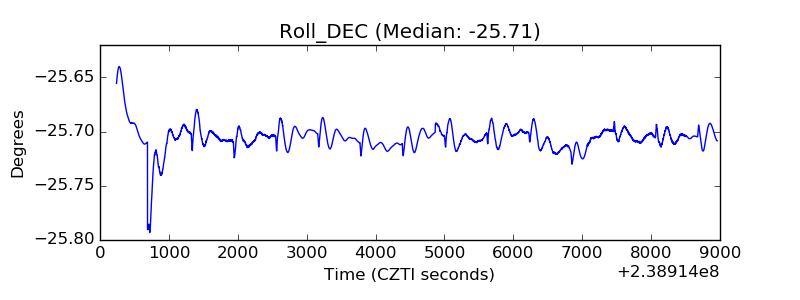 |
| _Roll_RA |  |
| Veto Counter | 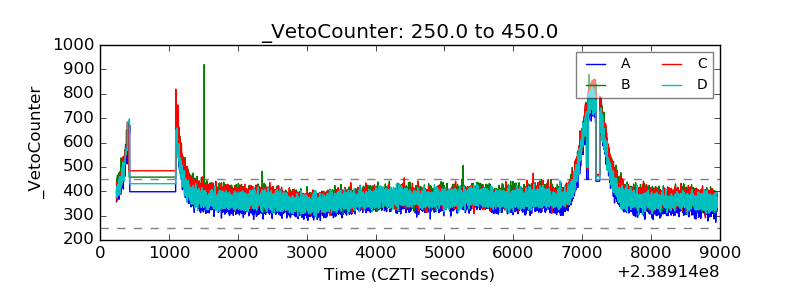 |