| Param | Original file | Final file |
|---|---|---|
| Filename | modeM0/AS1A03_053T01_9000001410_09906cztM0_level2.evt | modeM0/AS1A03_053T01_9000001410_09906cztM0_level2_quad_clean.evt |
| Size (bytes) | 305,879,040 | 49,452,480 |
| Size | 291.7 MB | 47.2 MB |
| Events in quadrant A | 1,935,009 | 311,709 |
| Events in quadrant B | 2,083,315 | 311,479 |
| Events in quadrant C | 1,888,438 | 318,612 |
| Events in quadrant D | 3,073,320 | 263,895 |
| Mode M9 | |||
|---|---|---|---|
| Quadrant | BADHDUFLAG | Total packets | Discarded packets |
| A | 0 | 5 | 3 |
| B | 0 | 5 | 4 |
| C | 0 | 5 | 3 |
| D | 0 | 5 | 3 |
| Mode SS | |||
|---|---|---|---|
| Quadrant | BADHDUFLAG | Total packets | Discarded packets |
| A | 0 | 166 | 84 |
| B | 0 | 169 | 79 |
| C | 0 | 167 | 87 |
| D | 0 | 169 | 81 |
| Mode M0 | |||
|---|---|---|---|
| Quadrant | BADHDUFLAG | Total packets | Discarded packets |
| A | 0 | 17219 | 8598 |
| B | 0 | 17920 | 9053 |
| C | 0 | 16997 | 8343 |
| D | 0 | 24479 | 12831 |
| Quadrant | Total seconds | Saturated seconds | Saturation percentage |
|---|---|---|---|
| A | 4155 | 87 | 2.093863% |
| B | 4151 | 79 | 1.903156% |
| C | 4230 | 50 | 1.182033% |
| D | 3936 | 247 | 6.275407% |
Noise dominated data is calculated using 1-second bins in cleaned event files. If a bin has >2000 counts, and if more than 50% of those come from <1% of pixels, then it is considered to be noise-dominated and hence unusable.
| Quadrant | # 1 sec bins | Bins with >0 counts | Bins with >2000 counts | High rate bins dominated by noise | Noise dominated (total time) | Noise dominated (detector-on time) | Marked lightcurve |
|---|---|---|---|---|---|---|---|
| A | 8623 | 4994 | 9 | 9 | 0.10% | 0.18% | 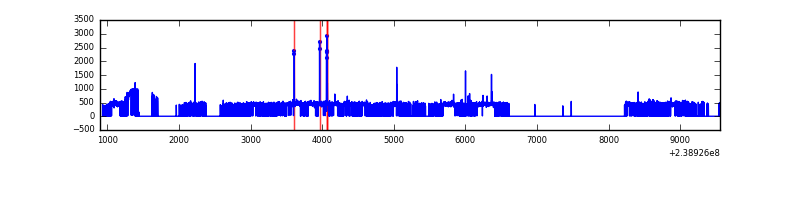 |
| B | 8493 | 5031 | 6 | 6 | 0.07% | 0.12% | 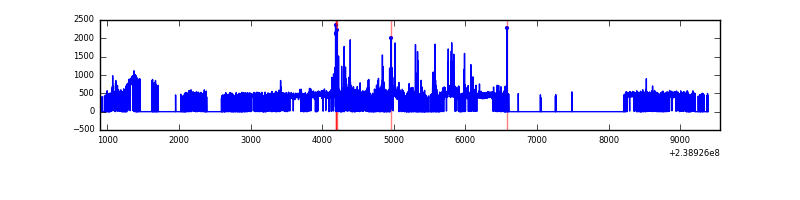 |
| C | 8660 | 5080 | 0 | 0 | 0.00% | 0.00% | 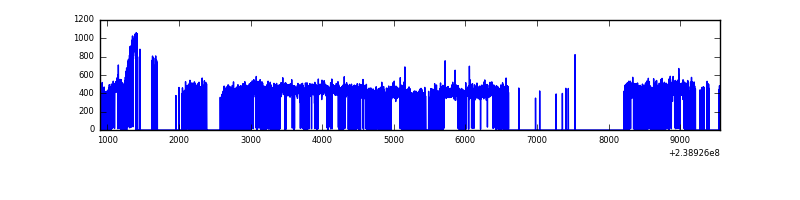 |
| D | 8643 | 4821 | 243 | 243 | 2.81% | 5.04% | 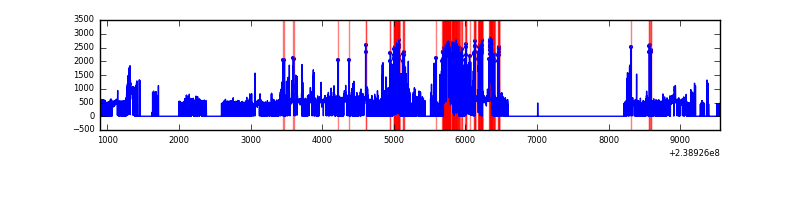 |
Top three noisy pixels from each quadrant. If the there are fewer than three noisy pixels in the level2.evt file, extra rows are filled as -1
| Pixel properties | Quadrant properties | ||||||
|---|---|---|---|---|---|---|---|
| Quadrant | DetID | PixID | Counts | Sigma | Mean | Median | Sigma |
| A | 15 | 174 | 26064 | 252.22 | 486 | 475 | 101.5 |
| A | 15 | 239 | 24271 | 234.54 | 486 | 475 | 101.5 |
| A | 14 | 254 | 6906 | 63.39 | 486 | 475 | 101.5 |
| B | 4 | 81 | 95455 | 979.64 | 487 | 474 | 97.0 |
| B | 0 | 214 | 28967 | 293.88 | 487 | 474 | 97.0 |
| B | 6 | 51 | 17655 | 177.21 | 487 | 474 | 97.0 |
| C | 14 | 67 | 4503 | 35.37 | 482 | 486 | 113.6 |
| C | 13 | 61 | 3466 | 26.24 | 482 | 486 | 113.6 |
| C | 9 | 221 | 1588 | 9.7 | 482 | 486 | 113.6 |
| D | 2 | 16 | 746320 | 6870.59 | 441 | 430 | 108.6 |
| D | 8 | 195 | 357220 | 3286.49 | 441 | 430 | 108.6 |
| D | 1 | 52 | 86742 | 795.04 | 441 | 430 | 108.6 |
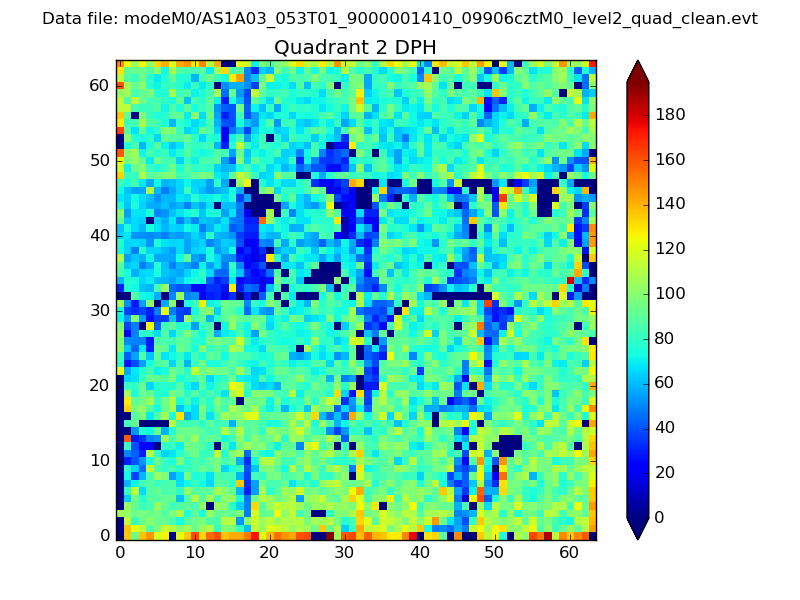
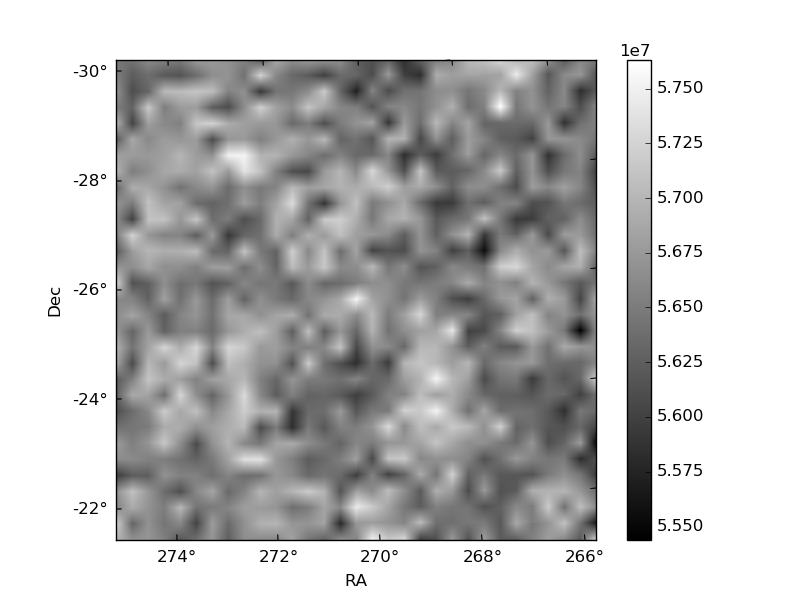
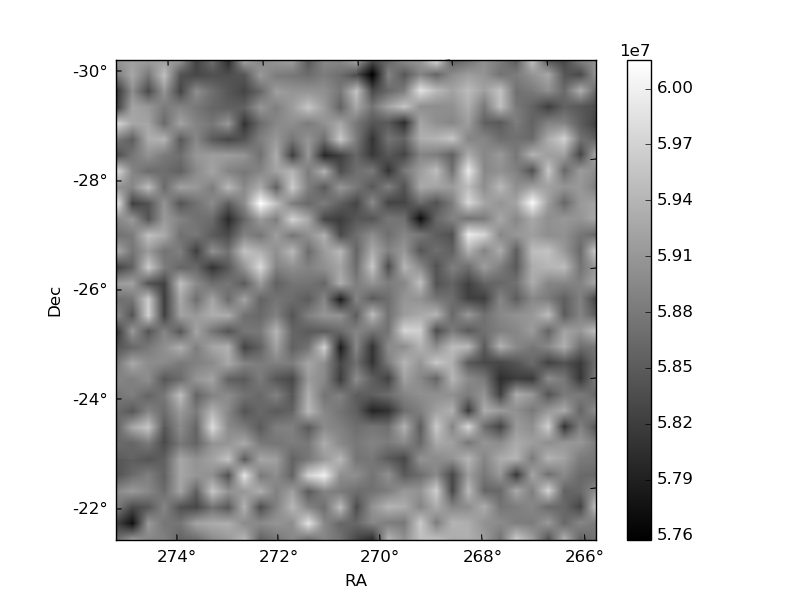
Histogram calculated using DETX and DETY for each event in the final _common_clean file
| Quadrant A | 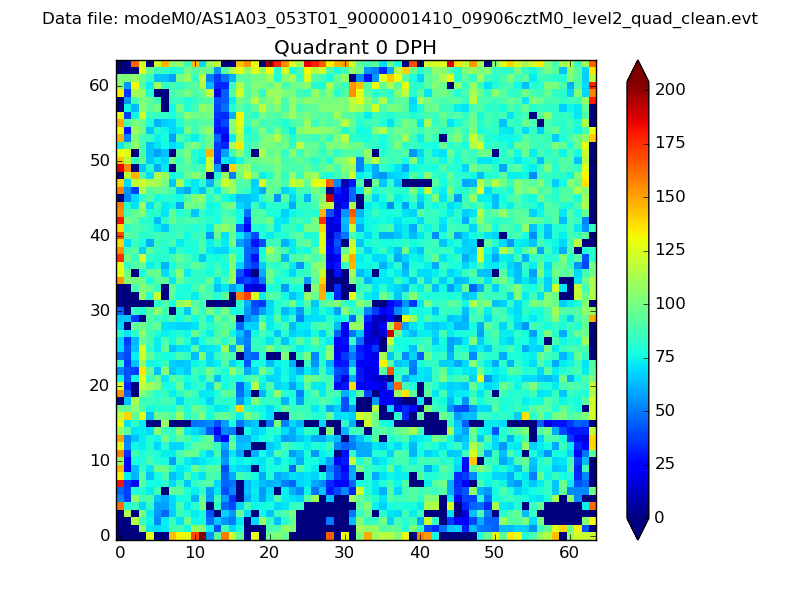 |
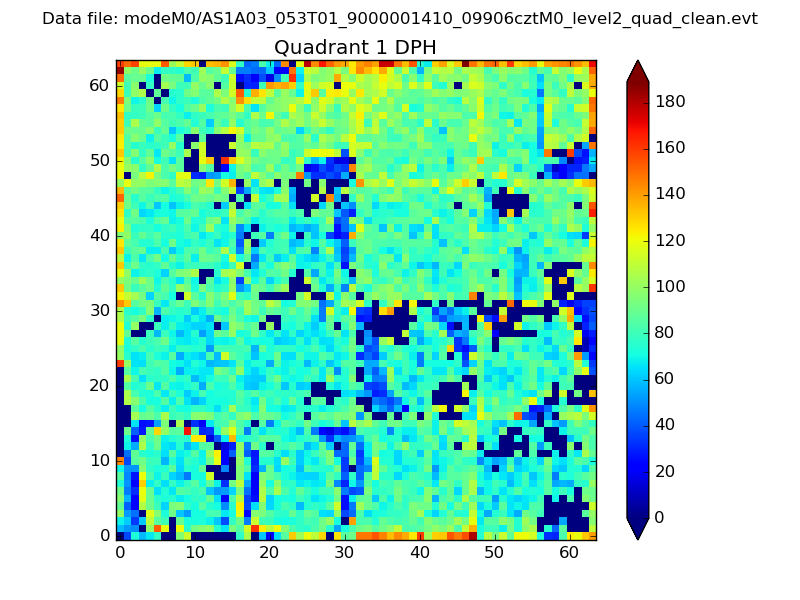 |
Quadrant B |
|---|---|---|---|
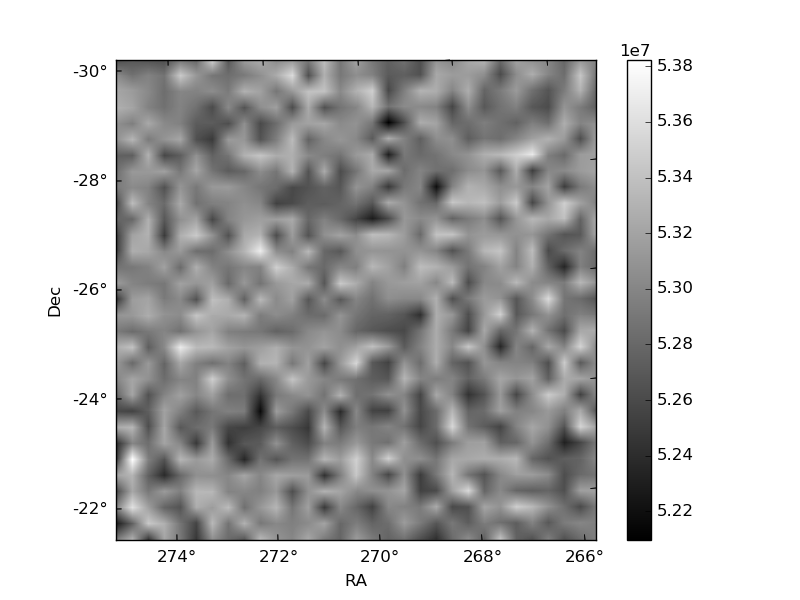
| Quadrant D | 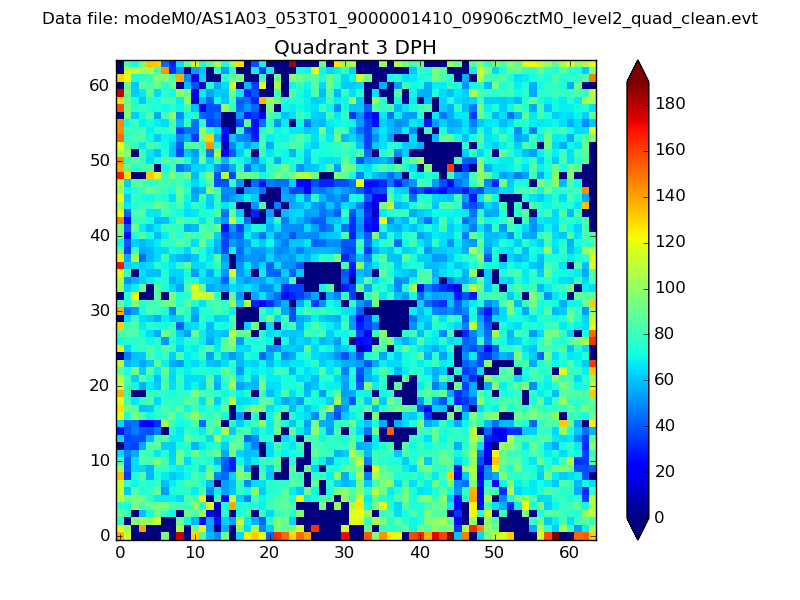 |
 |
Quadrant C |
| Plot type | Count rate plots | Images |
|---|---|---|
| Comparison with Poisson distribution Blue bars denote a histogram of data divided into 1 sec bins. Red curve is a Poisson curve with rate = median count rate of data. |
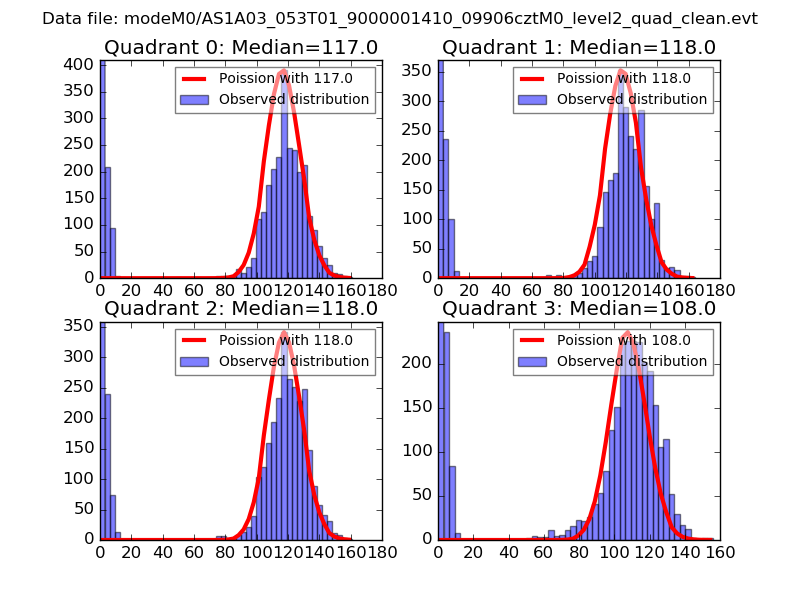 |
 |
| Quadrant-wise count rates Data is divided into 100 sec bins |
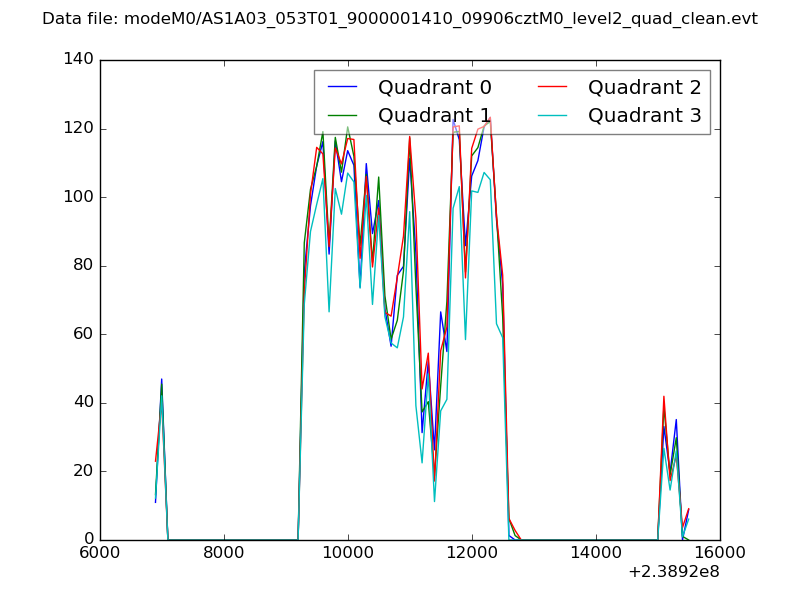 |
|
| Module-wise count rates for Quadrant A Data is divided into 100 sec bins |
 |
 |
| Module-wise count rates for Quadrant B Data is divided into 100 sec bins |
 |
 |
| Module-wise count rates for Quadrant C Data is divided into 100 sec bins |
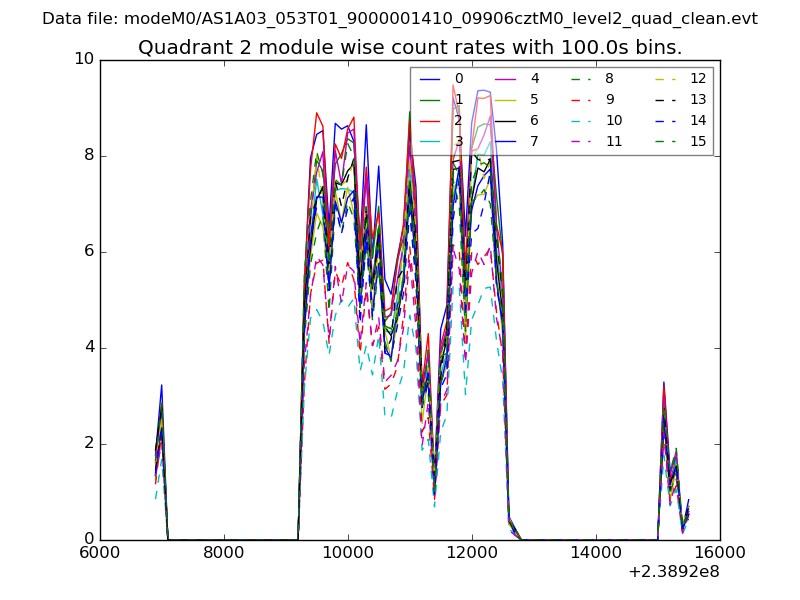 |
 |
| Module-wise count rates for Quadrant D Data is divided into 100 sec bins |
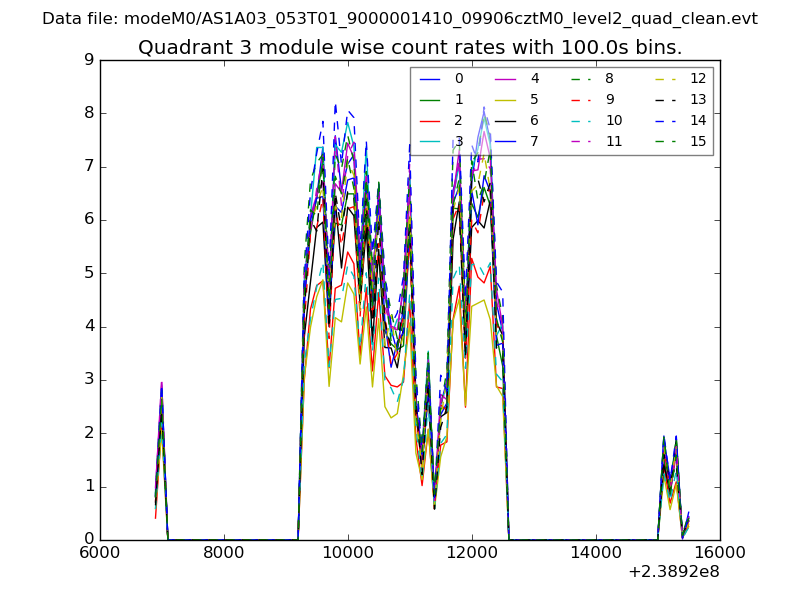 |
 |
| Parameter | Plot |
|---|---|
| CZT HV Monitor | 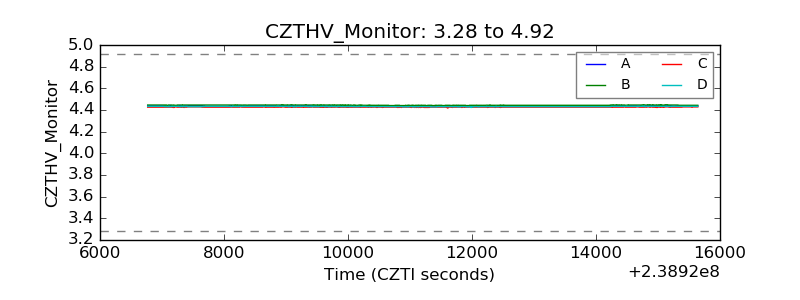 |
| D_VDD |  |
| Temperature 1 |  |
| Veto HV Monitor | 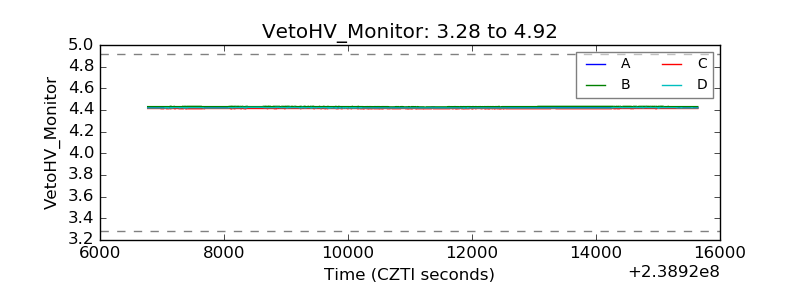 |
| Veto LLD |  |
| Alpha Counter | 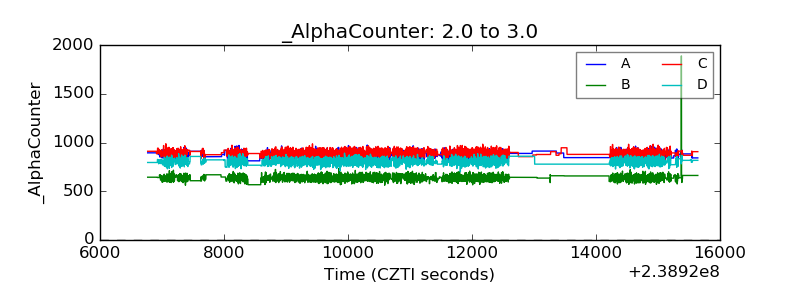 |
| _CPM_Rate | 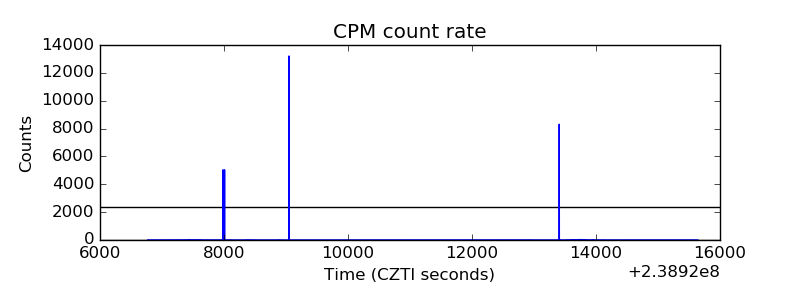 |
| CZT Counter | 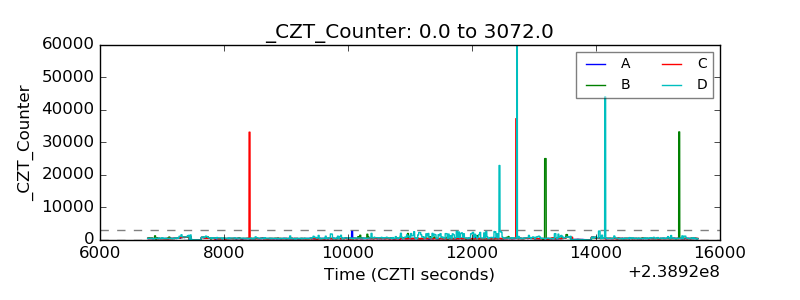 |
| +2.5 Volts monitor |  |
| +5 Volts monitor | 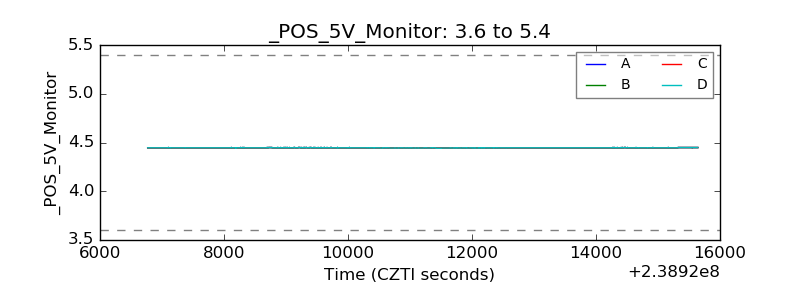 |
| _ROLL_ROT | 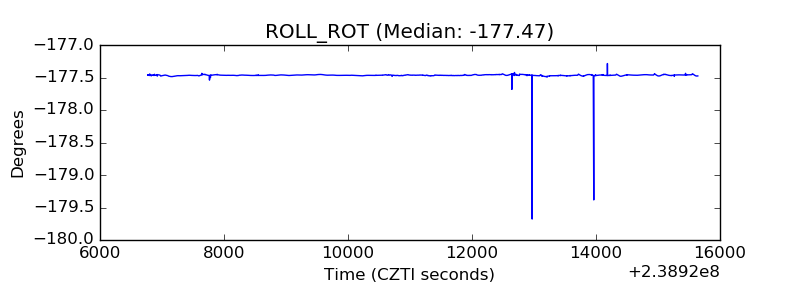 |
| _Roll_DEC | 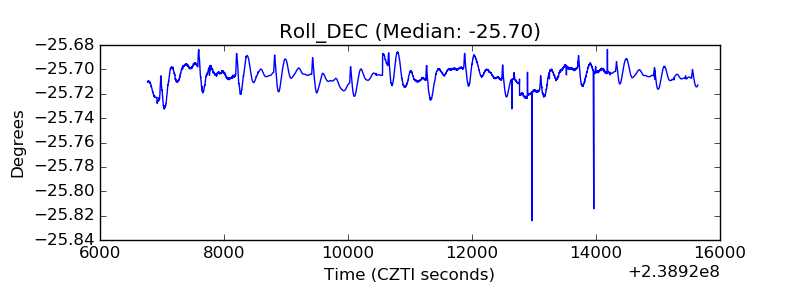 |
| _Roll_RA | 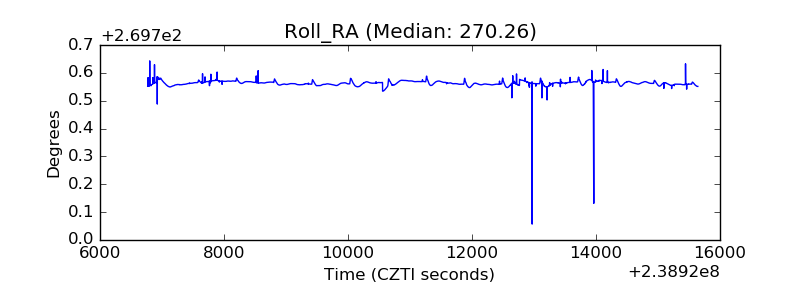 |
| Veto Counter | 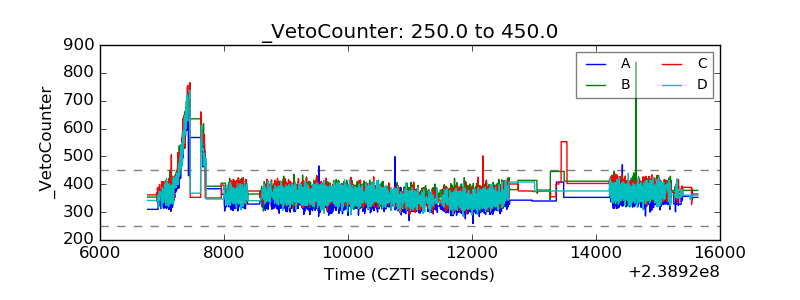 |