| Param | Original file | Final file |
|---|---|---|
| Filename | modeM0/AS1A03_053T01_9000001410_09909cztM0_level2.evt | modeM0/AS1A03_053T01_9000001410_09909cztM0_level2_quad_clean.evt |
| Size (bytes) | 673,738,560 | 106,084,800 |
| Size | 642.5 MB | 101.2 MB |
| Events in quadrant A | 4,906,174 | 661,339 |
| Events in quadrant B | 4,499,333 | 676,664 |
| Events in quadrant C | 3,865,935 | 669,530 |
| Events in quadrant D | 6,561,568 | 619,130 |
| Mode M9 | |||
|---|---|---|---|
| Quadrant | BADHDUFLAG | Total packets | Discarded packets |
| A | 0 | 16 | 0 |
| B | 0 | 16 | 0 |
| C | 0 | 16 | 0 |
| D | 0 | 16 | 0 |
| Mode SS | |||
|---|---|---|---|
| Quadrant | BADHDUFLAG | Total packets | Discarded packets |
| A | 0 | 172 | 0 |
| B | 0 | 172 | 0 |
| C | 0 | 172 | 0 |
| D | 0 | 172 | 0 |
| Mode M0 | |||
|---|---|---|---|
| Quadrant | BADHDUFLAG | Total packets | Discarded packets |
| A | 0 | 20066 | 22 |
| B | 0 | 18893 | 9 |
| C | 0 | 17257 | 12 |
| D | 0 | 25566 | 29 |
| Quadrant | Total seconds | Saturated seconds | Saturation percentage |
|---|---|---|---|
| A | 8440 | 214 | 2.535545% |
| B | 8442 | 186 | 2.203269% |
| C | 8440 | 92 | 1.090047% |
| D | 8436 | 449 | 5.322428% |
Noise dominated data is calculated using 1-second bins in cleaned event files. If a bin has >2000 counts, and if more than 50% of those come from <1% of pixels, then it is considered to be noise-dominated and hence unusable.
| Quadrant | # 1 sec bins | Bins with >0 counts | Bins with >2000 counts | High rate bins dominated by noise | Noise dominated (total time) | Noise dominated (detector-on time) | Marked lightcurve |
|---|---|---|---|---|---|---|---|
| A | 10050 | 8447 | 72 | 72 | 0.72% | 0.85% | 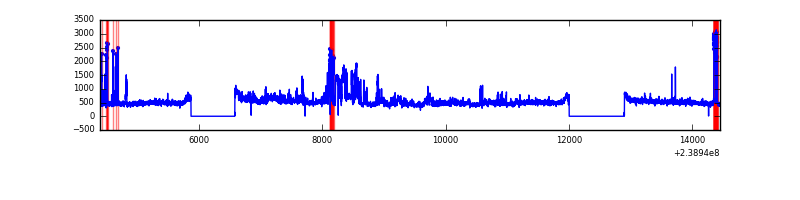 |
| B | 10050 | 8447 | 29 | 29 | 0.29% | 0.34% | 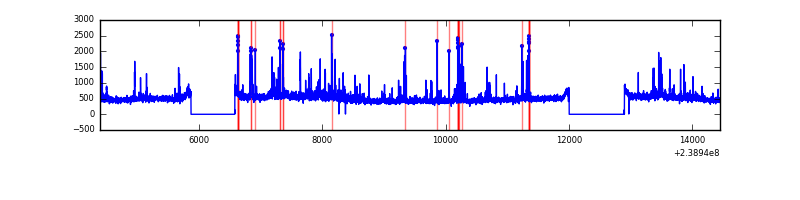 |
| C | 10050 | 8447 | 0 | 0 | 0.00% | 0.00% | 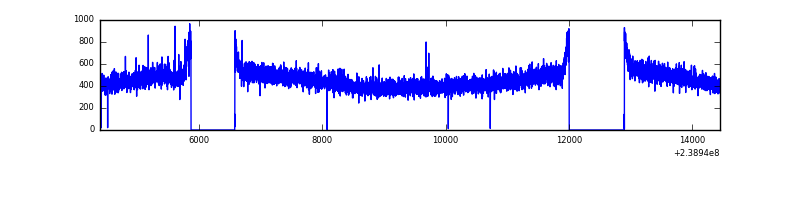 |
| D | 10050 | 8447 | 328 | 328 | 3.26% | 3.88% | 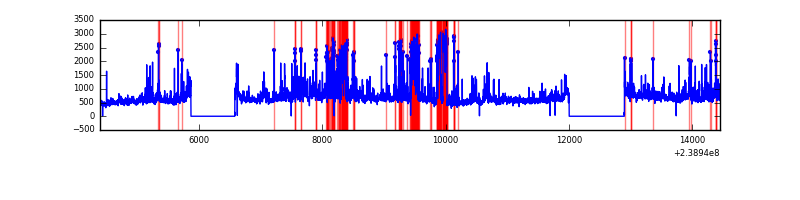 |
Top three noisy pixels from each quadrant. If the there are fewer than three noisy pixels in the level2.evt file, extra rows are filled as -1
| Pixel properties | Quadrant properties | ||||||
|---|---|---|---|---|---|---|---|
| Quadrant | DetID | PixID | Counts | Sigma | Mean | Median | Sigma |
| A | 15 | 239 | 976520 | 4723.6 | 1013 | 992 | 206.5 |
| A | 13 | 251 | 14703 | 66.39 | 1013 | 992 | 206.5 |
| A | 0 | 226 | 9490 | 41.15 | 1013 | 992 | 206.5 |
| B | 4 | 81 | 241086 | 1224.51 | 1020 | 995 | 196.1 |
| B | 0 | 214 | 117579 | 594.6 | 1020 | 995 | 196.1 |
| B | 4 | 239 | 60806 | 305.05 | 1020 | 995 | 196.1 |
| C | 13 | 61 | 7519 | 28.36 | 988 | 990 | 230.2 |
| C | 14 | 67 | 5902 | 21.34 | 988 | 990 | 230.2 |
| C | 12 | 4 | 5781 | 20.81 | 988 | 990 | 230.2 |
| D | 1 | 52 | 1071249 | 4406.57 | 970 | 944 | 242.9 |
| D | 8 | 195 | 931079 | 3829.48 | 970 | 944 | 242.9 |
| D | 2 | 152 | 262333 | 1076.17 | 970 | 944 | 242.9 |
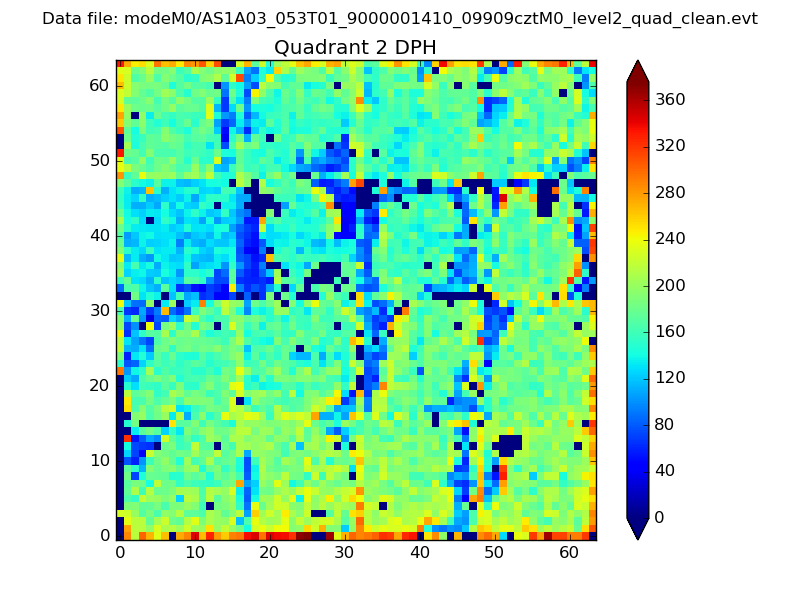
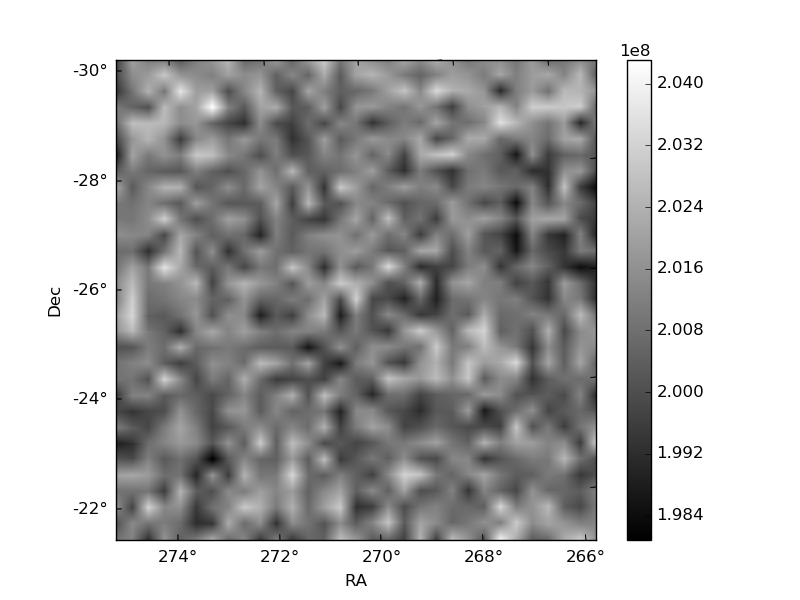
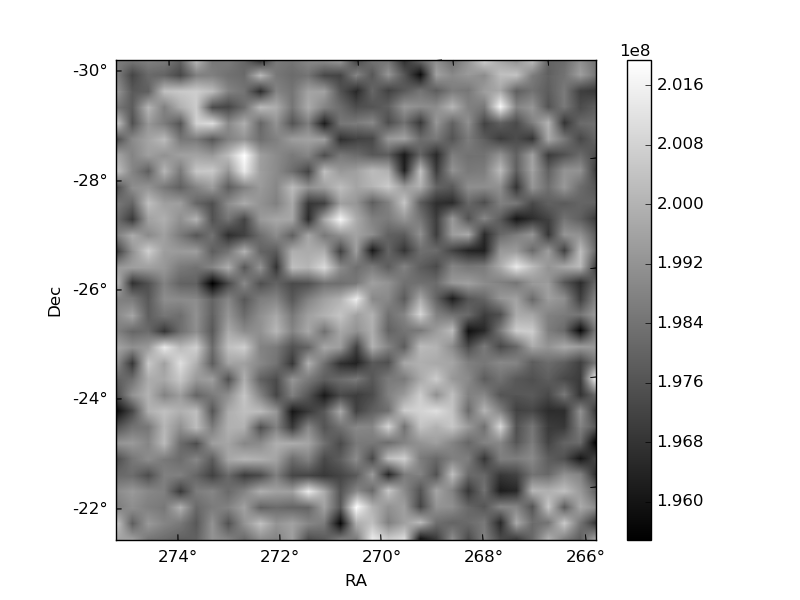
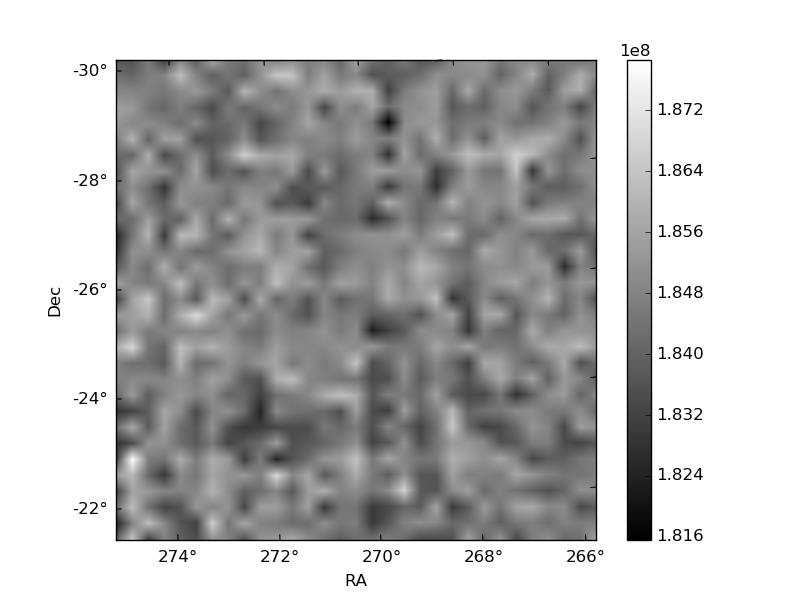
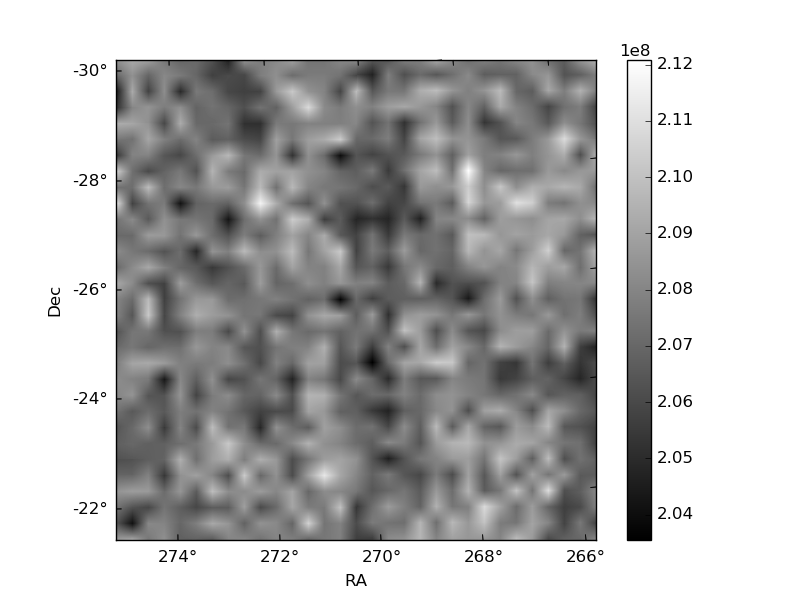
Histogram calculated using DETX and DETY for each event in the final _common_clean file
| Quadrant A | 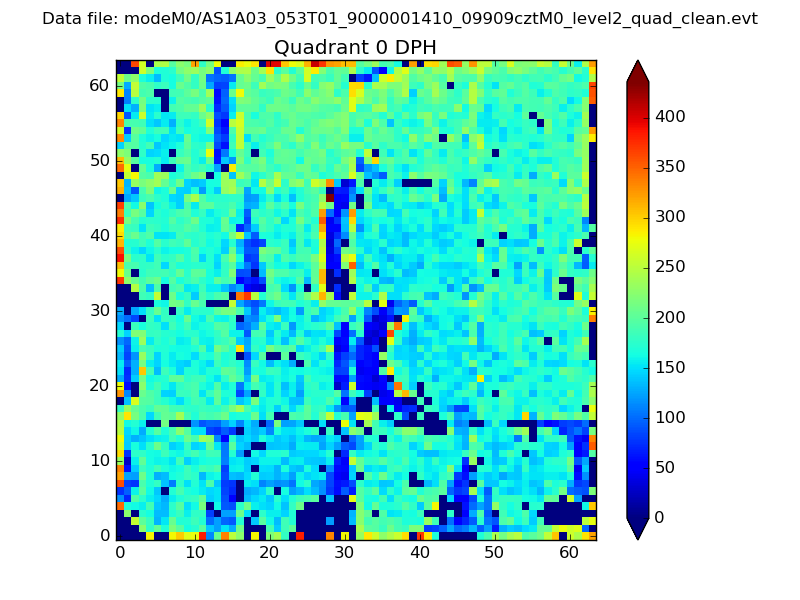 |
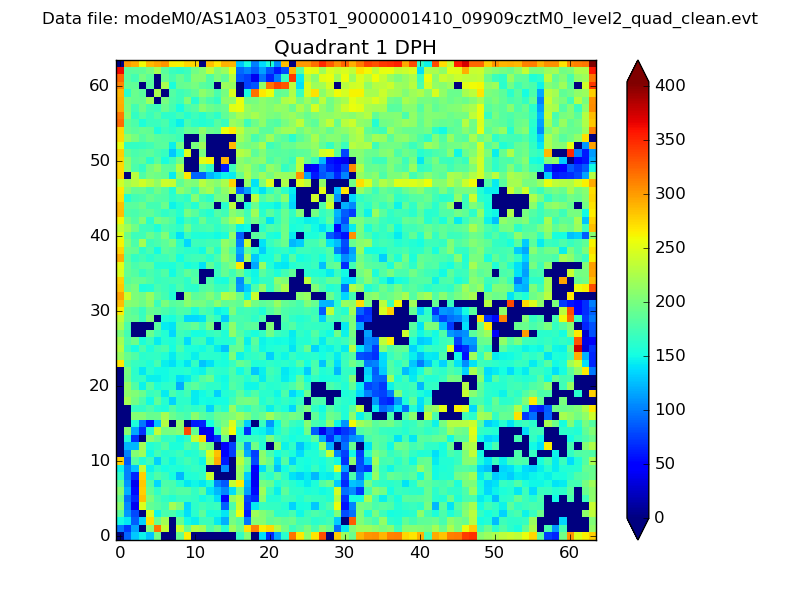 |
Quadrant B |
|---|---|---|---|
| Quadrant D | 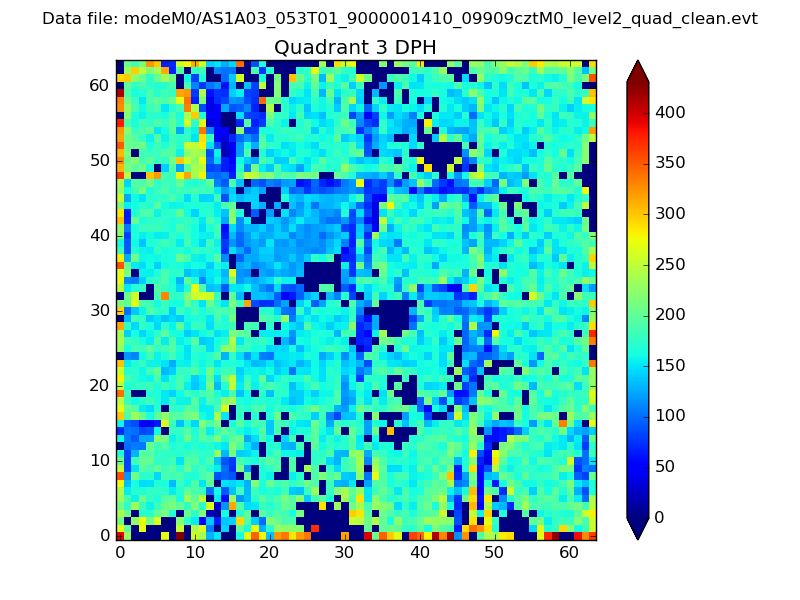 |
 |
Quadrant C |
| Plot type | Count rate plots | Images |
|---|---|---|
| Comparison with Poisson distribution Blue bars denote a histogram of data divided into 1 sec bins. Red curve is a Poisson curve with rate = median count rate of data. |
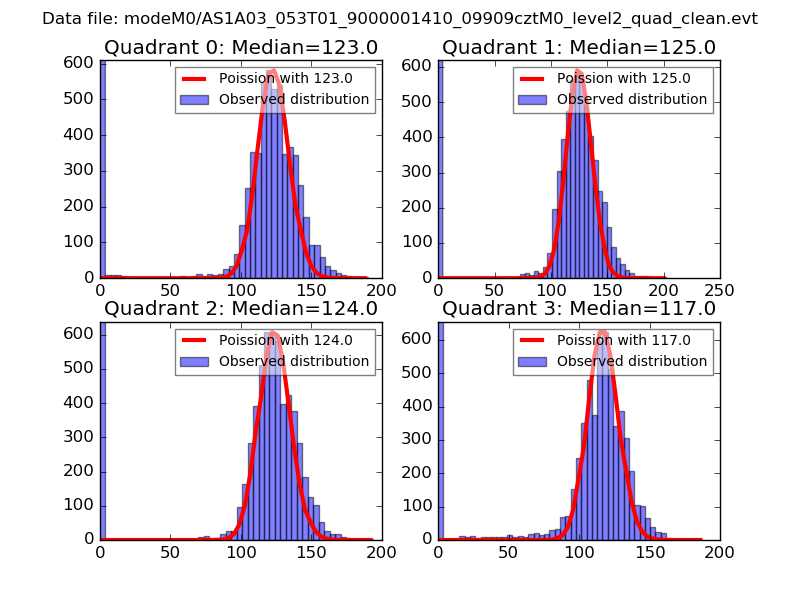 |
 |
| Quadrant-wise count rates Data is divided into 100 sec bins |
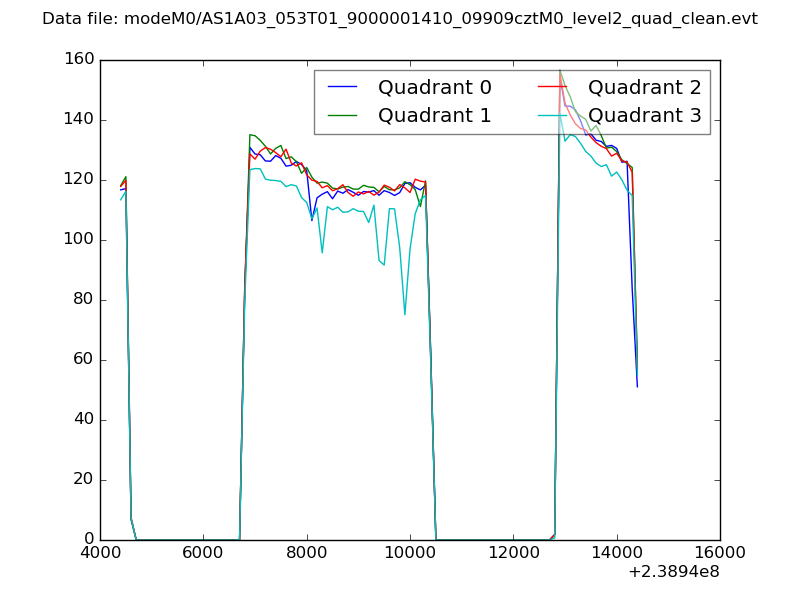 |
|
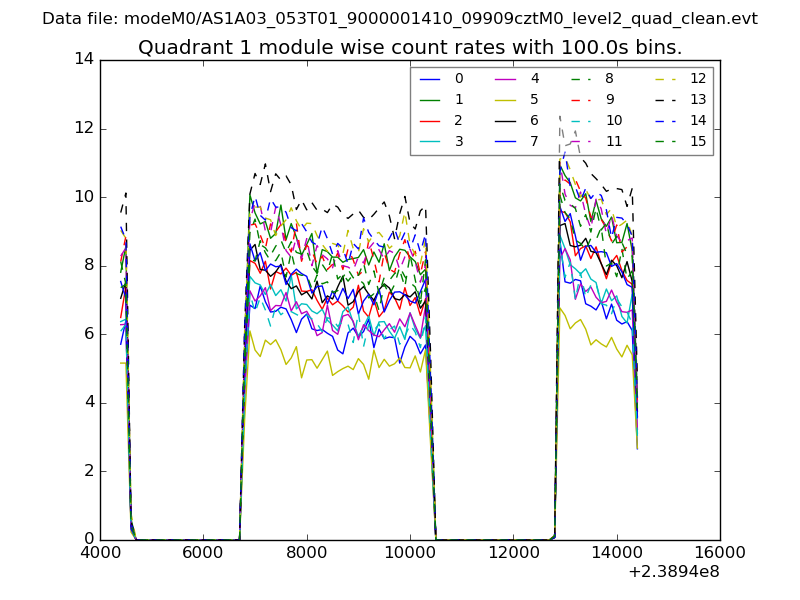
| Module-wise count rates for Quadrant A Data is divided into 100 sec bins |
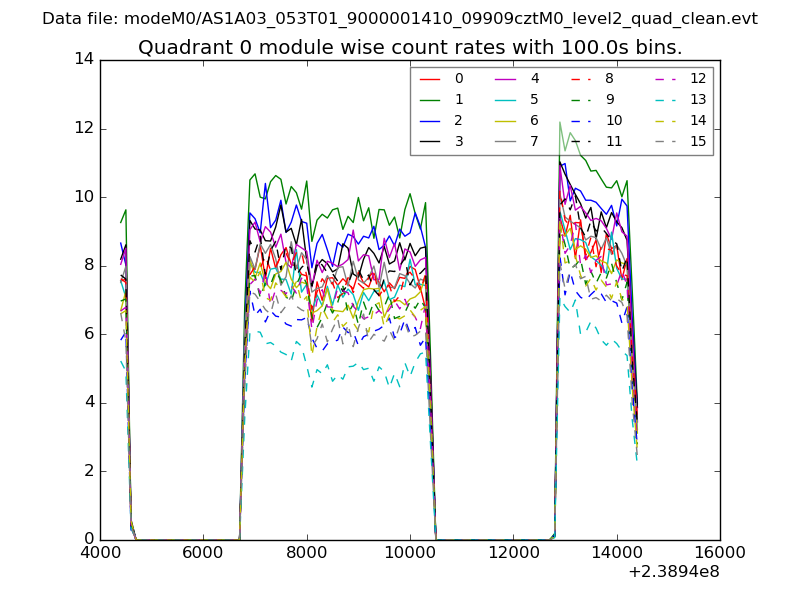 |
 |
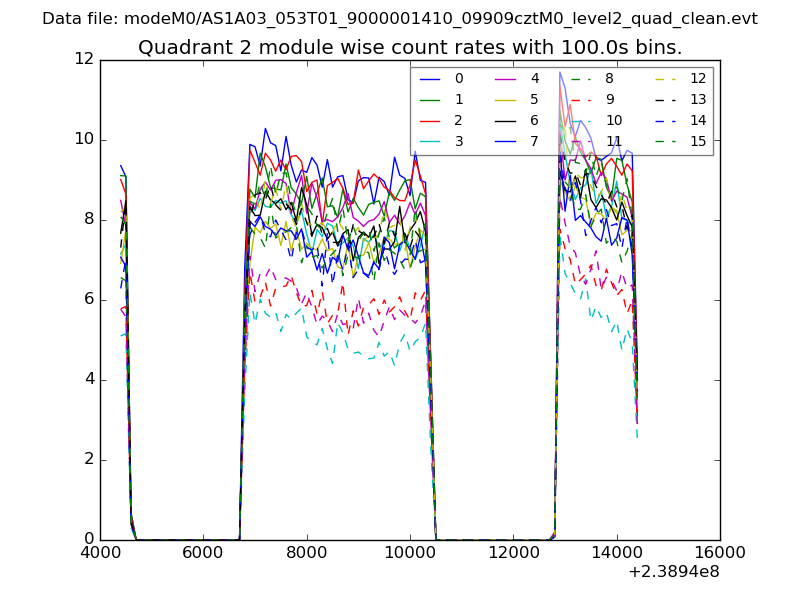
| Module-wise count rates for Quadrant B Data is divided into 100 sec bins |
 |
 |
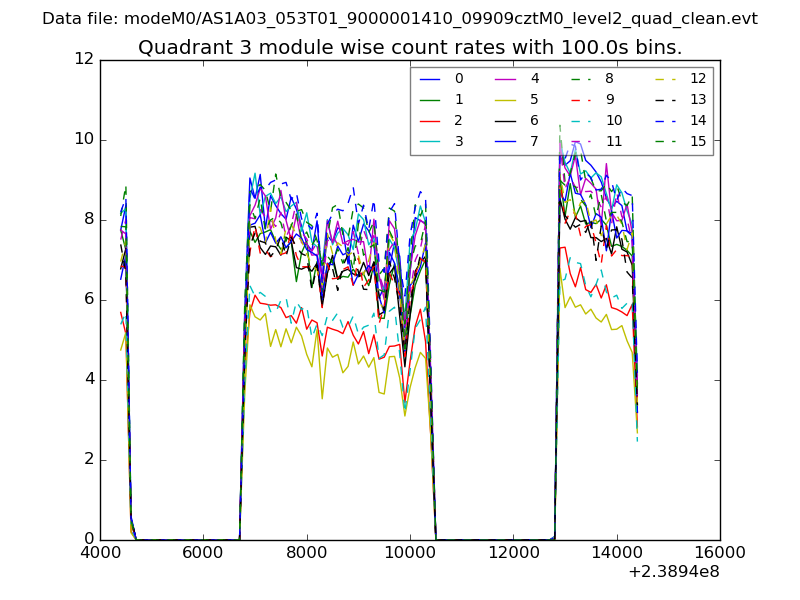
| Module-wise count rates for Quadrant C Data is divided into 100 sec bins |
 |
 |
| Module-wise count rates for Quadrant D Data is divided into 100 sec bins |
 |
 |
| Parameter | Plot |
|---|---|
| CZT HV Monitor | 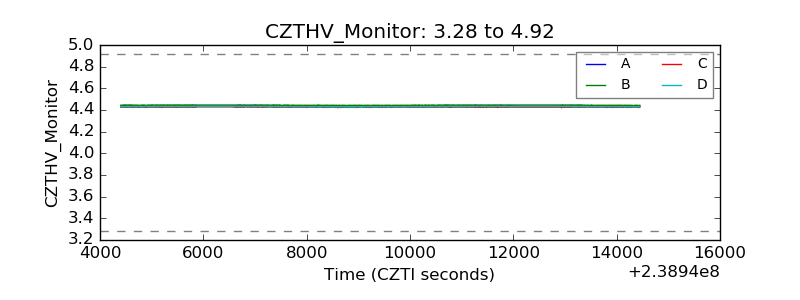 |
| D_VDD | 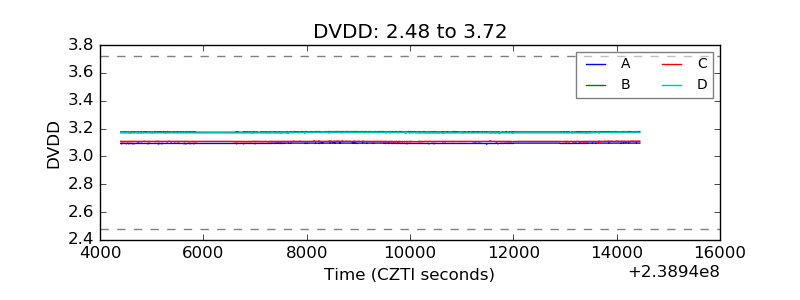 |
| Temperature 1 | 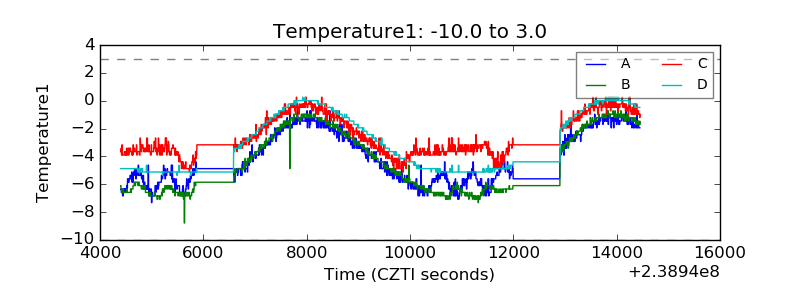 |
| Veto HV Monitor | 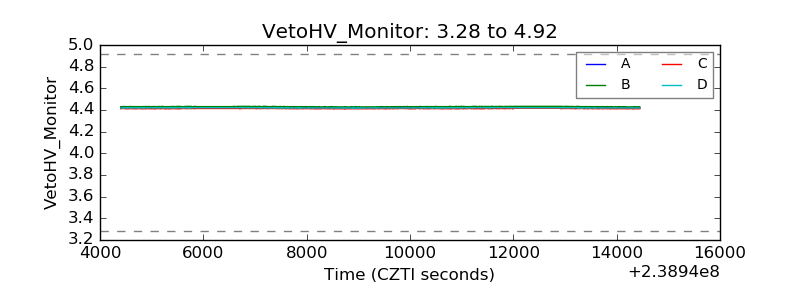 |
| Veto LLD | 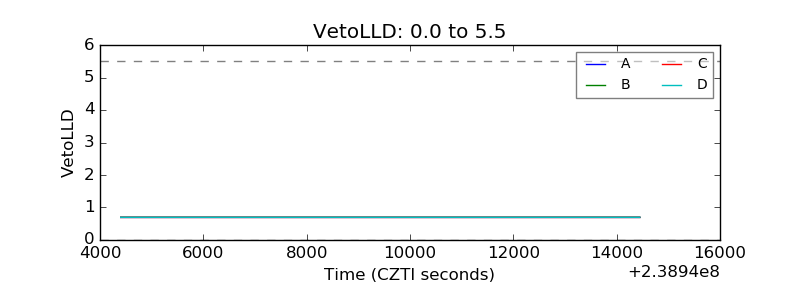 |
| Alpha Counter | 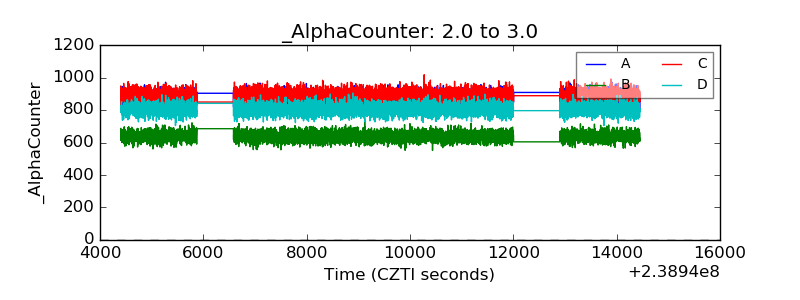 |
| _CPM_Rate | 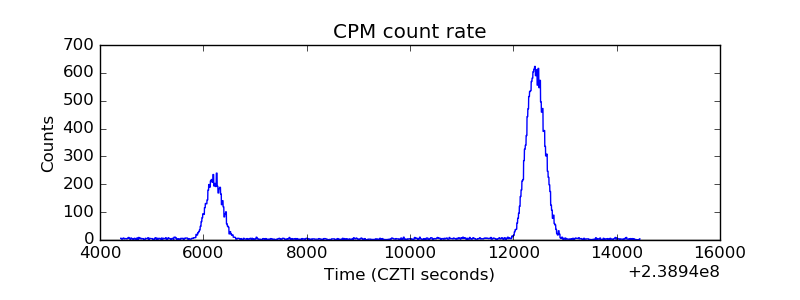 |
| CZT Counter | 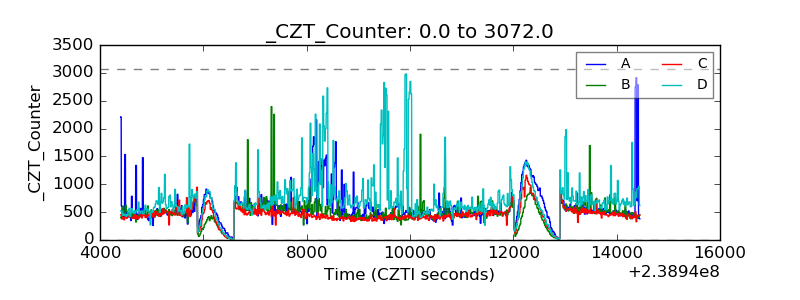 |
| +2.5 Volts monitor |  |
| +5 Volts monitor |  |
| _ROLL_ROT | 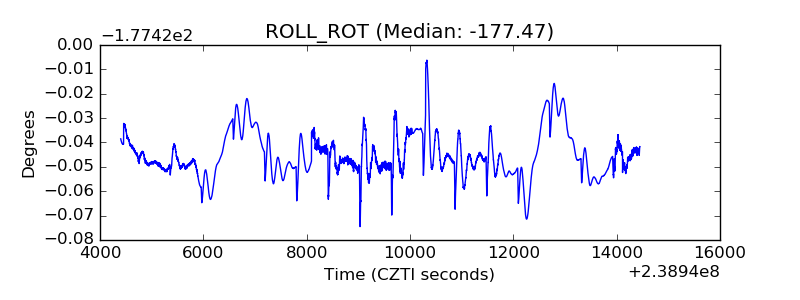 |
| _Roll_DEC | 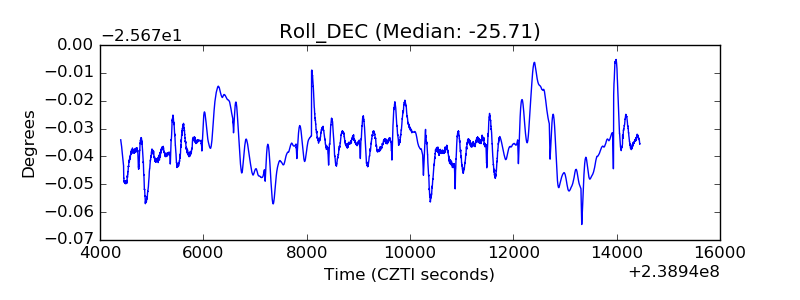 |
| _Roll_RA | 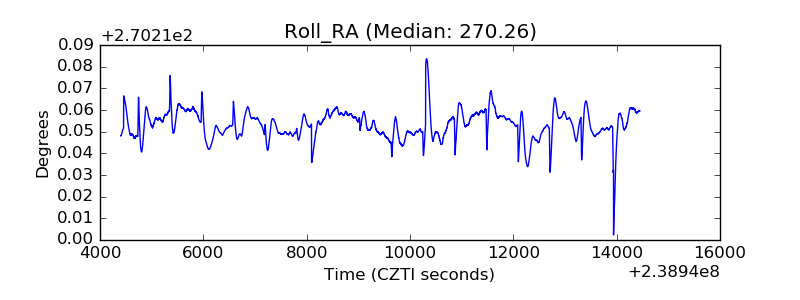 |
| Veto Counter | 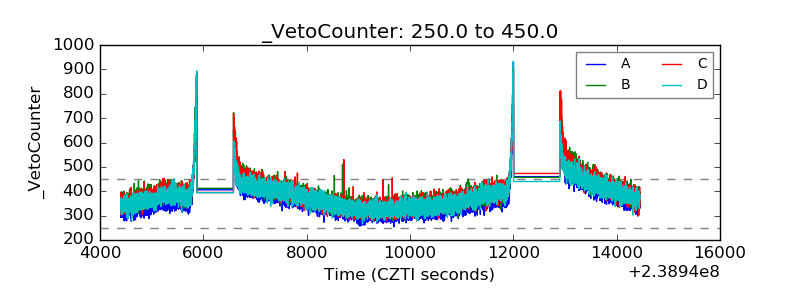 |