| Param | Original file | Final file |
|---|---|---|
| Filename | modeM0/AS1A03_053T01_9000001410_09910cztM0_level2.evt | modeM0/AS1A03_053T01_9000001410_09910cztM0_level2_quad_clean.evt |
| Size (bytes) | 2,669,765,760 | 447,906,240 |
| Size | 2.5 GB | 427.2 MB |
| Events in quadrant A | 18,141,715 | 2,805,215 |
| Events in quadrant B | 18,392,999 | 2,844,969 |
| Events in quadrant C | 15,937,473 | 2,834,219 |
| Events in quadrant D | 25,981,267 | 2,636,825 |
| Mode M9 | |||
|---|---|---|---|
| Quadrant | BADHDUFLAG | Total packets | Discarded packets |
| A | 0 | 36 | 0 |
| B | 0 | 36 | 0 |
| C | 0 | 36 | 0 |
| D | 0 | 36 | 0 |
| Mode SS | |||
|---|---|---|---|
| Quadrant | BADHDUFLAG | Total packets | Discarded packets |
| A | 0 | 724 | 0 |
| B | 0 | 724 | 0 |
| C | 0 | 724 | 2 |
| D | 0 | 724 | 0 |
| Mode M0 | |||
|---|---|---|---|
| Quadrant | BADHDUFLAG | Total packets | Discarded packets |
| A | 0 | 77926 | 80 |
| B | 0 | 78216 | 98 |
| C | 0 | 72679 | 72 |
| D | 0 | 101280 | 224 |
| Quadrant | Total seconds | Saturated seconds | Saturation percentage |
|---|---|---|---|
| A | 35597 | 690 | 1.938366% |
| B | 35593 | 697 | 1.958250% |
| C | 35598 | 367 | 1.030957% |
| D | 35579 | 1344 | 3.777509% |
Noise dominated data is calculated using 1-second bins in cleaned event files. If a bin has >2000 counts, and if more than 50% of those come from <1% of pixels, then it is considered to be noise-dominated and hence unusable.
| Quadrant | # 1 sec bins | Bins with >0 counts | Bins with >2000 counts | High rate bins dominated by noise | Noise dominated (total time) | Noise dominated (detector-on time) | Marked lightcurve |
|---|---|---|---|---|---|---|---|
| A | 39325 | 35633 | 177 | 177 | 0.45% | 0.50% | 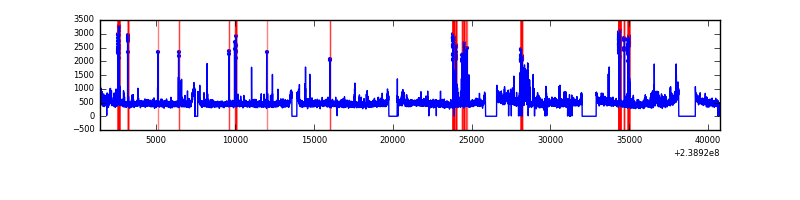 |
| B | 39325 | 35634 | 108 | 108 | 0.27% | 0.30% | 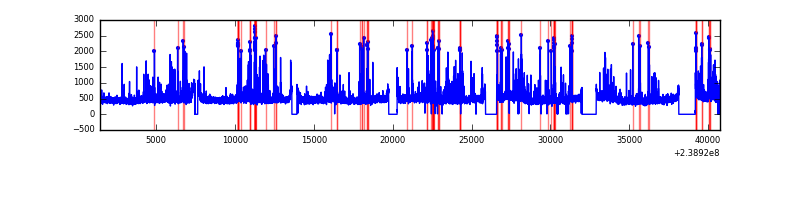 |
| C | 39325 | 35634 | 1 | 1 | 0.00% | 0.00% | 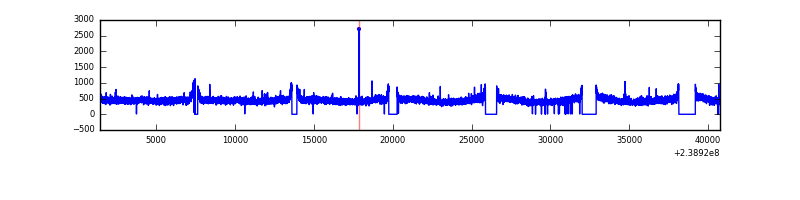 |
| D | 39325 | 35624 | 1039 | 1039 | 2.64% | 2.92% | 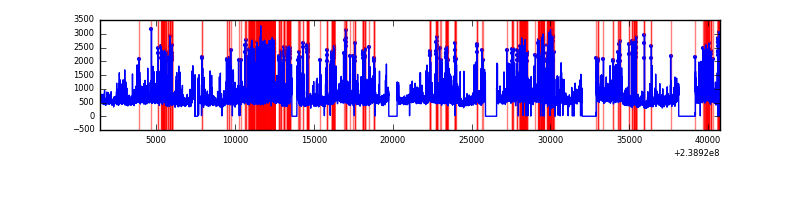 |
Top three noisy pixels from each quadrant. If the there are fewer than three noisy pixels in the level2.evt file, extra rows are filled as -1
| Pixel properties | Quadrant properties | ||||||
|---|---|---|---|---|---|---|---|
| Quadrant | DetID | PixID | Counts | Sigma | Mean | Median | Sigma |
| A | 15 | 239 | 1862222 | 2179.87 | 4182 | 4090 | 852.4 |
| A | 15 | 174 | 87895 | 98.32 | 4182 | 4090 | 852.4 |
| A | 13 | 251 | 50399 | 54.33 | 4182 | 4090 | 852.4 |
| B | 4 | 81 | 999728 | 1234.38 | 4203 | 4100 | 806.6 |
| B | 4 | 239 | 329272 | 403.15 | 4203 | 4100 | 806.6 |
| B | 0 | 214 | 303098 | 370.7 | 4203 | 4100 | 806.6 |
| C | 13 | 61 | 30695 | 28.23 | 4071 | 4089 | 942.4 |
| C | 14 | 67 | 29119 | 26.56 | 4071 | 4089 | 942.4 |
| C | 1 | 3 | 18699 | 15.5 | 4071 | 4089 | 942.4 |
| D | 8 | 195 | 3726385 | 3847.34 | 4000 | 3906 | 967.5 |
| D | 2 | 16 | 2558174 | 2639.95 | 4000 | 3906 | 967.5 |
| D | 1 | 52 | 1744512 | 1798.99 | 4000 | 3906 | 967.5 |
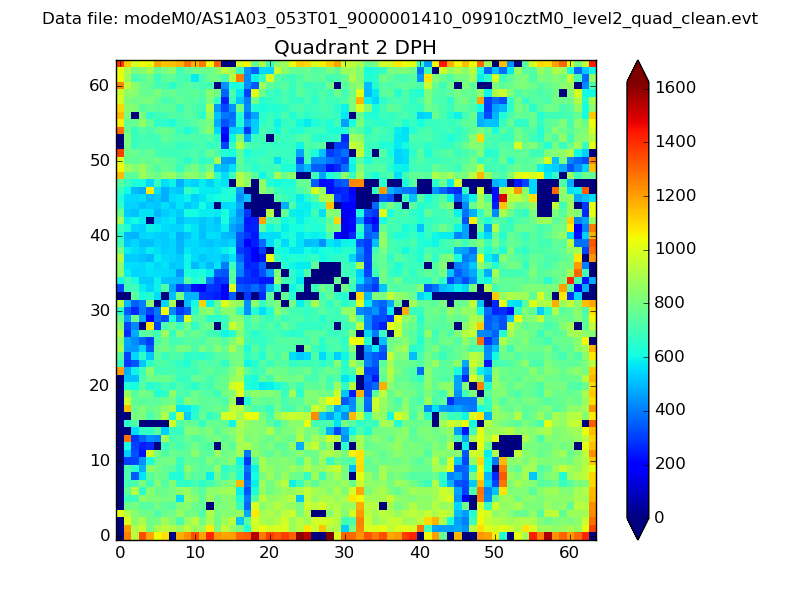
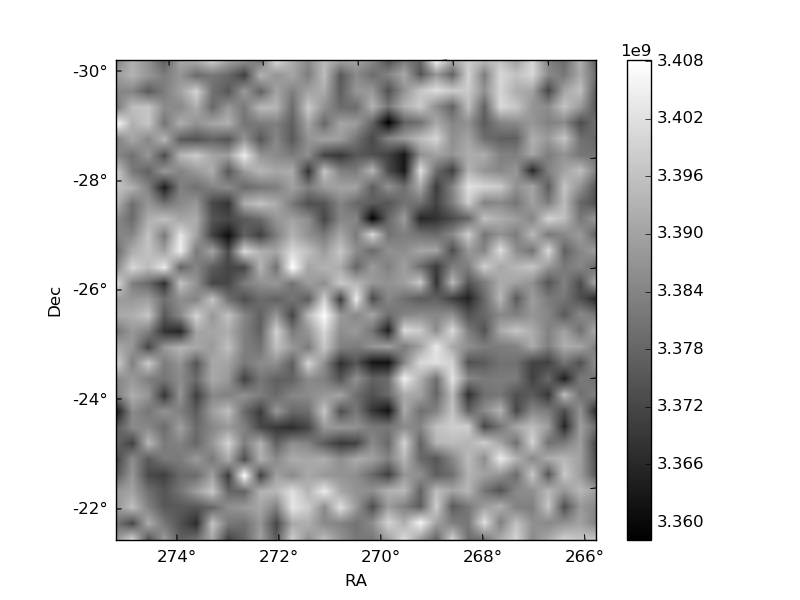
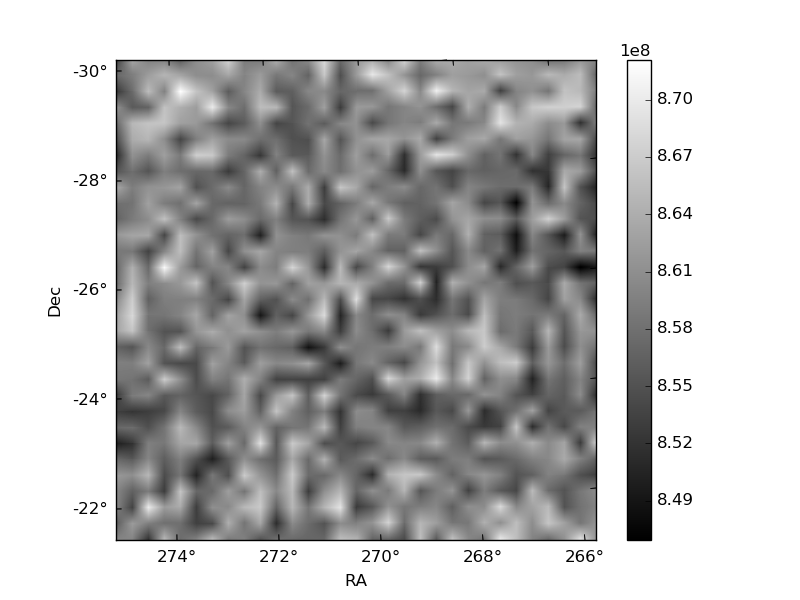
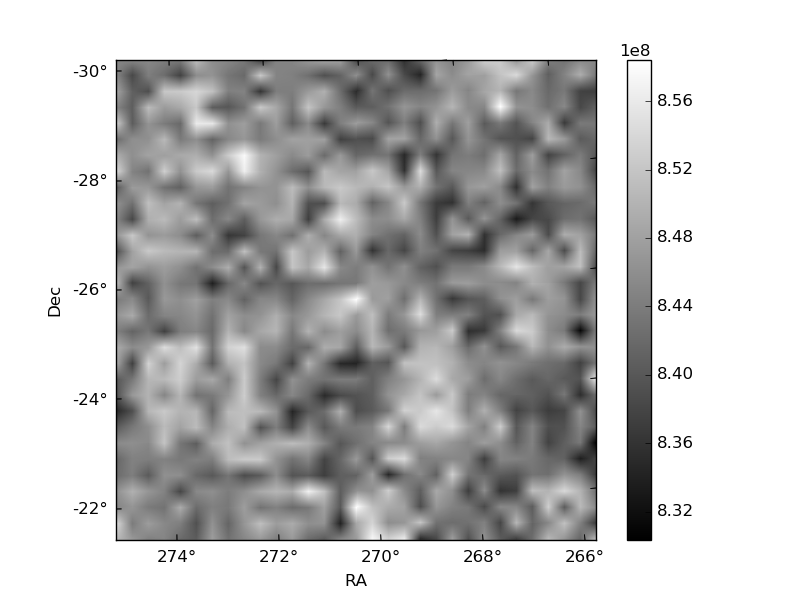
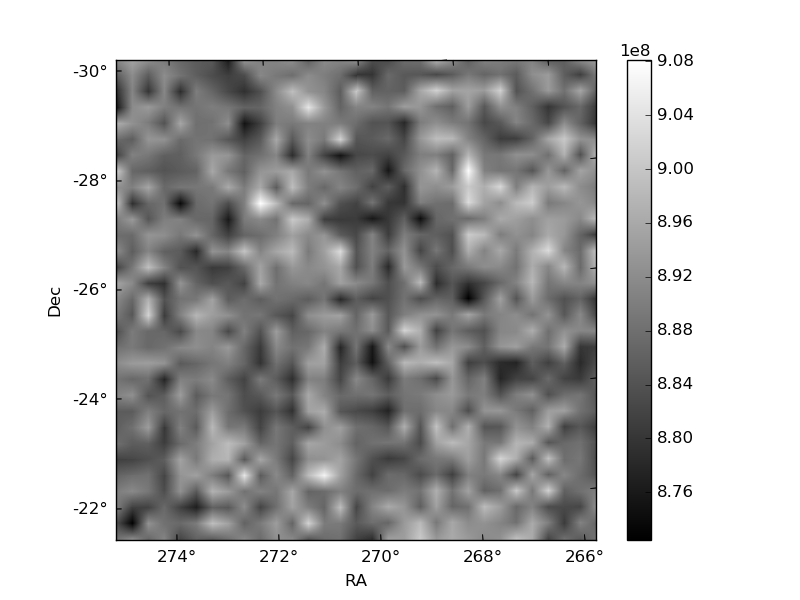
Histogram calculated using DETX and DETY for each event in the final _common_clean file
| Quadrant A | 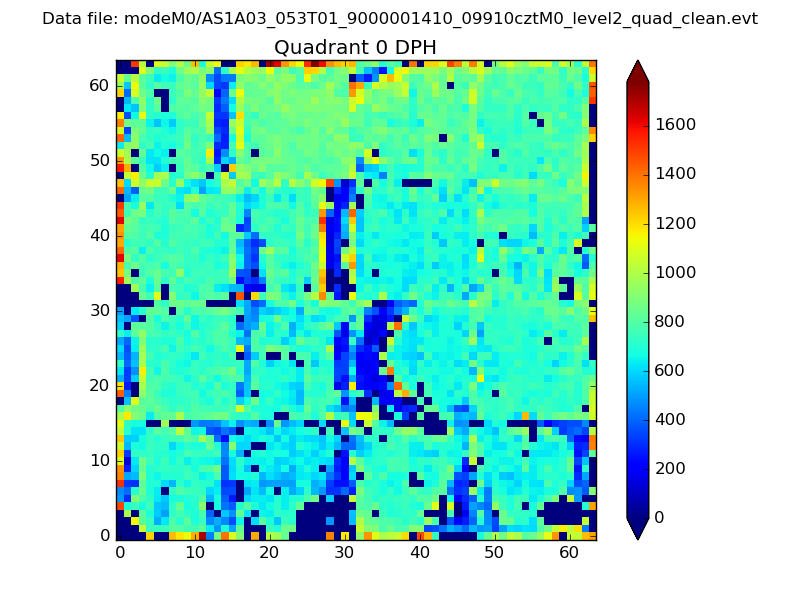 |
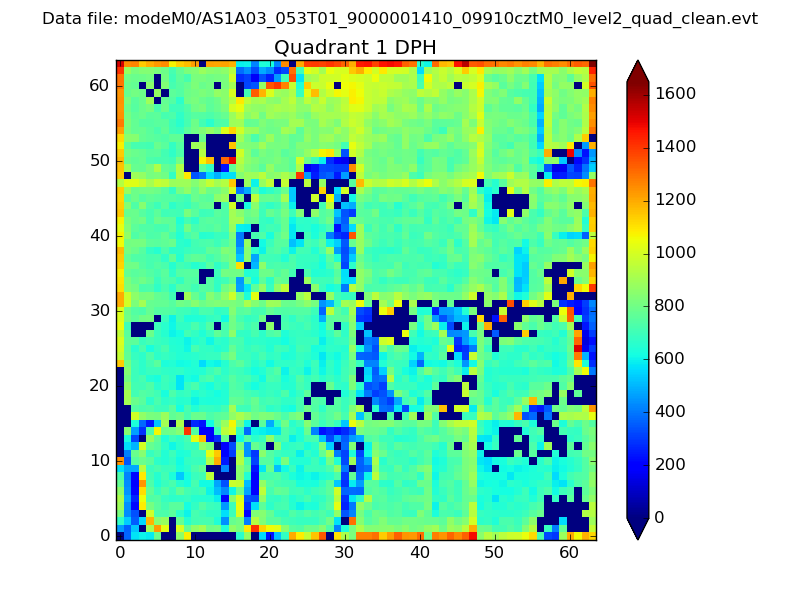 |
Quadrant B |
|---|---|---|---|
| Quadrant D | 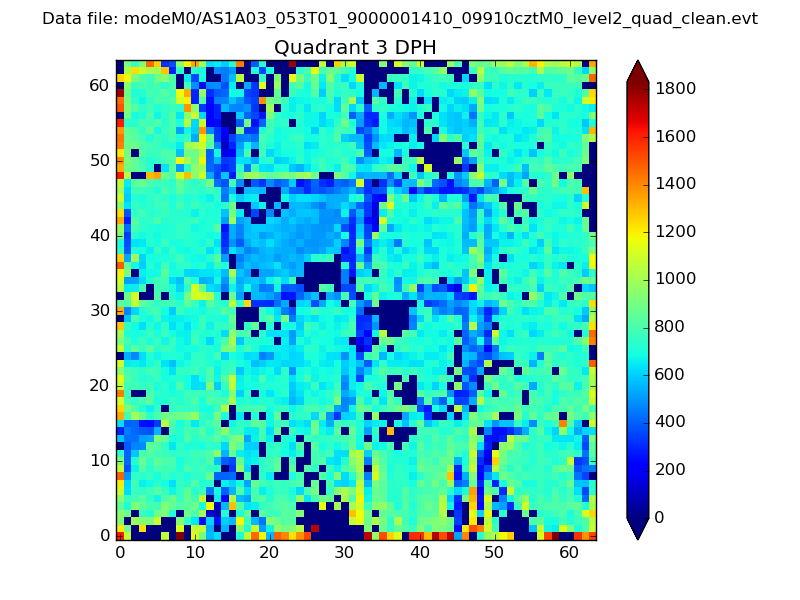 |
 |
Quadrant C |
| Plot type | Count rate plots | Images |
|---|---|---|
| Comparison with Poisson distribution Blue bars denote a histogram of data divided into 1 sec bins. Red curve is a Poisson curve with rate = median count rate of data. |
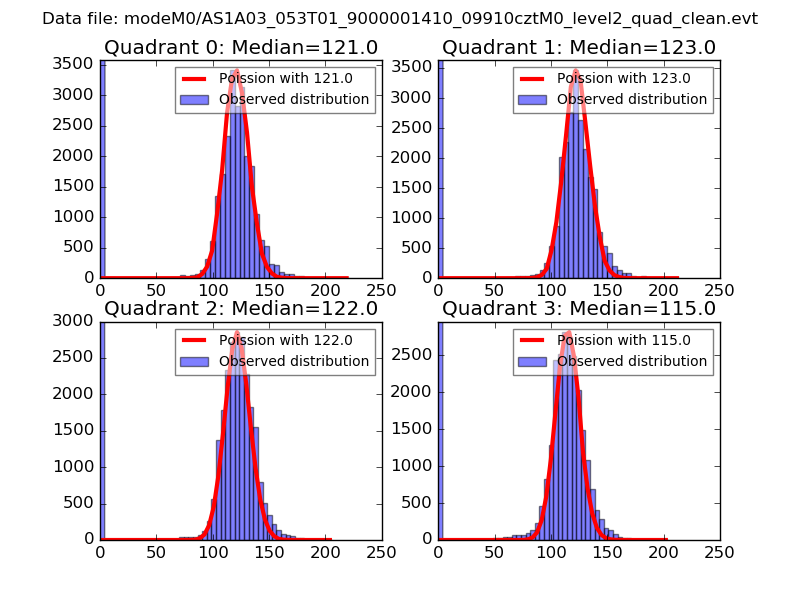 |
 |
| Quadrant-wise count rates Data is divided into 100 sec bins |
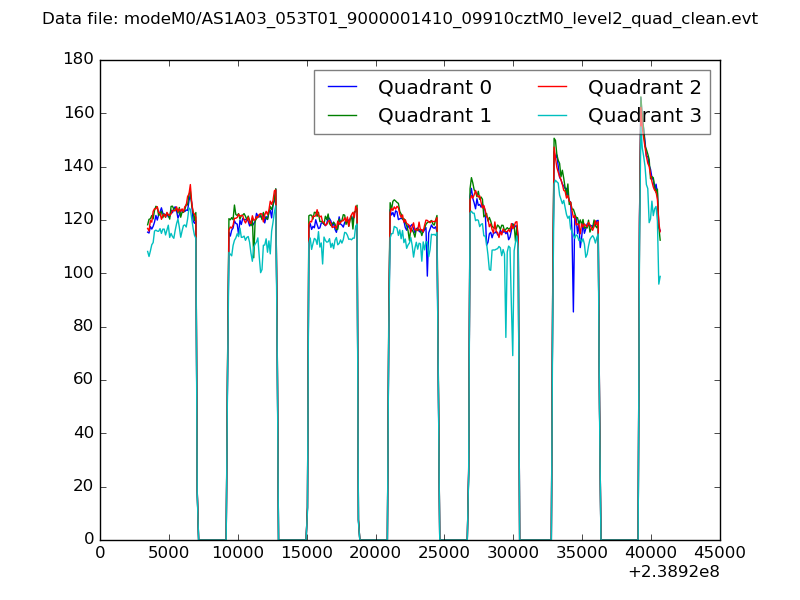 |
|
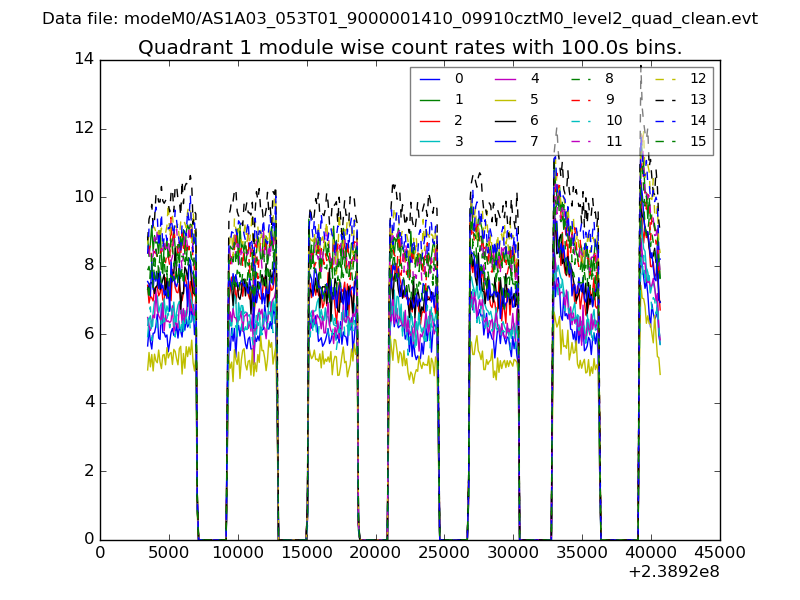
| Module-wise count rates for Quadrant A Data is divided into 100 sec bins |
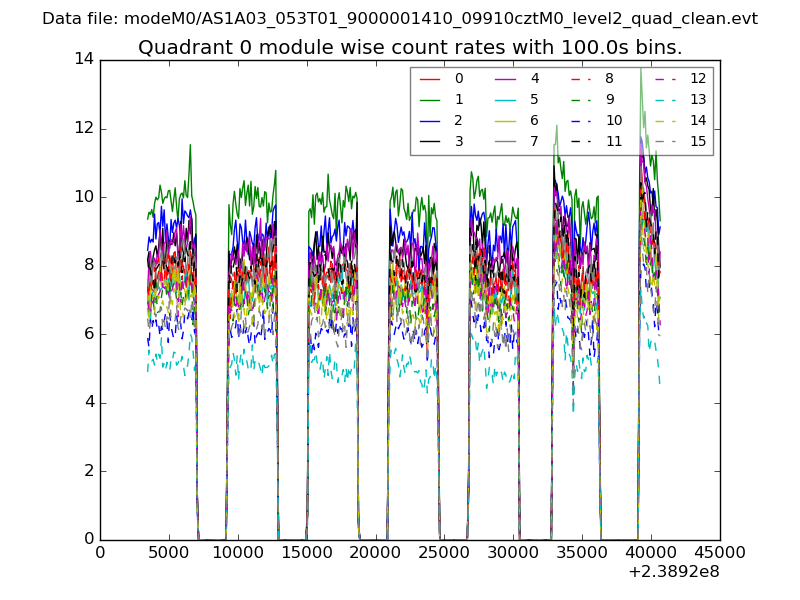 |
 |
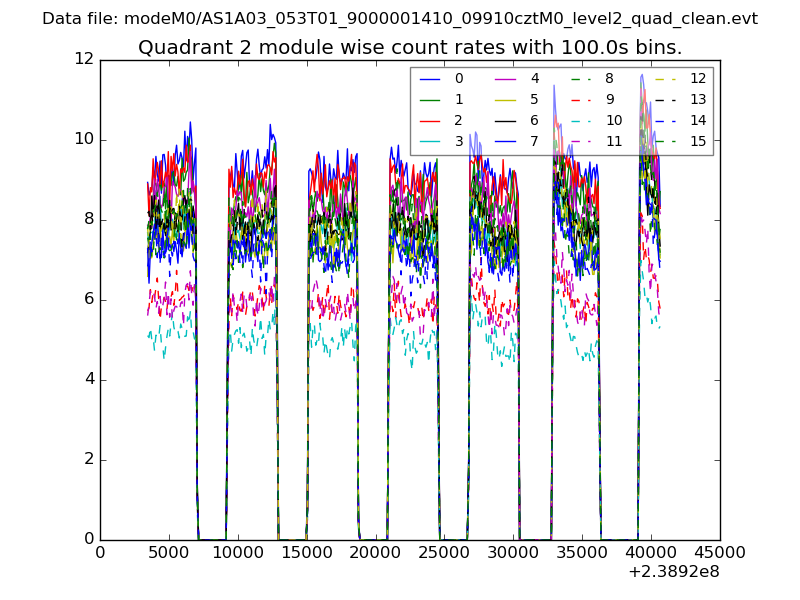
| Module-wise count rates for Quadrant B Data is divided into 100 sec bins |
 |
 |
| Module-wise count rates for Quadrant C Data is divided into 100 sec bins |
 |
 |
| Module-wise count rates for Quadrant D Data is divided into 100 sec bins |
 |
 |
| Parameter | Plot |
|---|---|
| CZT HV Monitor | 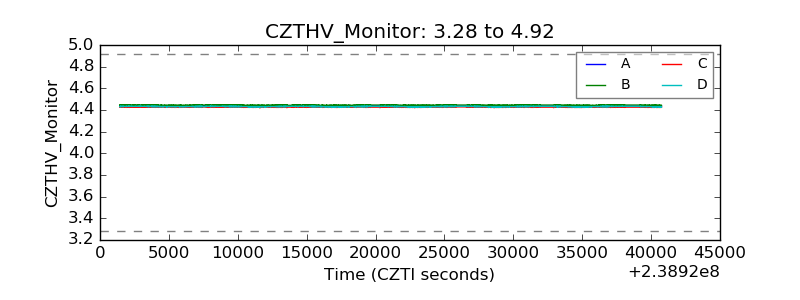 |
| D_VDD | 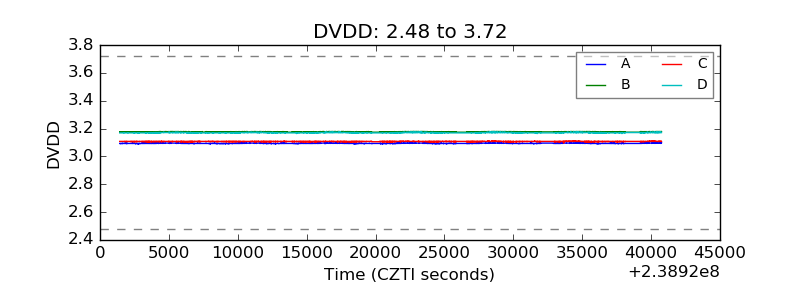 |
| Temperature 1 |  |
| Veto HV Monitor | 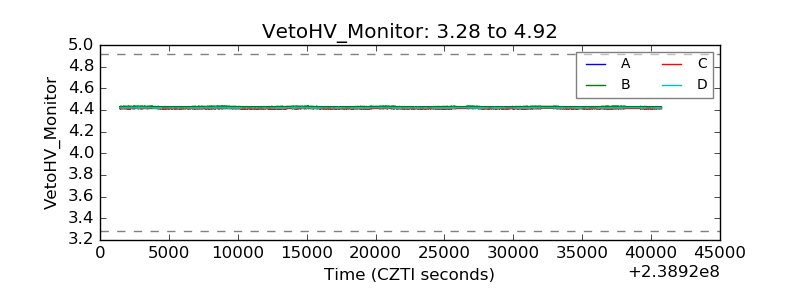 |
| Veto LLD | 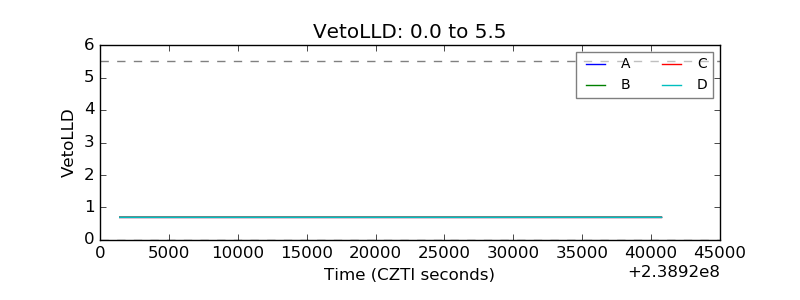 |
| Alpha Counter | 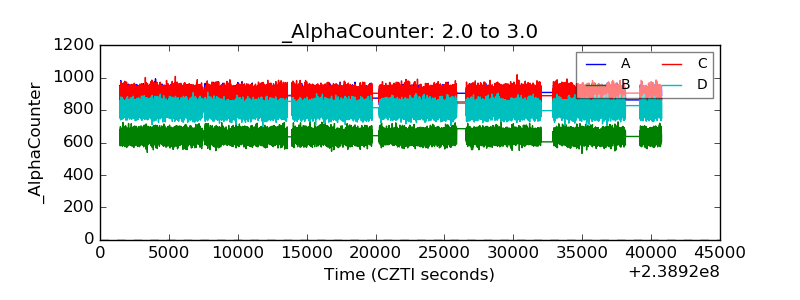 |
| _CPM_Rate | 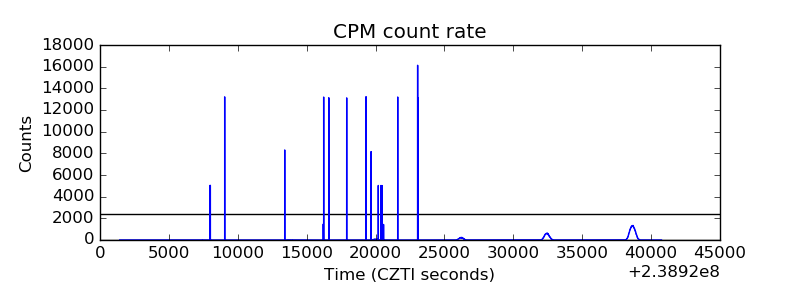 |
| CZT Counter | 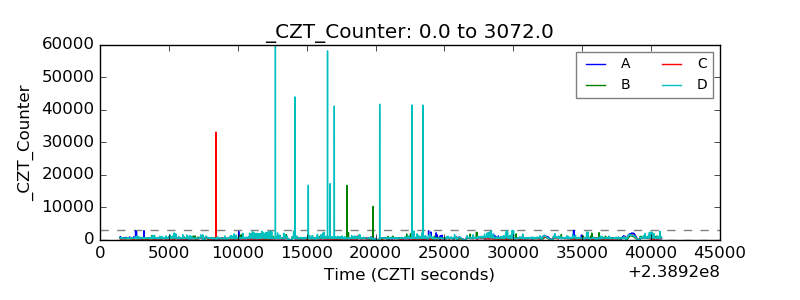 |
| +2.5 Volts monitor |  |
| +5 Volts monitor | 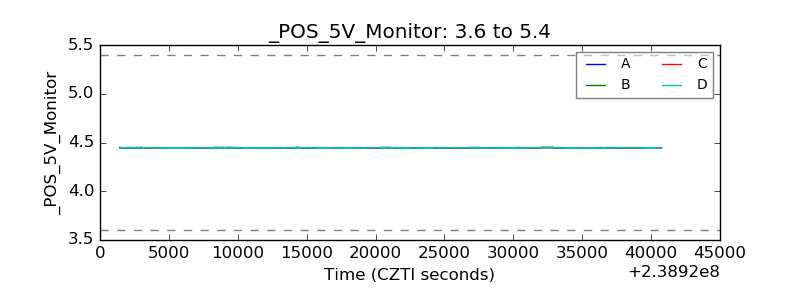 |
| _ROLL_ROT |  |
| _Roll_DEC | 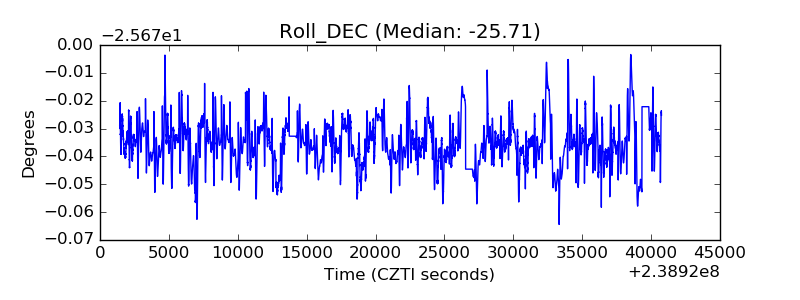 |
| _Roll_RA | 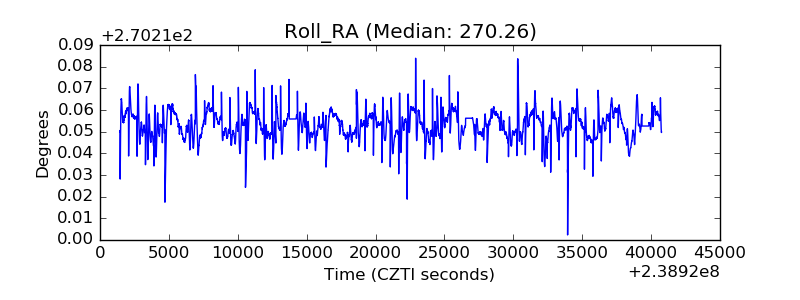 |
| Veto Counter | 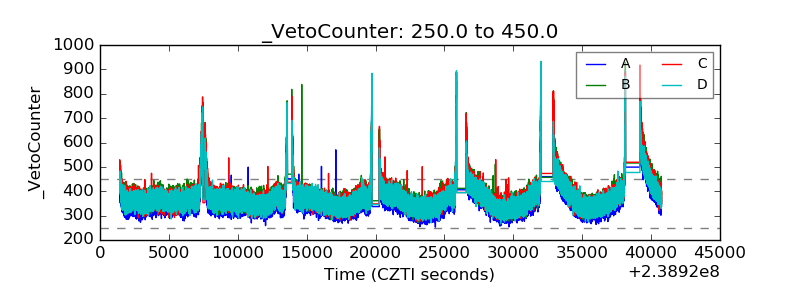 |