| Param | Original file | Final file |
|---|---|---|
| Filename | modeM0/AS1A03_053T01_9000001410_09912cztM0_level2.evt | modeM0/AS1A03_053T01_9000001410_09912cztM0_level2_quad_clean.evt |
| Size (bytes) | 493,977,600 | 90,619,200 |
| Size | 471.1 MB | 86.4 MB |
| Events in quadrant A | 3,066,173 | 588,646 |
| Events in quadrant B | 3,825,296 | 587,970 |
| Events in quadrant C | 2,987,993 | 581,365 |
| Events in quadrant D | 4,646,692 | 540,120 |
| Mode M9 | |||
|---|---|---|---|
| Quadrant | BADHDUFLAG | Total packets | Discarded packets |
| A | 0 | 15 | 0 |
| B | 0 | 15 | 0 |
| C | 0 | 15 | 0 |
| D | 0 | 16 | 0 |
| Mode SS | |||
|---|---|---|---|
| Quadrant | BADHDUFLAG | Total packets | Discarded packets |
| A | 0 | 130 | 0 |
| B | 0 | 130 | 0 |
| C | 0 | 130 | 0 |
| D | 0 | 130 | 0 |
| Mode M0 | |||
|---|---|---|---|
| Quadrant | BADHDUFLAG | Total packets | Discarded packets |
| A | 0 | 13436 | 3 |
| B | 0 | 15656 | 2 |
| C | 0 | 13280 | 2 |
| D | 0 | 18174 | 2 |
| Quadrant | Total seconds | Saturated seconds | Saturation percentage |
|---|---|---|---|
| A | 6393 | 59 | 0.922884% |
| B | 6393 | 141 | 2.205537% |
| C | 6393 | 37 | 0.578758% |
| D | 6393 | 251 | 3.926169% |
Noise dominated data is calculated using 1-second bins in cleaned event files. If a bin has >2000 counts, and if more than 50% of those come from <1% of pixels, then it is considered to be noise-dominated and hence unusable.
| Quadrant | # 1 sec bins | Bins with >0 counts | Bins with >2000 counts | High rate bins dominated by noise | Noise dominated (total time) | Noise dominated (detector-on time) | Marked lightcurve |
|---|---|---|---|---|---|---|---|
| A | 7568 | 6394 | 0 | 0 | 0.00% | 0.00% | 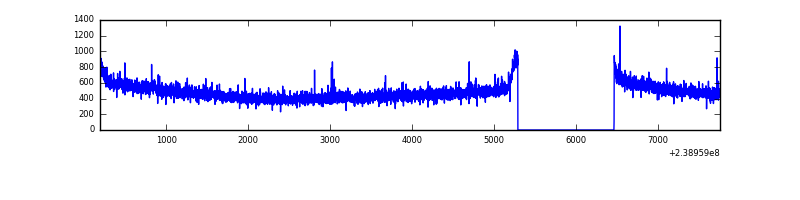 |
| B | 7568 | 6394 | 49 | 49 | 0.65% | 0.77% |  |
| C | 7568 | 6394 | 0 | 0 | 0.00% | 0.00% | 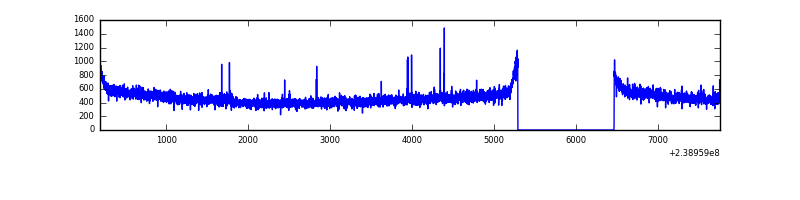 |
| D | 7568 | 6394 | 172 | 172 | 2.27% | 2.69% |  |
Top three noisy pixels from each quadrant. If the there are fewer than three noisy pixels in the level2.evt file, extra rows are filled as -1
| Pixel properties | Quadrant properties | ||||||
|---|---|---|---|---|---|---|---|
| Quadrant | DetID | PixID | Counts | Sigma | Mean | Median | Sigma |
| A | 0 | 226 | 7612 | 42.69 | 793 | 779 | 160.1 |
| A | 12 | 194 | 6718 | 37.11 | 793 | 779 | 160.1 |
| A | 13 | 253 | 4740 | 24.75 | 793 | 779 | 160.1 |
| B | 4 | 81 | 435618 | 2860.09 | 791 | 775 | 152.0 |
| B | 4 | 239 | 165791 | 1085.36 | 791 | 775 | 152.0 |
| B | 0 | 219 | 33212 | 213.35 | 791 | 775 | 152.0 |
| C | 9 | 221 | 10736 | 56.38 | 760 | 765 | 176.9 |
| C | 14 | 128 | 7841 | 40.01 | 760 | 765 | 176.9 |
| C | 12 | 4 | 6225 | 30.87 | 760 | 765 | 176.9 |
| D | 8 | 195 | 482146 | 2451.25 | 747 | 729 | 196.4 |
| D | 2 | 16 | 283109 | 1437.8 | 747 | 729 | 196.4 |
| D | 1 | 52 | 281566 | 1429.95 | 747 | 729 | 196.4 |
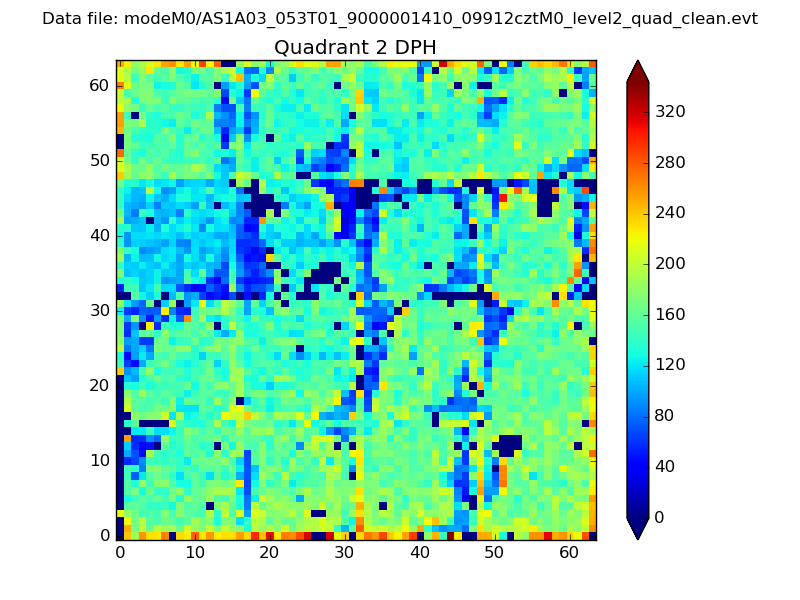
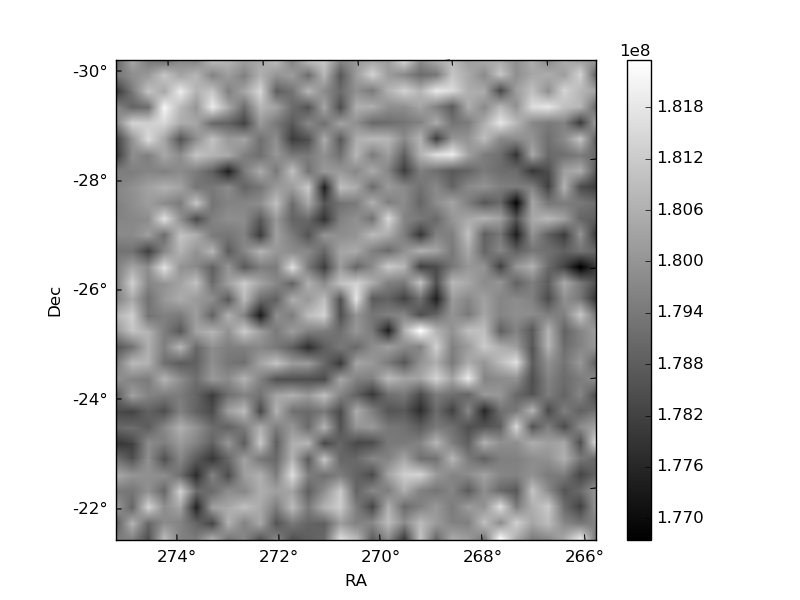
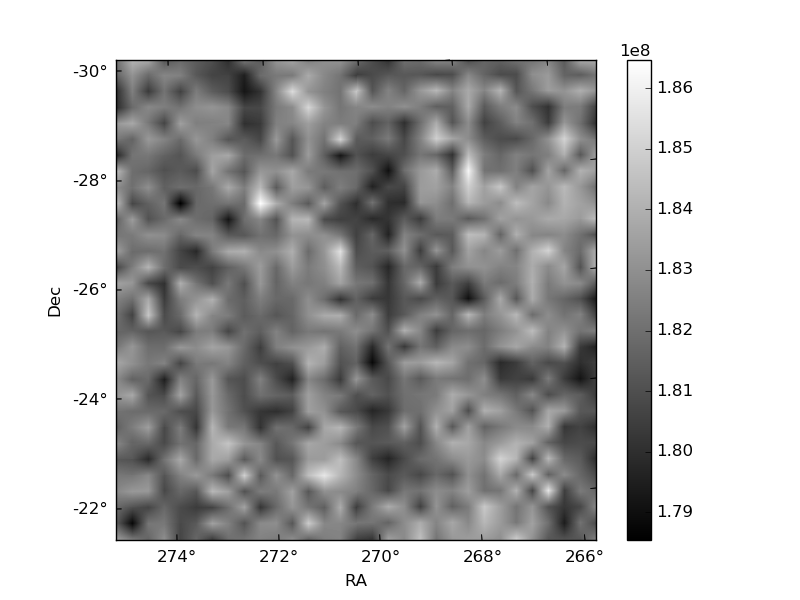
Histogram calculated using DETX and DETY for each event in the final _common_clean file
| Quadrant A | 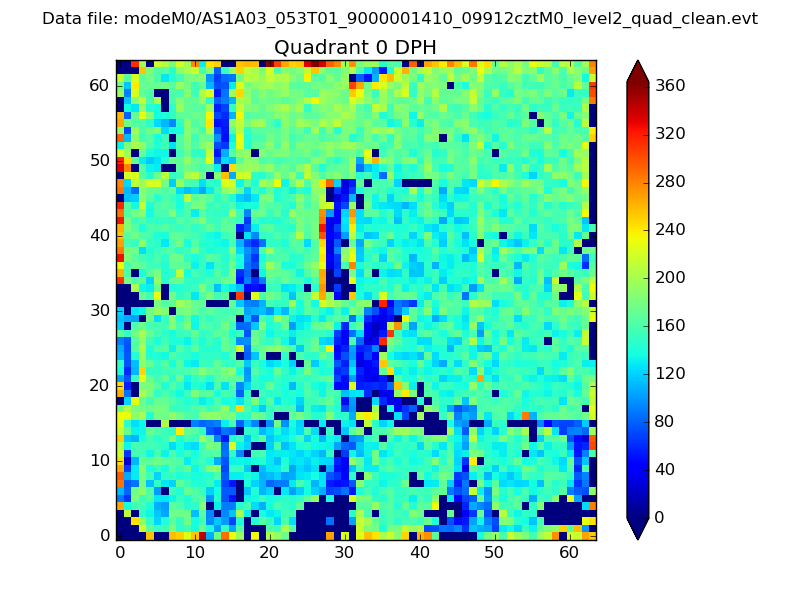 |
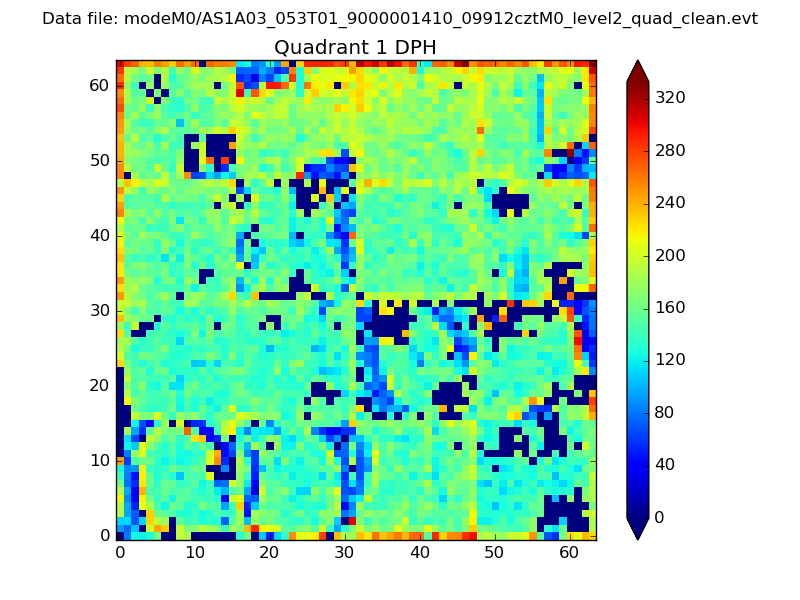 |
Quadrant B |
|---|---|---|---|
| Quadrant D | 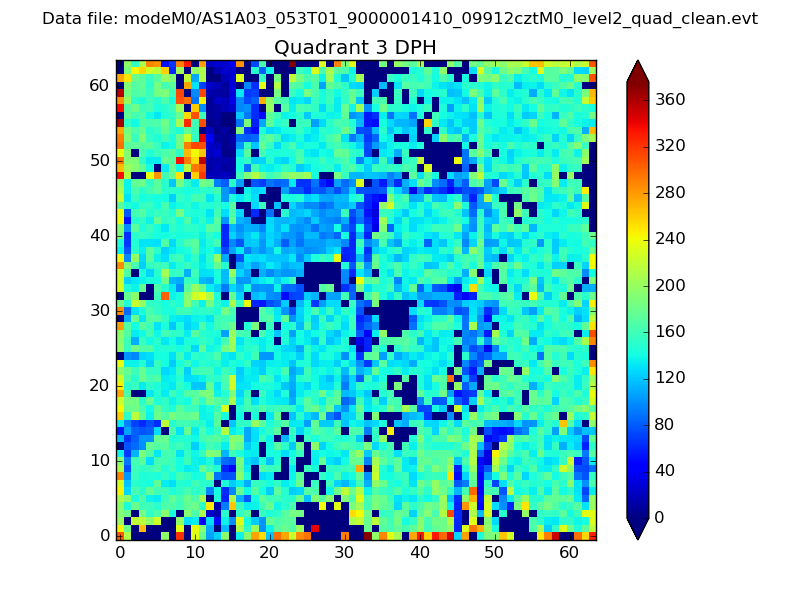 |
 |
Quadrant C |
| Plot type | Count rate plots | Images |
|---|---|---|
| Comparison with Poisson distribution Blue bars denote a histogram of data divided into 1 sec bins. Red curve is a Poisson curve with rate = median count rate of data. |
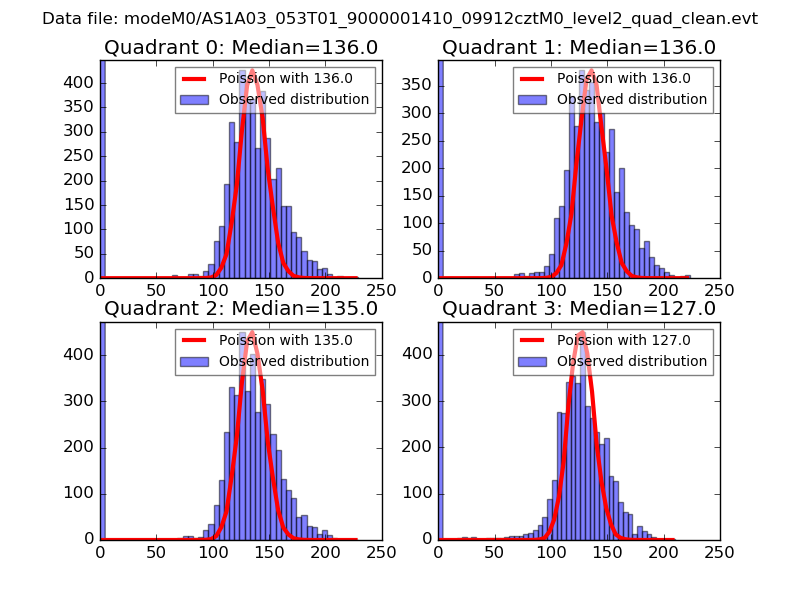 |
 |
| Quadrant-wise count rates Data is divided into 100 sec bins |
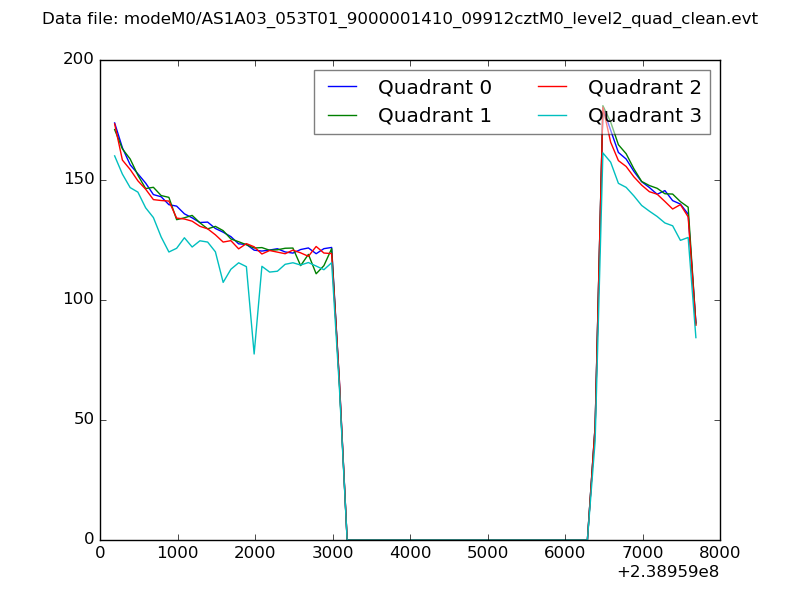 |
|
| Module-wise count rates for Quadrant A Data is divided into 100 sec bins |
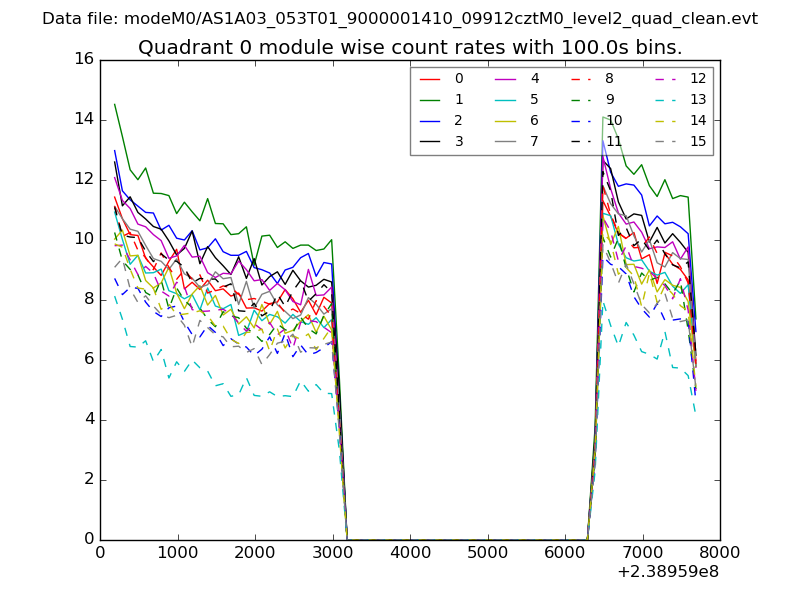 |
 |
| Module-wise count rates for Quadrant B Data is divided into 100 sec bins |
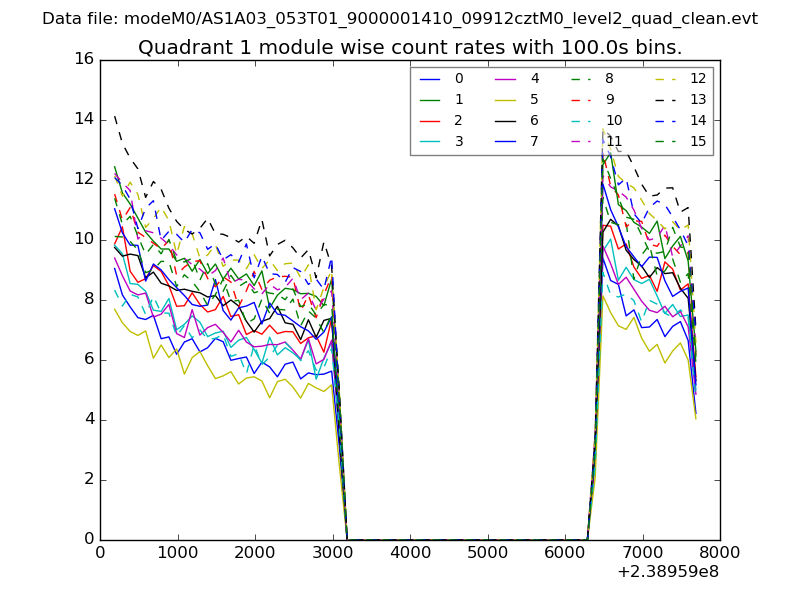 |
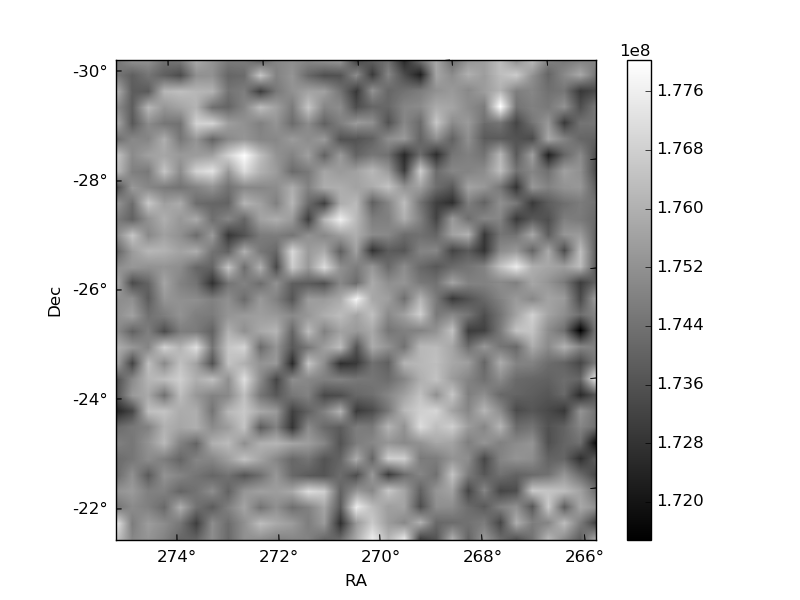 |
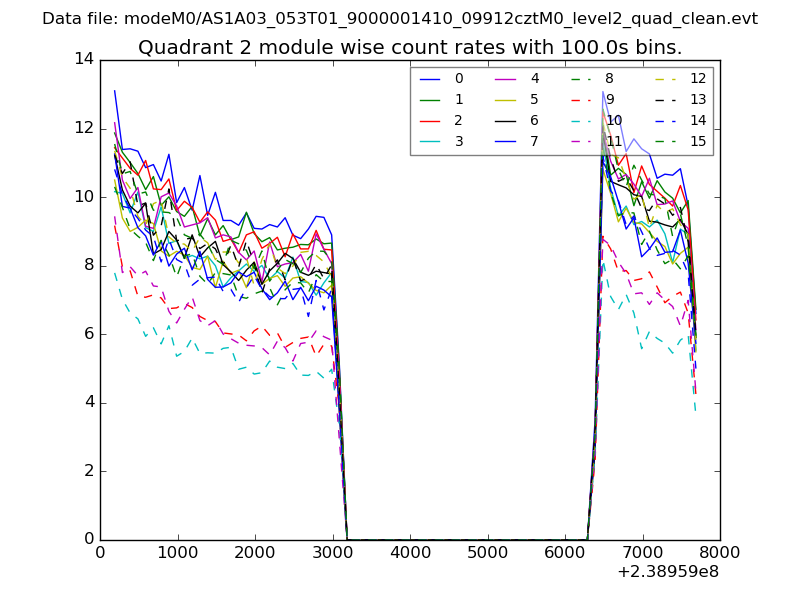
| Module-wise count rates for Quadrant C Data is divided into 100 sec bins |
 |
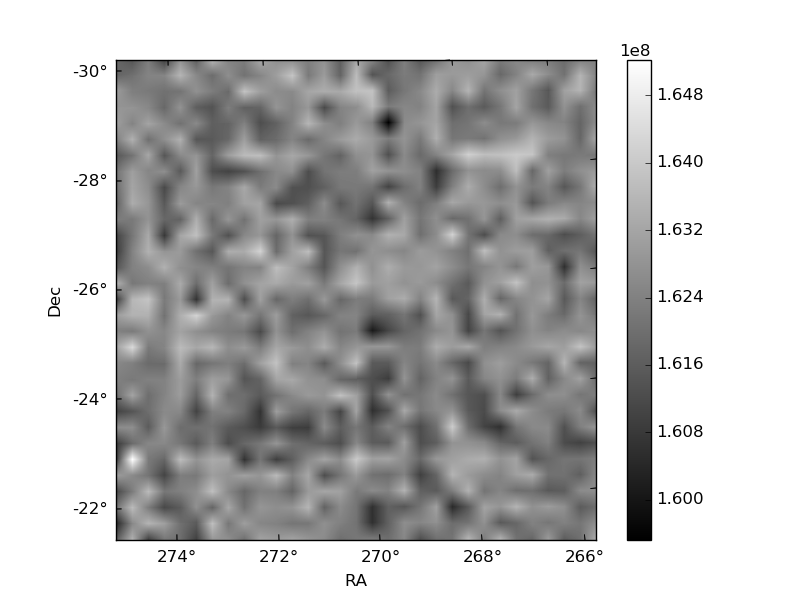 |
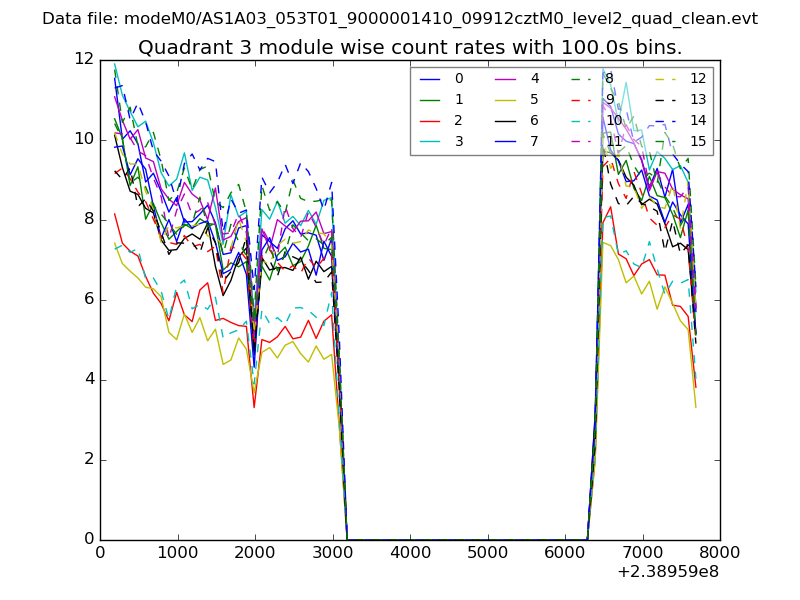
| Module-wise count rates for Quadrant D Data is divided into 100 sec bins |
 |
 |
| Parameter | Plot |
|---|---|
| CZT HV Monitor | 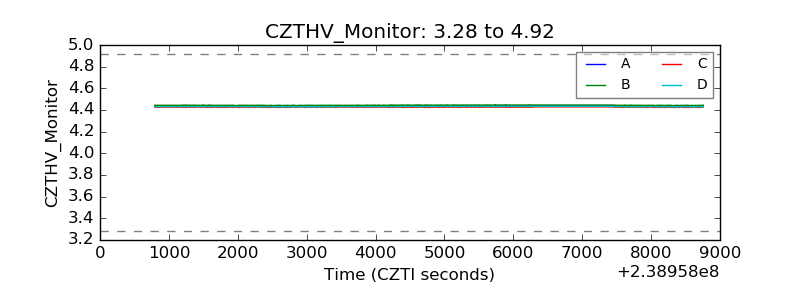 |
| D_VDD | 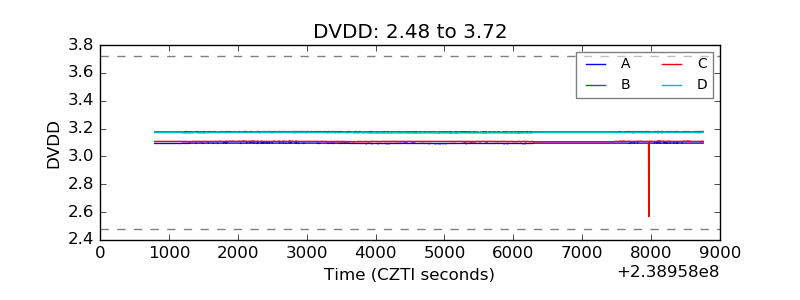 |
| Temperature 1 | 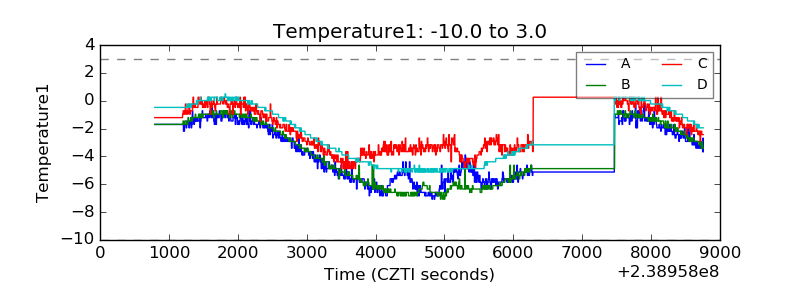 |
| Veto HV Monitor | 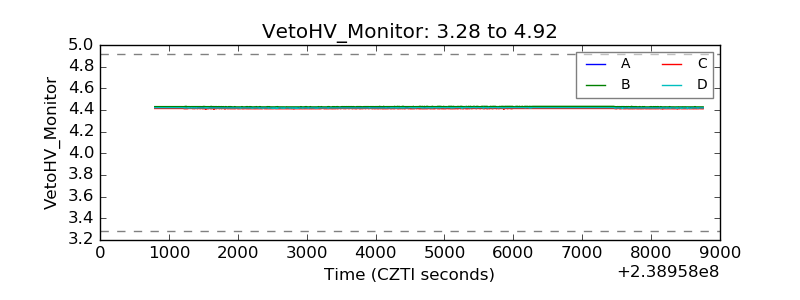 |
| Veto LLD | 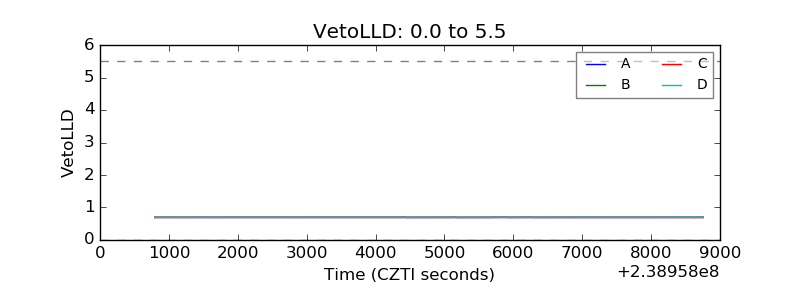 |
| Alpha Counter | 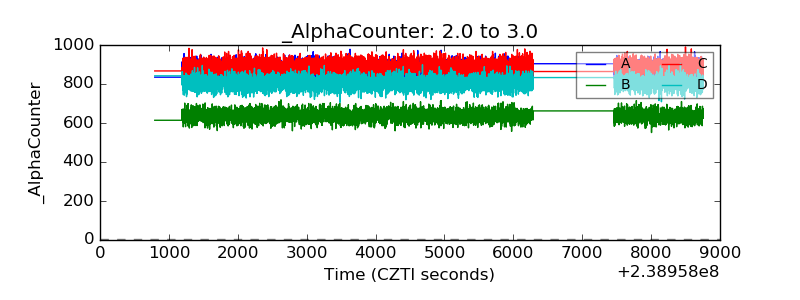 |
| _CPM_Rate | 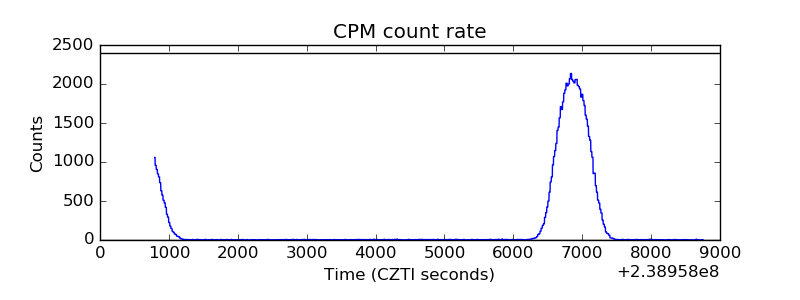 |
| CZT Counter | 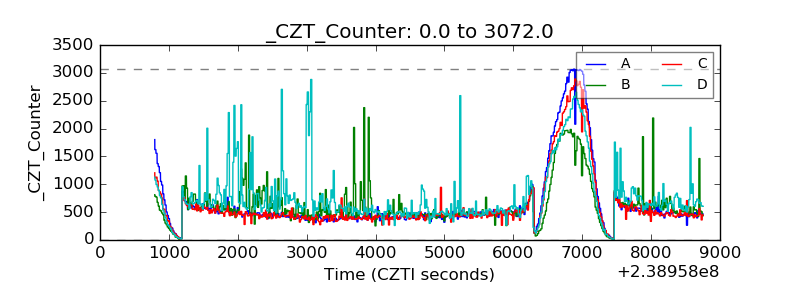 |
| +2.5 Volts monitor |  |
| +5 Volts monitor |  |
| _ROLL_ROT | 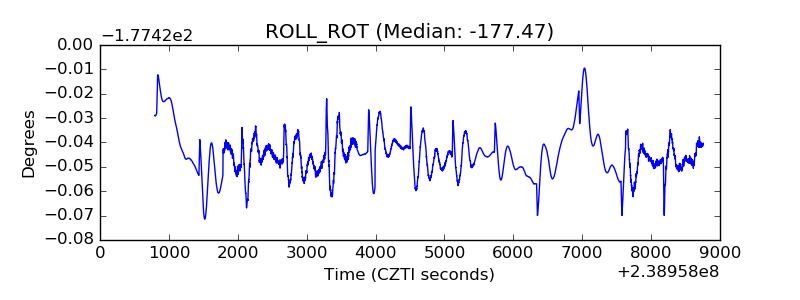 |
| _Roll_DEC |  |
| _Roll_RA | 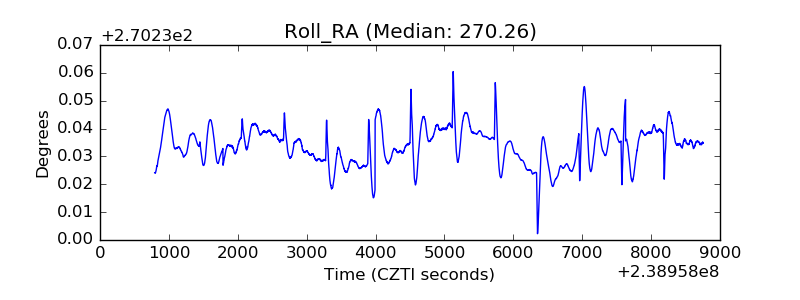 |
| Veto Counter | 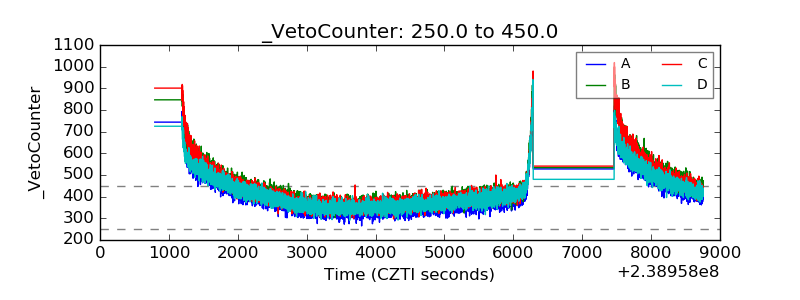 |