| Param | Original file | Final file |
|---|---|---|
| Filename | modeM0/AS1A03_053T01_9000001410_09913cztM0_level2.evt | modeM0/AS1A03_053T01_9000001410_09913cztM0_level2_quad_clean.evt |
| Size (bytes) | 535,377,600 | 85,999,680 |
| Size | 510.6 MB | 82.0 MB |
| Events in quadrant A | 4,646,983 | 527,169 |
| Events in quadrant B | 3,345,730 | 572,940 |
| Events in quadrant C | 2,887,880 | 563,703 |
| Events in quadrant D | 4,918,624 | 513,215 |
| Mode M9 | |||
|---|---|---|---|
| Quadrant | BADHDUFLAG | Total packets | Discarded packets |
| A | 0 | 20 | 0 |
| B | 0 | 20 | 0 |
| C | 0 | 20 | 0 |
| D | 0 | 20 | 0 |
| Mode SS | |||
|---|---|---|---|
| Quadrant | BADHDUFLAG | Total packets | Discarded packets |
| A | 0 | 128 | 2 |
| B | 0 | 128 | 4 |
| C | 0 | 128 | 0 |
| D | 0 | 128 | 4 |
| Mode M0 | |||
|---|---|---|---|
| Quadrant | BADHDUFLAG | Total packets | Discarded packets |
| A | 0 | 18358 | 394 |
| B | 0 | 14381 | 436 |
| C | 0 | 12935 | 279 |
| D | 0 | 19336 | 460 |
| Quadrant | Total seconds | Saturated seconds | Saturation percentage |
|---|---|---|---|
| A | 6105 | 662 | 10.843571% |
| B | 6097 | 79 | 1.295719% |
| C | 6121 | 16 | 0.261395% |
| D | 6107 | 293 | 4.797773% |
Noise dominated data is calculated using 1-second bins in cleaned event files. If a bin has >2000 counts, and if more than 50% of those come from <1% of pixels, then it is considered to be noise-dominated and hence unusable.
| Quadrant | # 1 sec bins | Bins with >0 counts | Bins with >2000 counts | High rate bins dominated by noise | Noise dominated (total time) | Noise dominated (detector-on time) | Marked lightcurve |
|---|---|---|---|---|---|---|---|
| A | 7544 | 6234 | 599 | 599 | 7.94% | 9.61% | 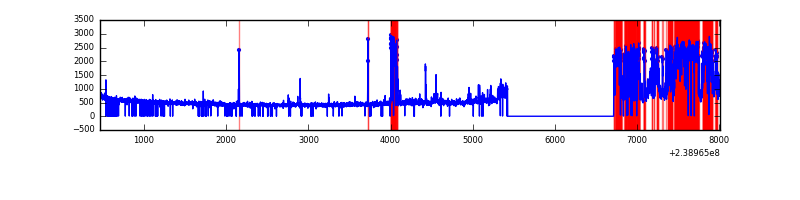 |
| B | 7544 | 6235 | 15 | 15 | 0.20% | 0.24% | 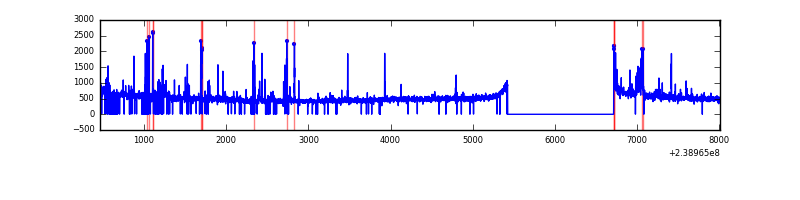 |
| C | 7544 | 6239 | 0 | 0 | 0.00% | 0.00% | 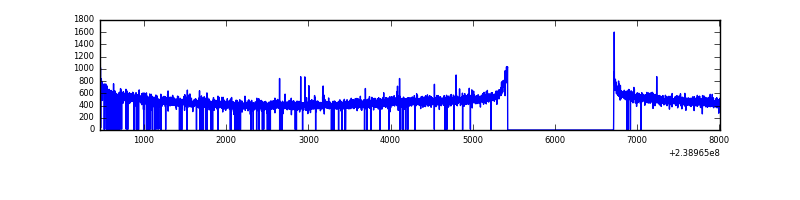 |
| D | 7544 | 6249 | 296 | 296 | 3.92% | 4.74% | 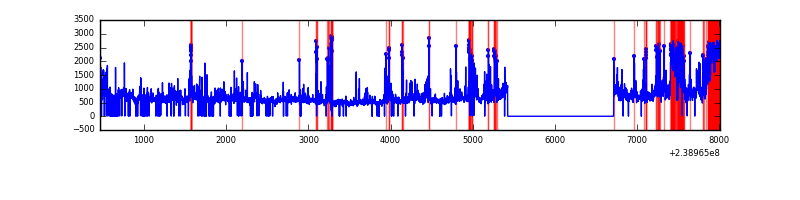 |
Top three noisy pixels from each quadrant. If the there are fewer than three noisy pixels in the level2.evt file, extra rows are filled as -1
| Pixel properties | Quadrant properties | ||||||
|---|---|---|---|---|---|---|---|
| Quadrant | DetID | PixID | Counts | Sigma | Mean | Median | Sigma |
| A | 15 | 239 | 1507888 | 10191.86 | 736 | 722 | 147.9 |
| A | 14 | 254 | 274470 | 1851.16 | 736 | 722 | 147.9 |
| A | 13 | 251 | 16376 | 105.86 | 736 | 722 | 147.9 |
| B | 4 | 239 | 103394 | 707.43 | 766 | 750 | 145.1 |
| B | 4 | 81 | 96154 | 657.53 | 766 | 750 | 145.1 |
| B | 0 | 219 | 43271 | 293.06 | 766 | 750 | 145.1 |
| C | 12 | 4 | 7920 | 41.94 | 736 | 740 | 171.2 |
| C | 13 | 61 | 5597 | 28.37 | 736 | 740 | 171.2 |
| C | 14 | 67 | 5387 | 27.14 | 736 | 740 | 171.2 |
| D | 8 | 195 | 525552 | 2758.15 | 715 | 697 | 190.3 |
| D | 2 | 33 | 473429 | 2484.24 | 715 | 697 | 190.3 |
| D | 2 | 136 | 359253 | 1884.24 | 715 | 697 | 190.3 |
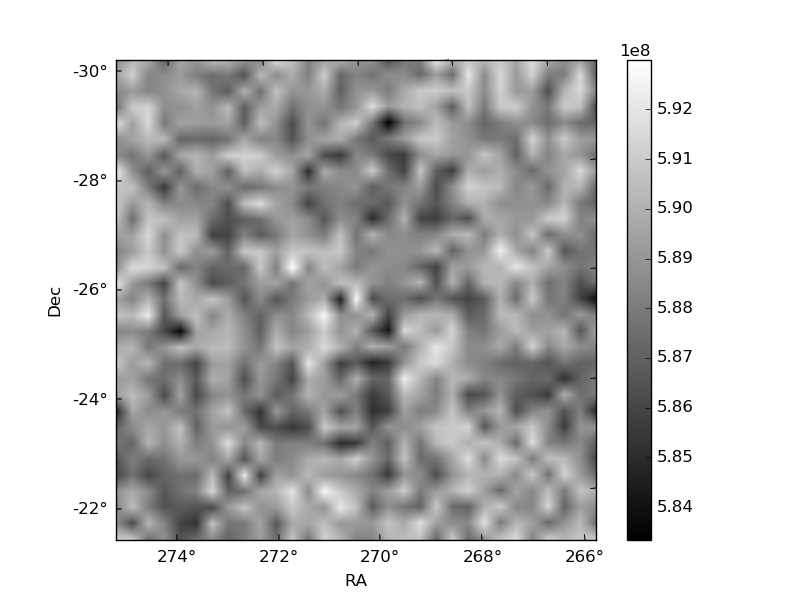
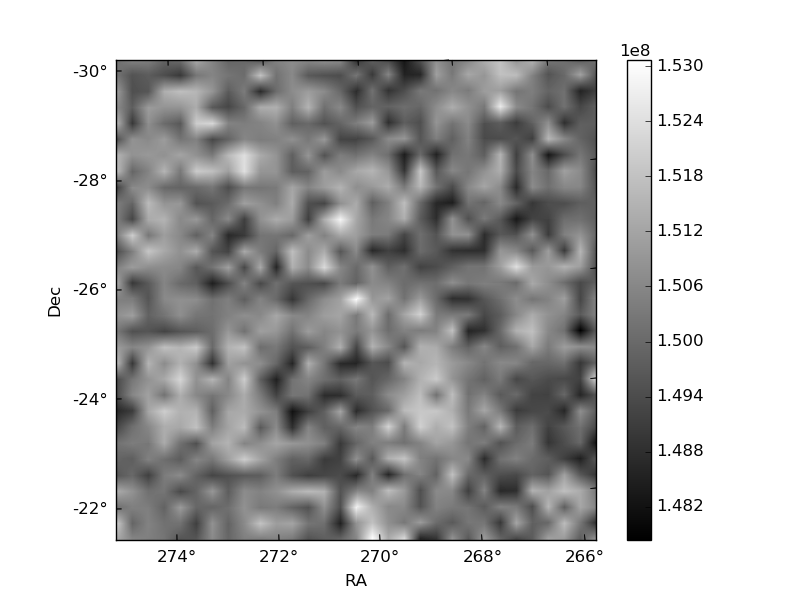
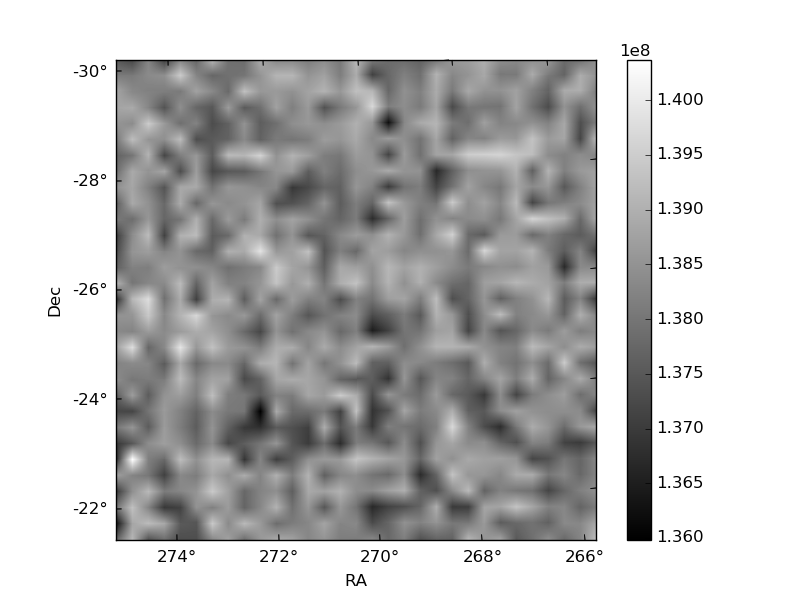
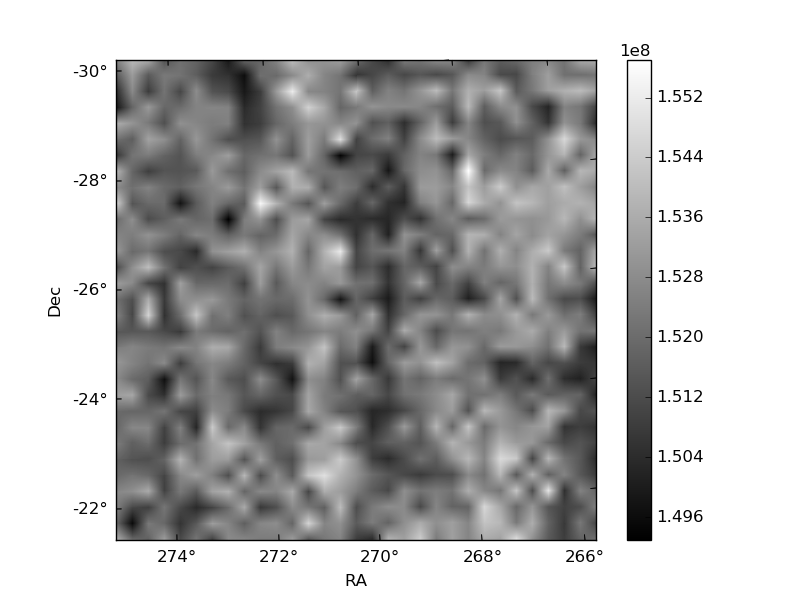
Histogram calculated using DETX and DETY for each event in the final _common_clean file
| Quadrant A | 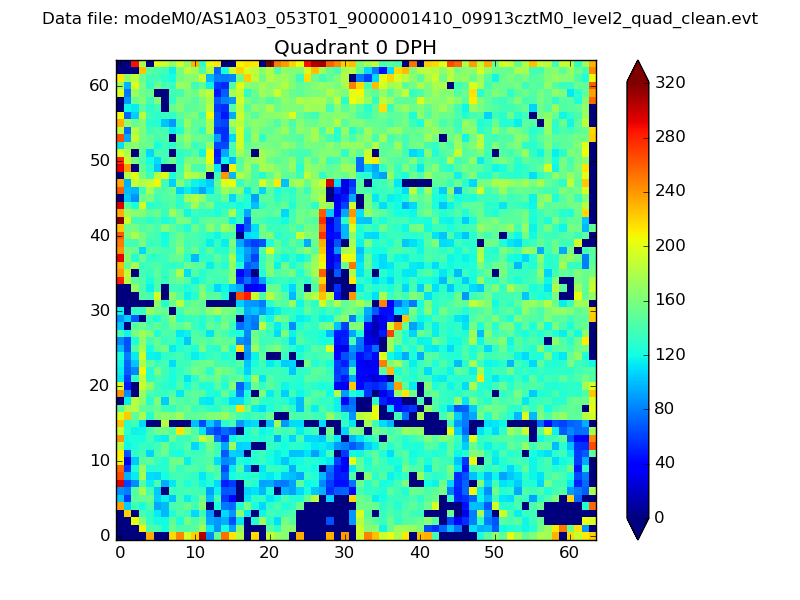 |
 |
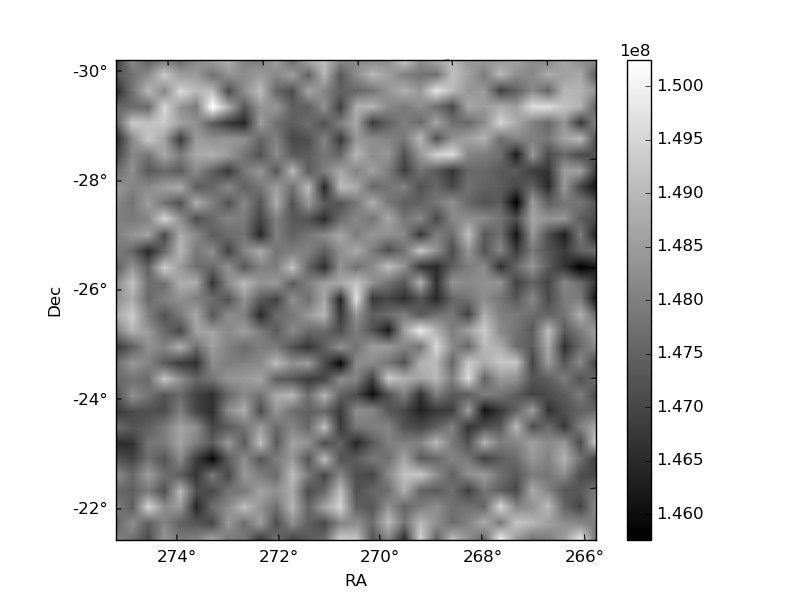
Quadrant B |
|---|---|---|---|
| Quadrant D | 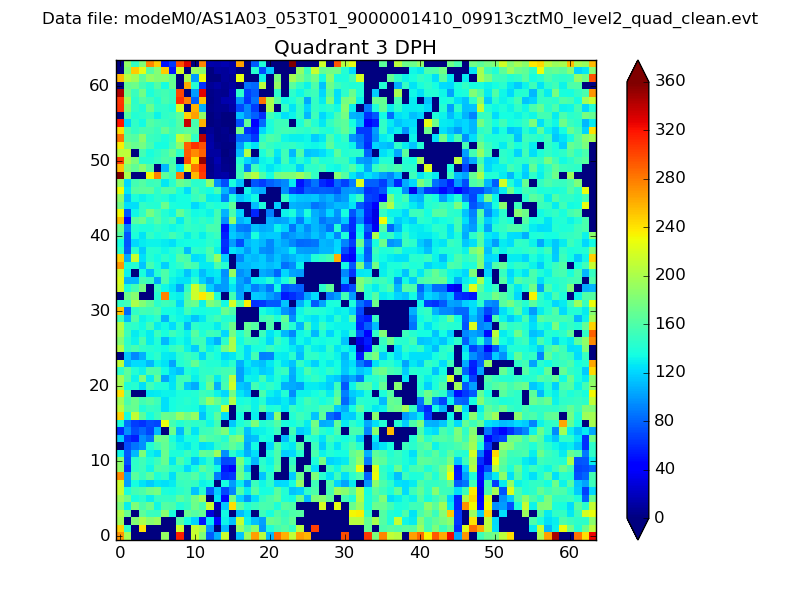 |
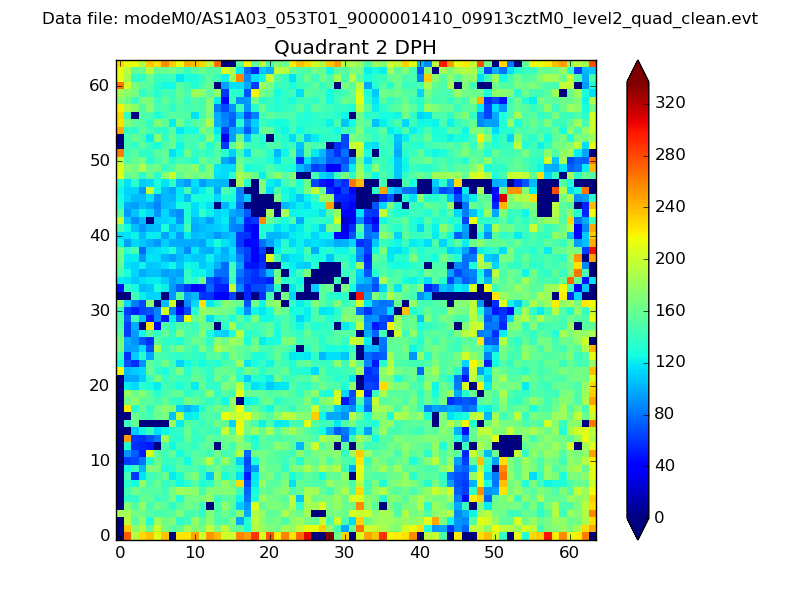 |
Quadrant C |
| Plot type | Count rate plots | Images |
|---|---|---|
| Comparison with Poisson distribution Blue bars denote a histogram of data divided into 1 sec bins. Red curve is a Poisson curve with rate = median count rate of data. |
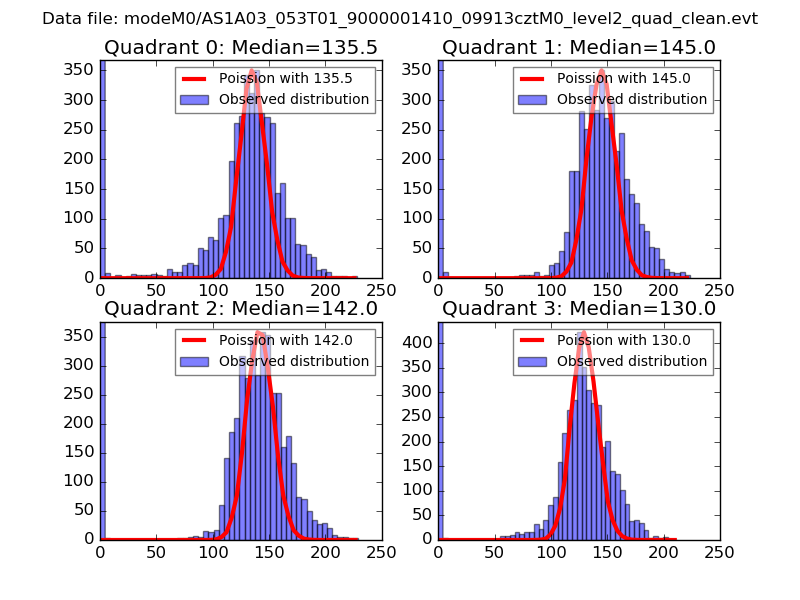 |
 |
| Quadrant-wise count rates Data is divided into 100 sec bins |
 |
|
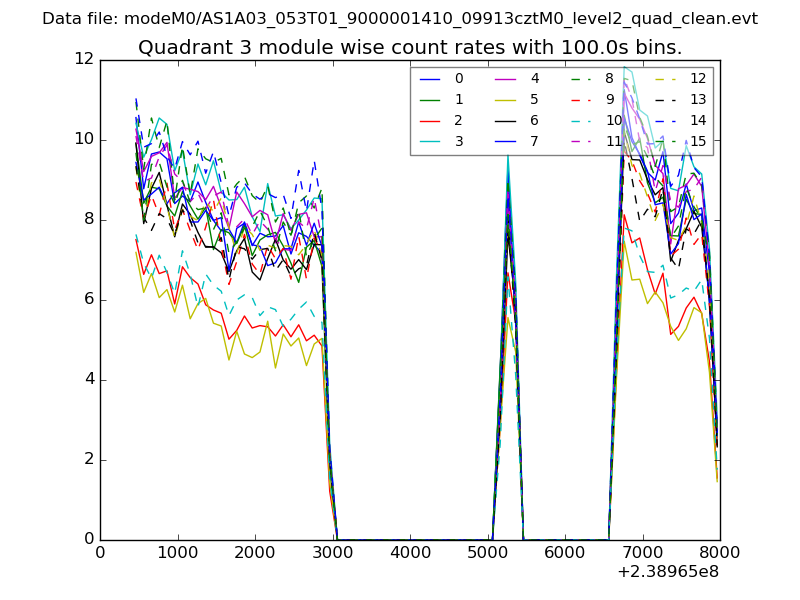
| Module-wise count rates for Quadrant A Data is divided into 100 sec bins |
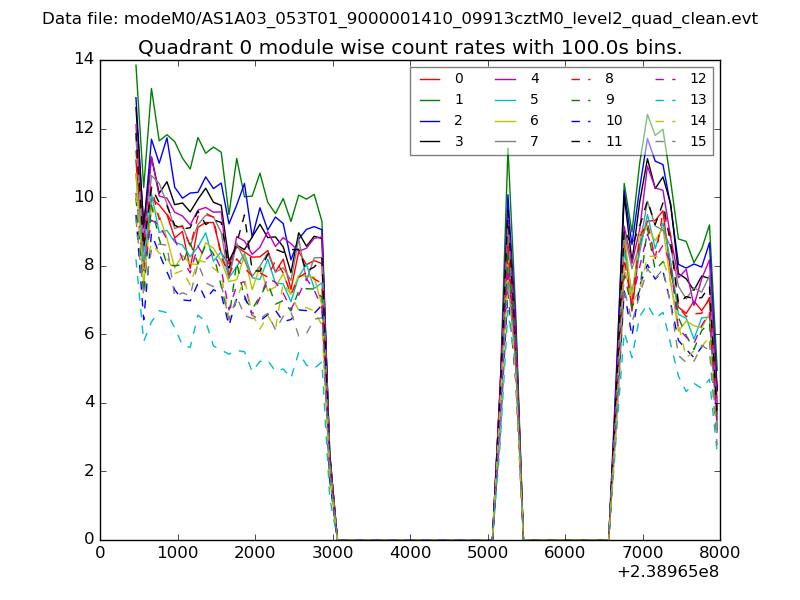 |
 |
| Module-wise count rates for Quadrant B Data is divided into 100 sec bins |
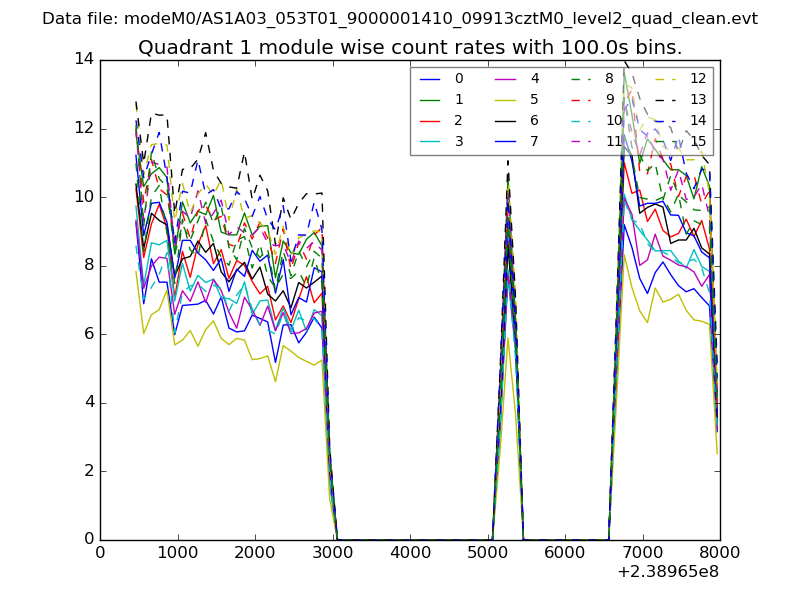 |
 |
| Module-wise count rates for Quadrant C Data is divided into 100 sec bins |
 |
 |
| Module-wise count rates for Quadrant D Data is divided into 100 sec bins |
 |
 |
| Parameter | Plot |
|---|---|
| CZT HV Monitor | 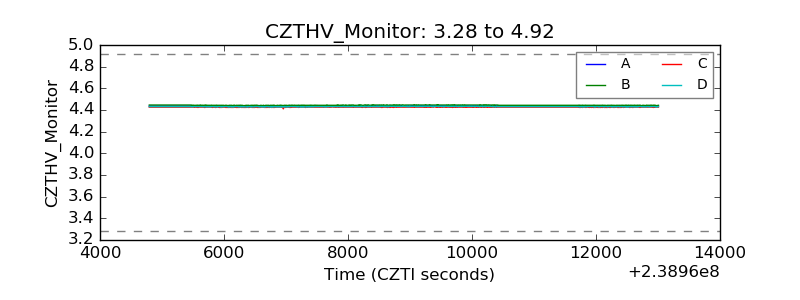 |
| D_VDD | 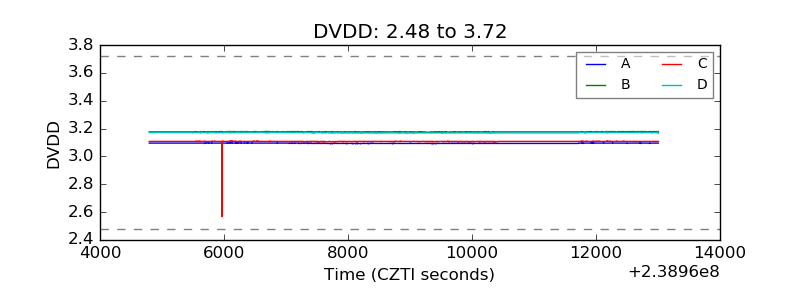 |
| Temperature 1 | 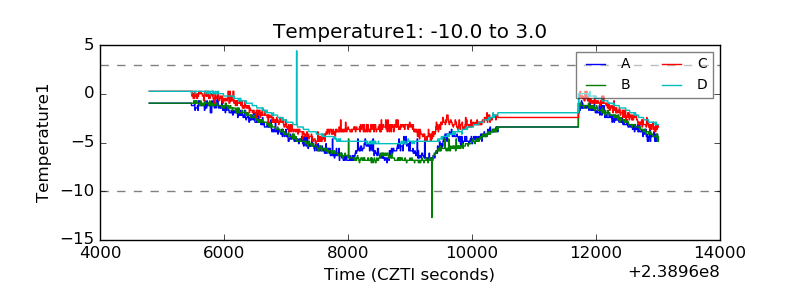 |
| Veto HV Monitor | 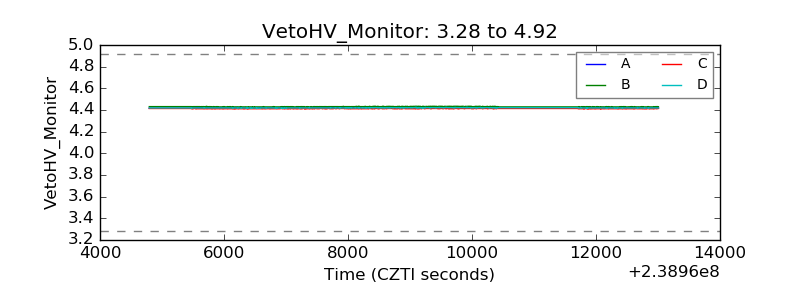 |
| Veto LLD | 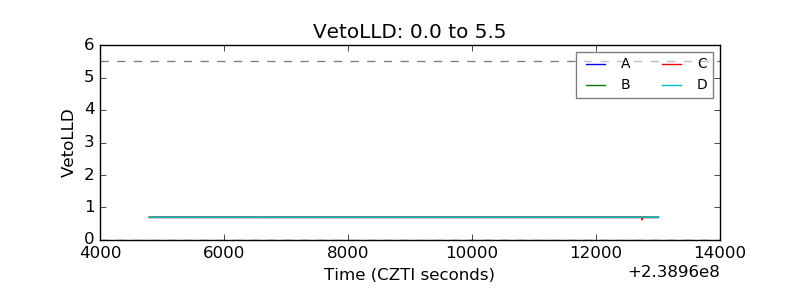 |
| Alpha Counter | 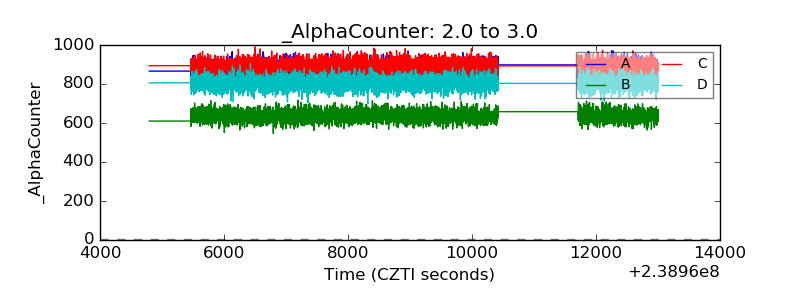 |
| _CPM_Rate | 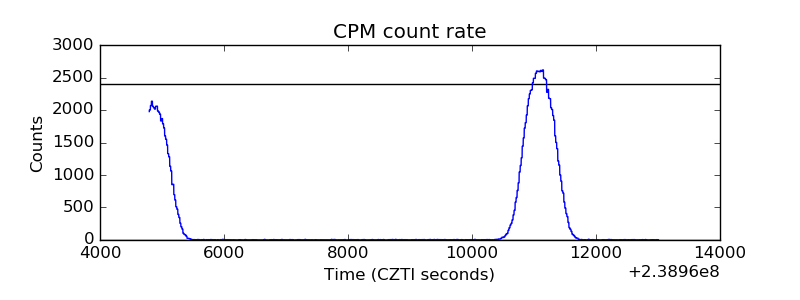 |
| CZT Counter | 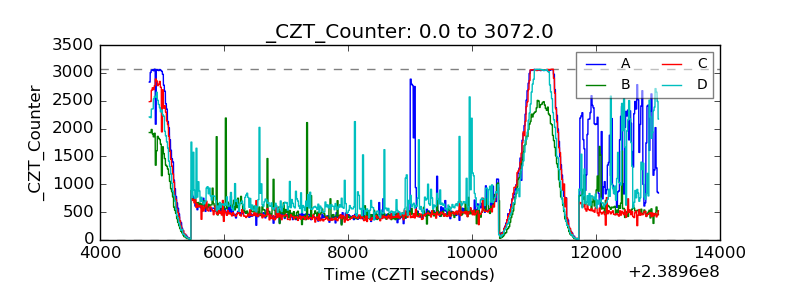 |
| +2.5 Volts monitor |  |
| +5 Volts monitor |  |
| _ROLL_ROT | 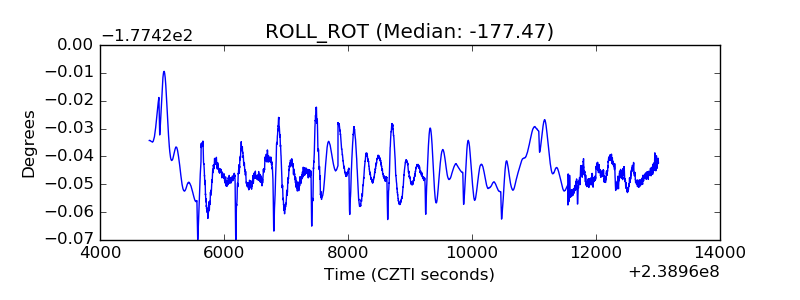 |
| _Roll_DEC | 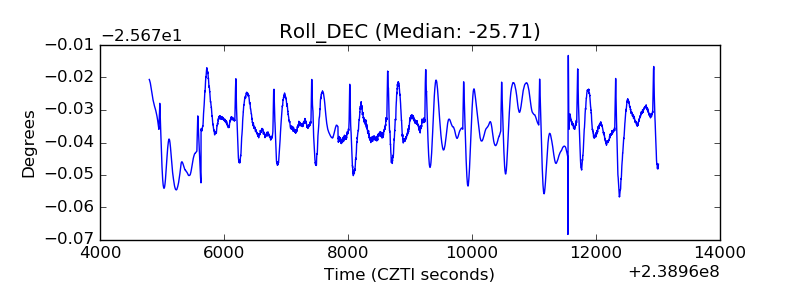 |
| _Roll_RA | 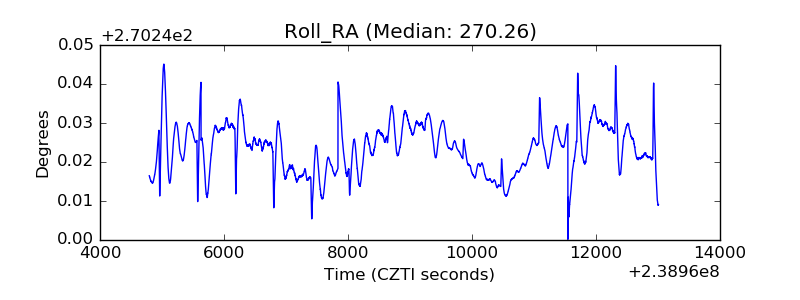 |
| Veto Counter |  |