| Param | Original file | Final file |
|---|---|---|
| Filename | modeM0/AS1A03_053T01_9000001410_09914cztM0_level2.evt | modeM0/AS1A03_053T01_9000001410_09914cztM0_level2_quad_clean.evt |
| Size (bytes) | 503,553,600 | 66,242,880 |
| Size | 480.2 MB | 63.2 MB |
| Events in quadrant A | 4,946,839 | 385,946 |
| Events in quadrant B | 2,703,635 | 444,137 |
| Events in quadrant C | 2,457,984 | 430,658 |
| Events in quadrant D | 4,789,766 | 380,927 |
| Mode M9 | |||
|---|---|---|---|
| Quadrant | BADHDUFLAG | Total packets | Discarded packets |
| A | 0 | 13 | 0 |
| B | 0 | 13 | 0 |
| C | 0 | 13 | 0 |
| D | 0 | 13 | 0 |
| Mode SS | |||
|---|---|---|---|
| Quadrant | BADHDUFLAG | Total packets | Discarded packets |
| A | 0 | 108 | 0 |
| B | 0 | 108 | 0 |
| C | 0 | 108 | 0 |
| D | 0 | 108 | 0 |
| Mode M0 | |||
|---|---|---|---|
| Quadrant | BADHDUFLAG | Total packets | Discarded packets |
| A | 0 | 18217 | 84 |
| B | 0 | 11376 | 8 |
| C | 0 | 10710 | 5 |
| D | 0 | 17769 | 18 |
| Quadrant | Total seconds | Saturated seconds | Saturation percentage |
|---|---|---|---|
| A | 5172 | 761 | 14.713844% |
| B | 5183 | 60 | 1.157631% |
| C | 5184 | 12 | 0.231481% |
| D | 5182 | 540 | 10.420687% |
Noise dominated data is calculated using 1-second bins in cleaned event files. If a bin has >2000 counts, and if more than 50% of those come from <1% of pixels, then it is considered to be noise-dominated and hence unusable.
| Quadrant | # 1 sec bins | Bins with >0 counts | Bins with >2000 counts | High rate bins dominated by noise | Noise dominated (total time) | Noise dominated (detector-on time) | Marked lightcurve |
|---|---|---|---|---|---|---|---|
| A | 6546 | 5185 | 731 | 731 | 11.17% | 14.10% | 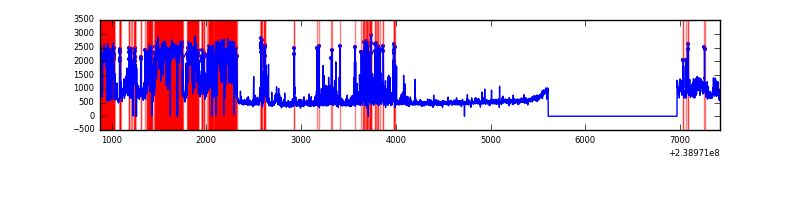 |
| B | 6546 | 5186 | 3 | 3 | 0.05% | 0.06% | 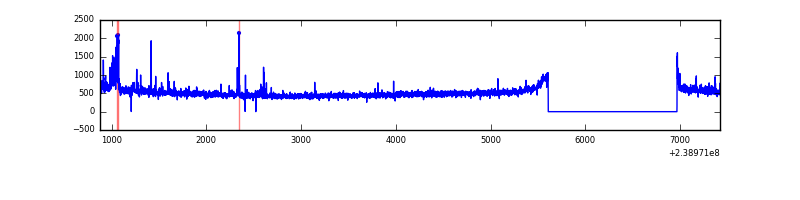 |
| C | 6546 | 5185 | 0 | 0 | 0.00% | 0.00% | 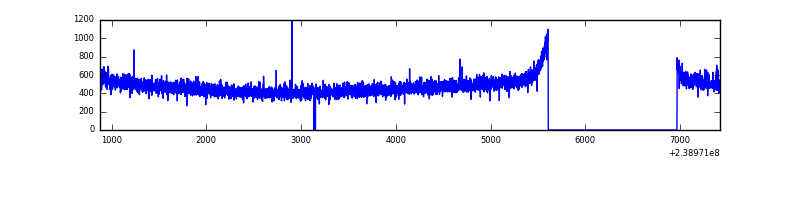 |
| D | 6546 | 5186 | 568 | 568 | 8.68% | 10.95% | 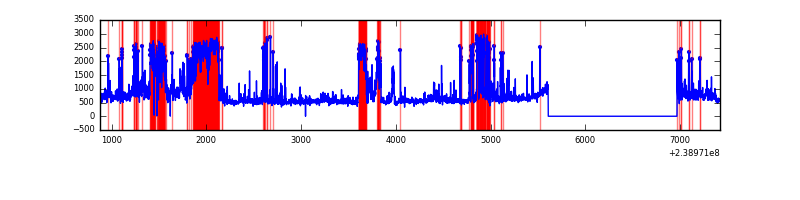 |
Top three noisy pixels from each quadrant. If the there are fewer than three noisy pixels in the level2.evt file, extra rows are filled as -1
| Pixel properties | Quadrant properties | ||||||
|---|---|---|---|---|---|---|---|
| Quadrant | DetID | PixID | Counts | Sigma | Mean | Median | Sigma |
| A | 15 | 239 | 1359908 | 10816.06 | 617 | 605 | 125.7 |
| A | 14 | 254 | 1152374 | 9164.7 | 617 | 605 | 125.7 |
| A | 13 | 251 | 25924 | 201.46 | 617 | 605 | 125.7 |
| B | 4 | 81 | 65774 | 524.55 | 655 | 642 | 124.2 |
| B | 4 | 239 | 30886 | 243.58 | 655 | 642 | 124.2 |
| B | 0 | 219 | 19561 | 152.37 | 655 | 642 | 124.2 |
| C | 10 | 22 | 4874 | 29.03 | 627 | 631 | 146.2 |
| C | 13 | 61 | 4775 | 28.35 | 627 | 631 | 146.2 |
| C | 12 | 4 | 2992 | 16.15 | 627 | 631 | 146.2 |
| D | 2 | 33 | 743817 | 4884.71 | 592 | 576 | 152.2 |
| D | 2 | 136 | 587563 | 3857.78 | 592 | 576 | 152.2 |
| D | 8 | 195 | 480898 | 3156.76 | 592 | 576 | 152.2 |
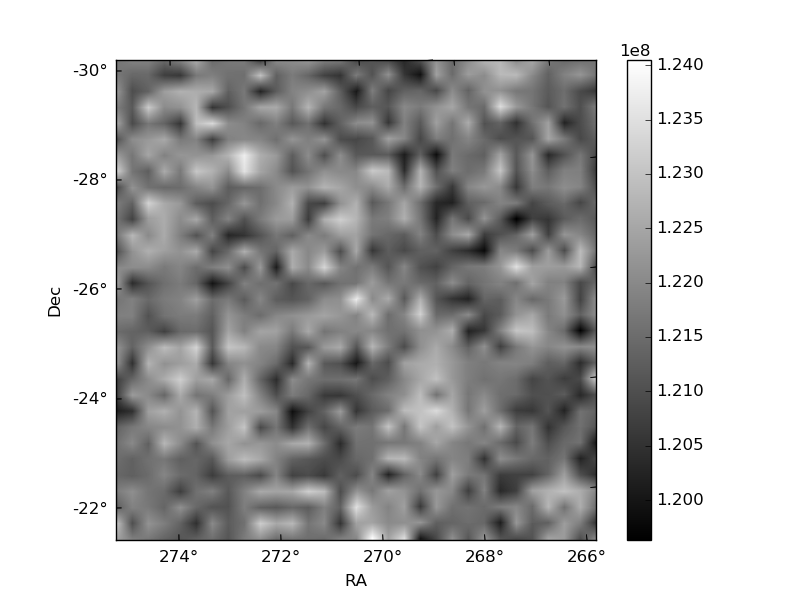
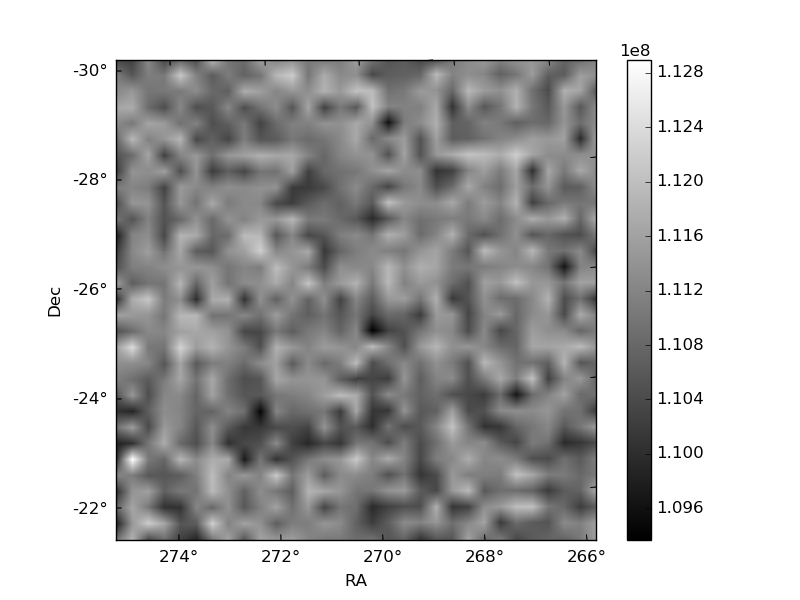
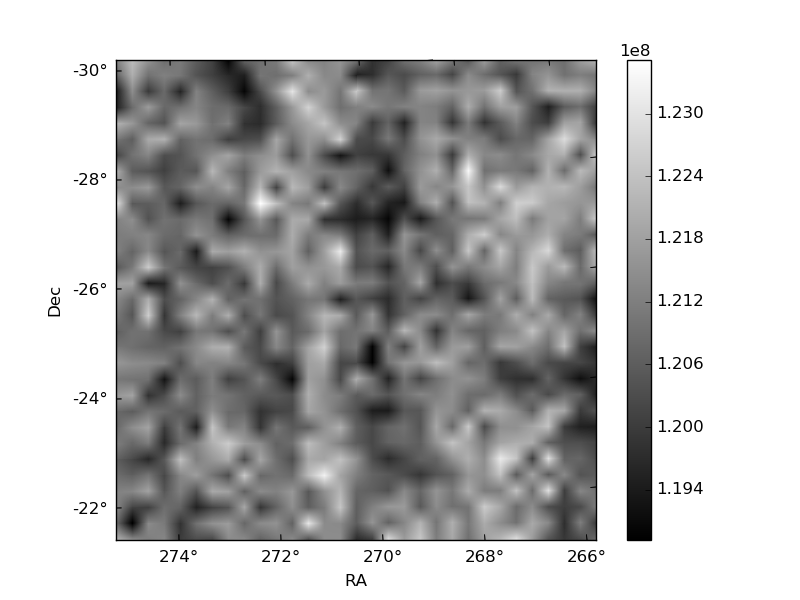
Histogram calculated using DETX and DETY for each event in the final _common_clean file
| Quadrant A | 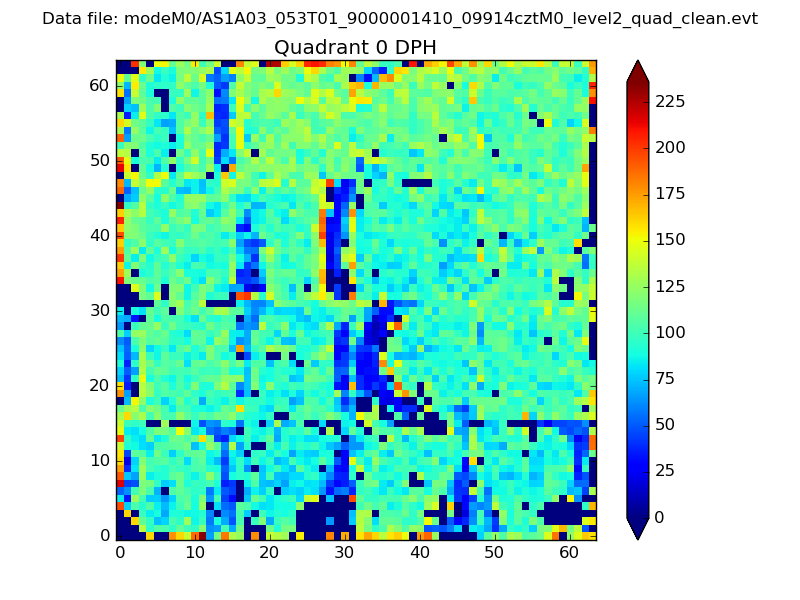 |
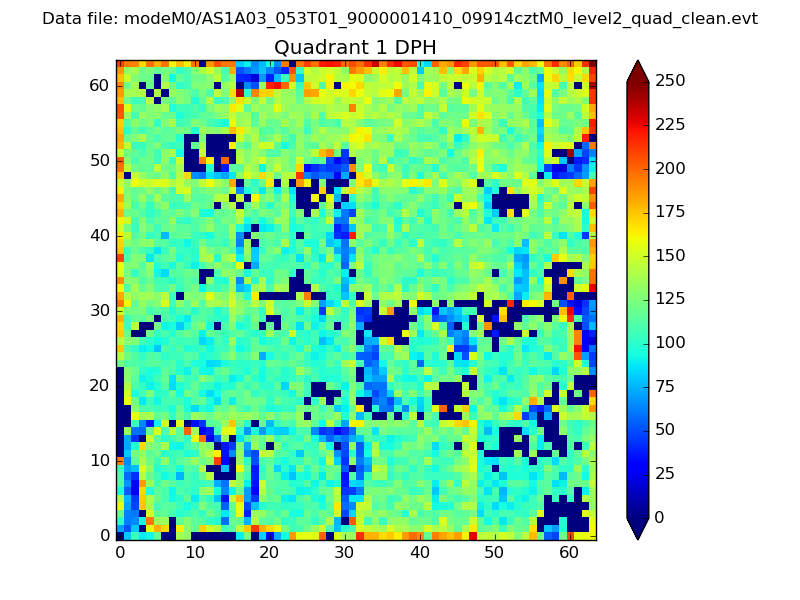 |
Quadrant B |
|---|---|---|---|
| Quadrant D | 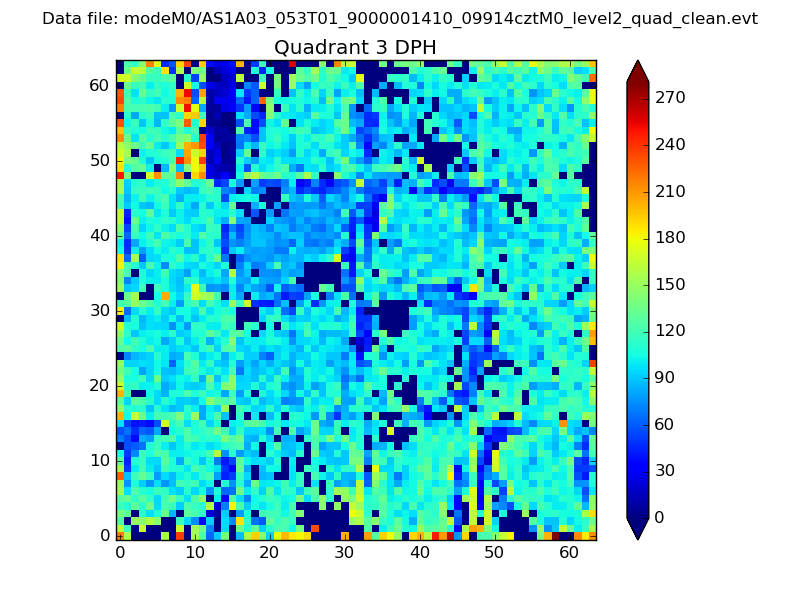 |
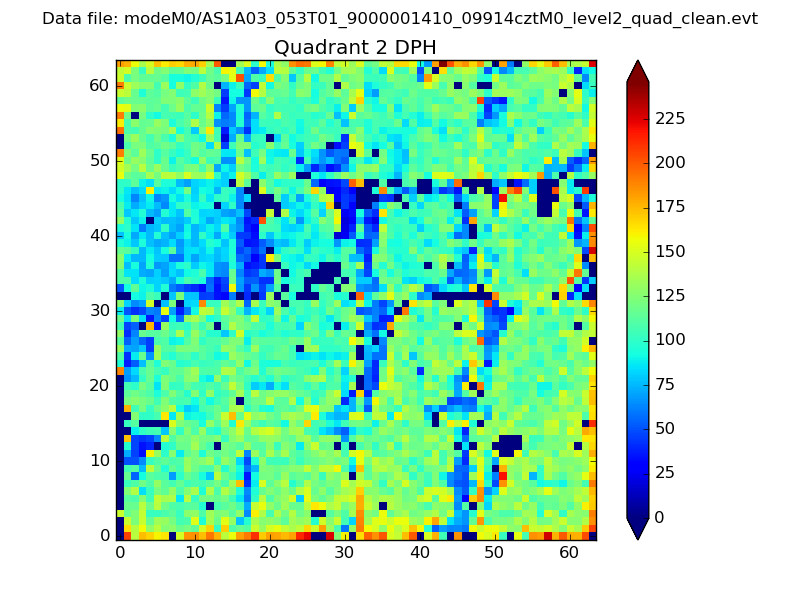 |
Quadrant C |
| Plot type | Count rate plots | Images |
|---|---|---|
| Comparison with Poisson distribution Blue bars denote a histogram of data divided into 1 sec bins. Red curve is a Poisson curve with rate = median count rate of data. |
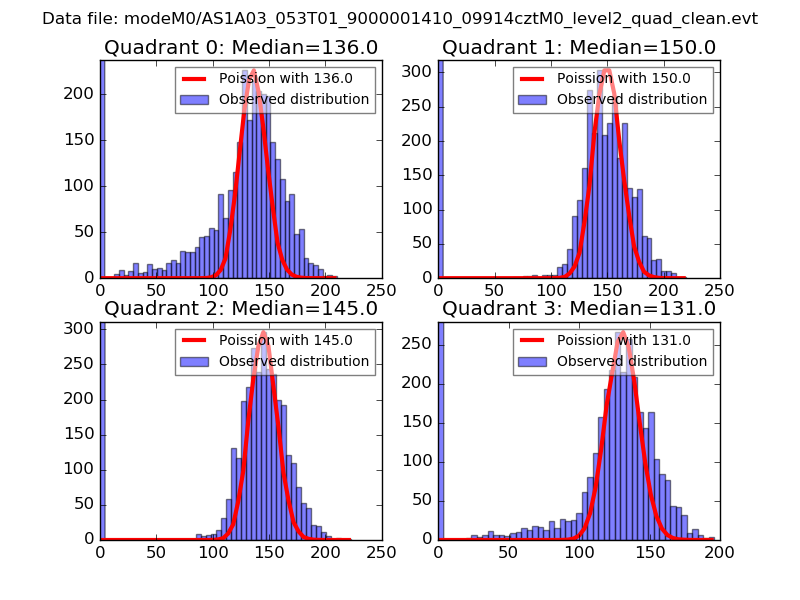 |
 |
| Quadrant-wise count rates Data is divided into 100 sec bins |
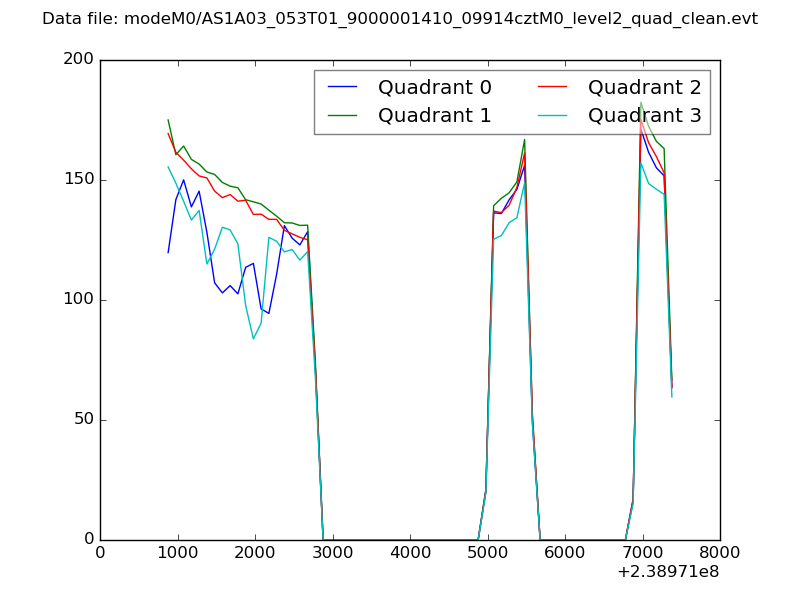 |
|
| Module-wise count rates for Quadrant A Data is divided into 100 sec bins |
 |
 |
| Module-wise count rates for Quadrant B Data is divided into 100 sec bins |
 |
 |
| Module-wise count rates for Quadrant C Data is divided into 100 sec bins |
 |
 |
| Module-wise count rates for Quadrant D Data is divided into 100 sec bins |
 |
 |
| Parameter | Plot |
|---|---|
| CZT HV Monitor |  |
| D_VDD | 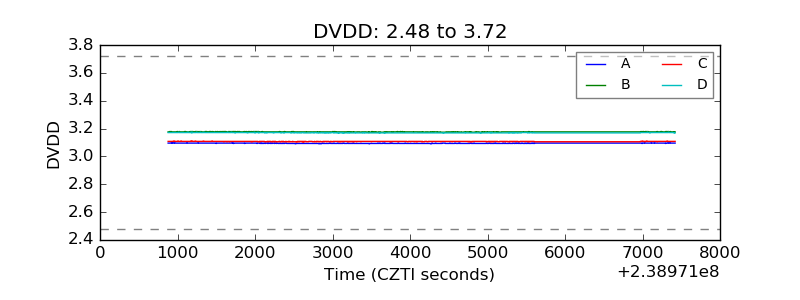 |
| Temperature 1 | 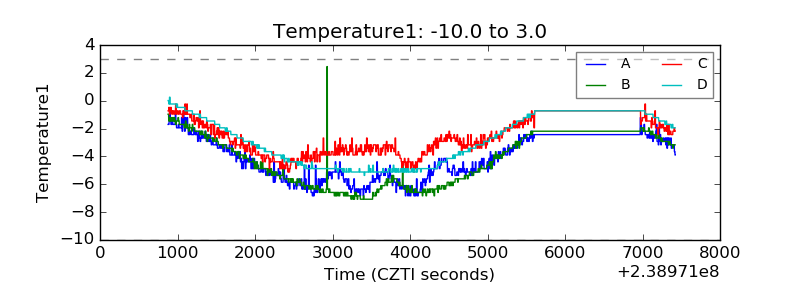 |
| Veto HV Monitor | 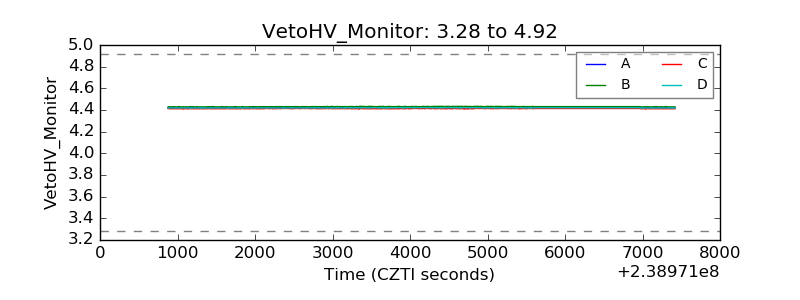 |
| Veto LLD |  |
| Alpha Counter | 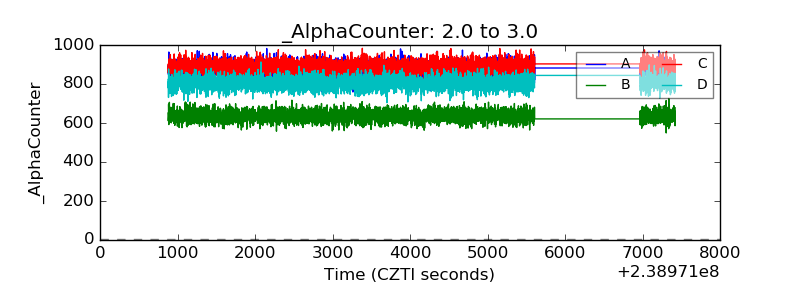 |
| _CPM_Rate | 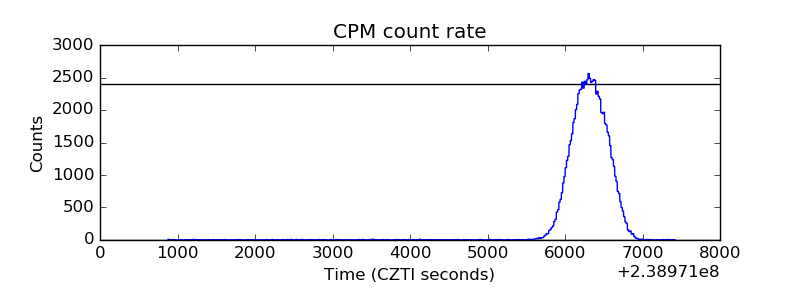 |
| CZT Counter | 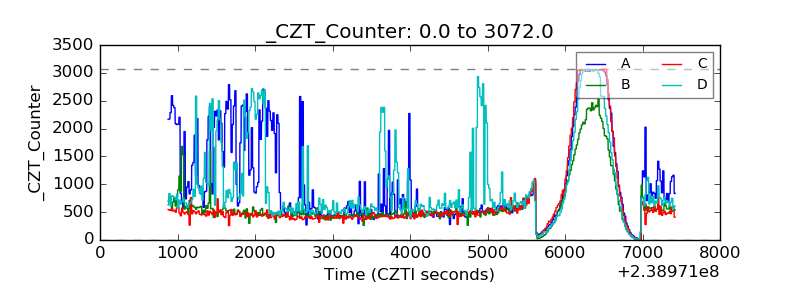 |
| +2.5 Volts monitor |  |
| +5 Volts monitor |  |
| _ROLL_ROT | 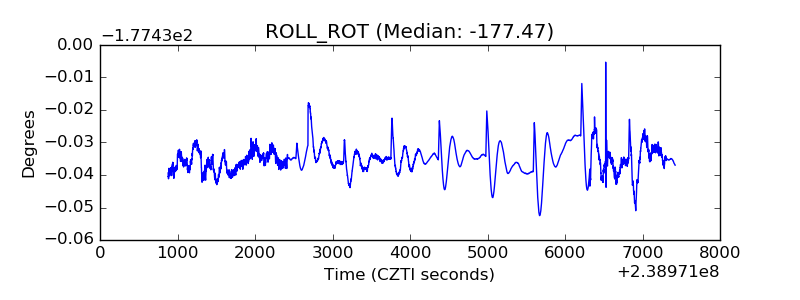 |
| _Roll_DEC | 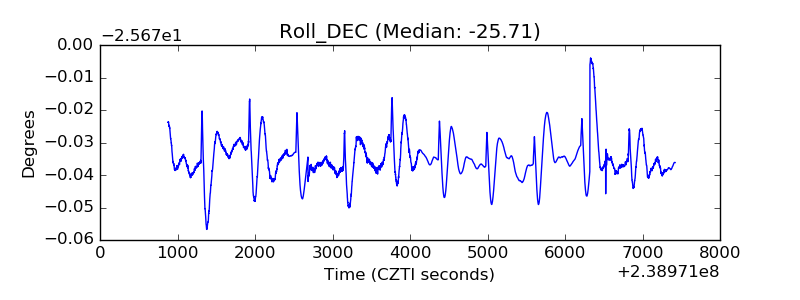 |
| _Roll_RA | 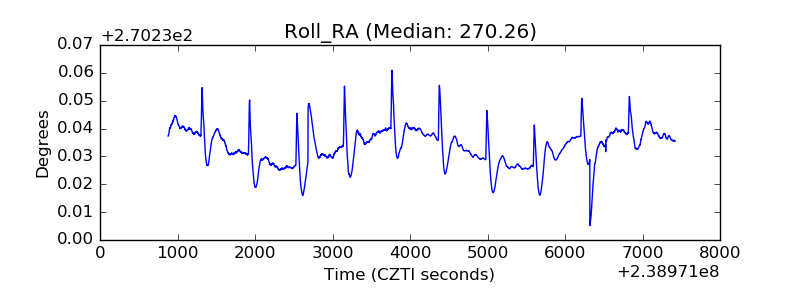 |
| Veto Counter |  |