| Param | Original file | Final file |
|---|---|---|
| Filename | modeM0/AS1A03_053T01_9000001410_09915cztM0_level2.evt | modeM0/AS1A03_053T01_9000001410_09915cztM0_level2_quad_clean.evt |
| Size (bytes) | 44,743,680 | 10,635,840 |
| Size | 42.7 MB | 10.1 MB |
| Events in quadrant A | 443,017 | 69,782 |
| Events in quadrant B | 271,708 | 75,529 |
| Events in quadrant C | 240,094 | 72,050 |
| Events in quadrant D | 366,593 | 65,177 |
| Mode M9 | |||
|---|---|---|---|
| Quadrant | BADHDUFLAG | Total packets | Discarded packets |
| A | 0 | 7 | 0 |
| B | 0 | 7 | 0 |
| C | 0 | 7 | 0 |
| D | 0 | 8 | 0 |
| Mode SS | |||
|---|---|---|---|
| Quadrant | BADHDUFLAG | Total packets | Discarded packets |
| A | 0 | 10 | 2 |
| B | 0 | 10 | 0 |
| C | 0 | 10 | 0 |
| D | 0 | 10 | 0 |
| Mode M0 | |||
|---|---|---|---|
| Quadrant | BADHDUFLAG | Total packets | Discarded packets |
| A | 0 | 1684 | 55 |
| B | 0 | 1128 | 24 |
| C | 0 | 995 | 21 |
| D | 0 | 1469 | 41 |
| Quadrant | Total seconds | Saturated seconds | Saturation percentage |
|---|---|---|---|
| A | 440 | 13 | 2.954545% |
| B | 446 | 5 | 1.121076% |
| C | 445 | 1 | 0.224719% |
| D | 443 | 12 | 2.708804% |
Noise dominated data is calculated using 1-second bins in cleaned event files. If a bin has >2000 counts, and if more than 50% of those come from <1% of pixels, then it is considered to be noise-dominated and hence unusable.
| Quadrant | # 1 sec bins | Bins with >0 counts | Bins with >2000 counts | High rate bins dominated by noise | Noise dominated (total time) | Noise dominated (detector-on time) | Marked lightcurve |
|---|---|---|---|---|---|---|---|
| A | 453 | 450 | 6 | 6 | 1.32% | 1.33% | 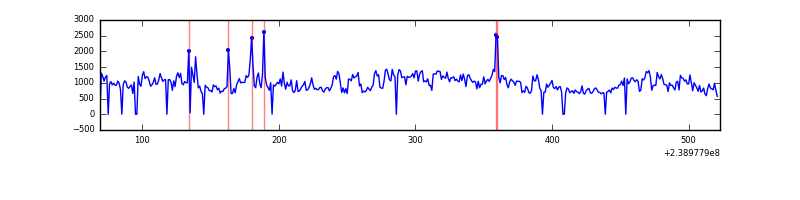 |
| B | 453 | 450 | 0 | 0 | 0.00% | 0.00% | 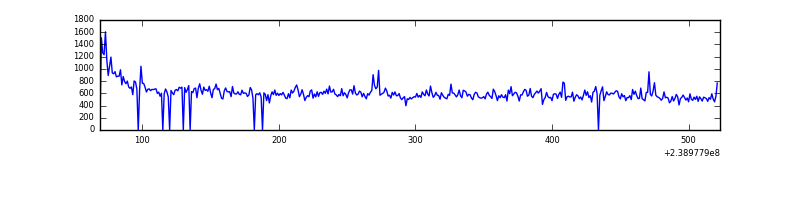 |
| C | 453 | 450 | 0 | 0 | 0.00% | 0.00% | 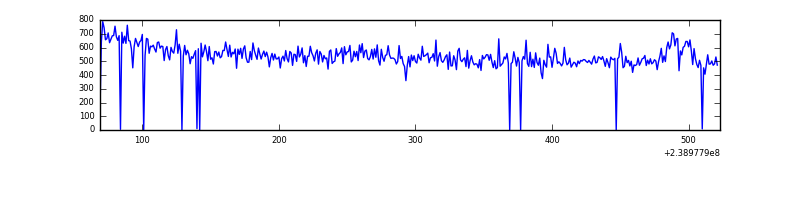 |
| D | 453 | 451 | 9 | 9 | 1.99% | 2.00% | 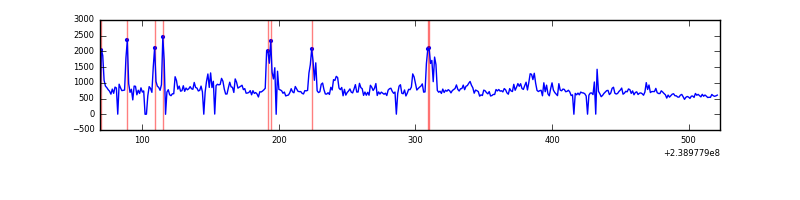 |
Top three noisy pixels from each quadrant. If the there are fewer than three noisy pixels in the level2.evt file, extra rows are filled as -1
| Pixel properties | Quadrant properties | ||||||
|---|---|---|---|---|---|---|---|
| Quadrant | DetID | PixID | Counts | Sigma | Mean | Median | Sigma |
| A | 15 | 239 | 202293 | 13896.06 | 62 | 61 | 14.6 |
| A | 0 | 226 | 606 | 37.45 | 62 | 61 | 14.6 |
| A | 12 | 194 | 516 | 31.26 | 62 | 61 | 14.6 |
| B | 15 | 85 | 8356 | 590.39 | 64 | 63 | 14.0 |
| B | 4 | 173 | 6239 | 439.68 | 64 | 63 | 14.0 |
| B | 4 | 239 | 3220 | 224.75 | 64 | 63 | 14.0 |
| C | 10 | 22 | 3109 | 194.32 | 60 | 60 | 15.7 |
| C | 14 | 67 | 803 | 47.35 | 60 | 60 | 15.7 |
| C | 7 | 159 | 515 | 29.0 | 60 | 60 | 15.7 |
| D | 2 | 33 | 52952 | 3328.1 | 58 | 56 | 15.9 |
| D | 8 | 195 | 39575 | 2486.45 | 58 | 56 | 15.9 |
| D | 12 | 221 | 15678 | 982.9 | 58 | 56 | 15.9 |
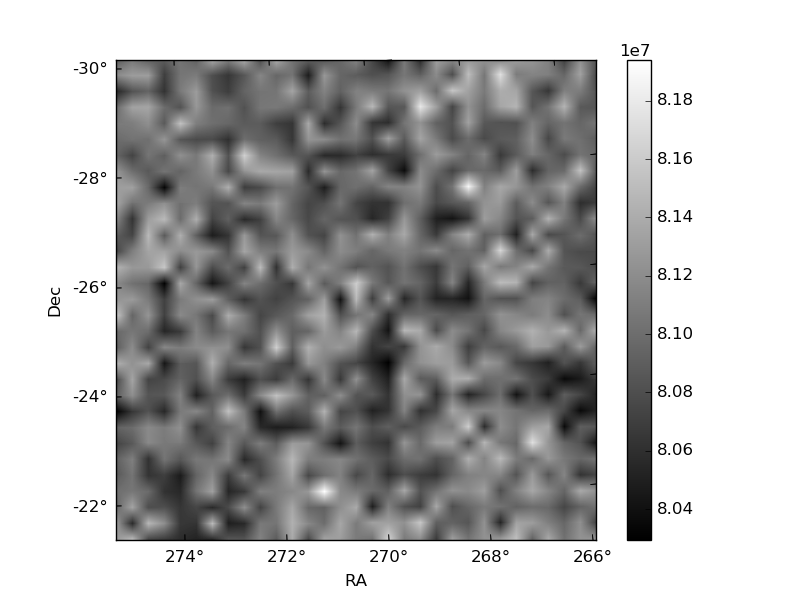
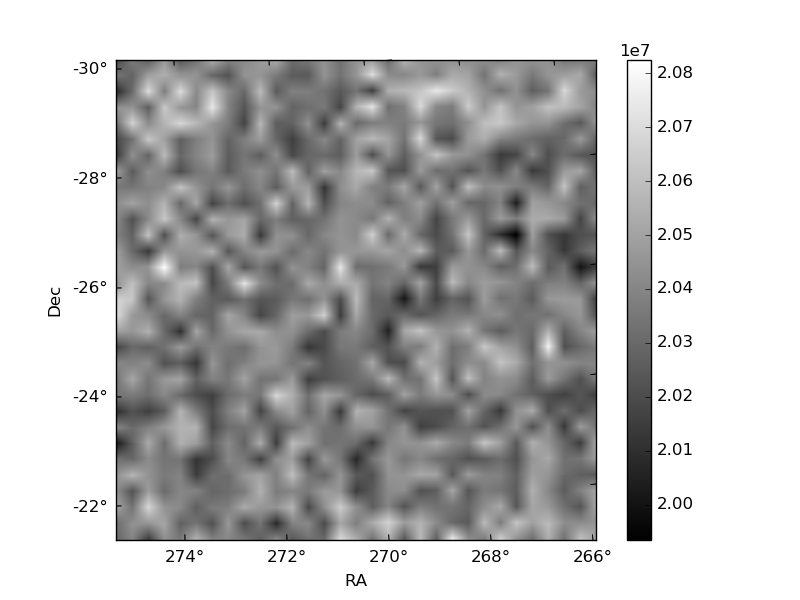
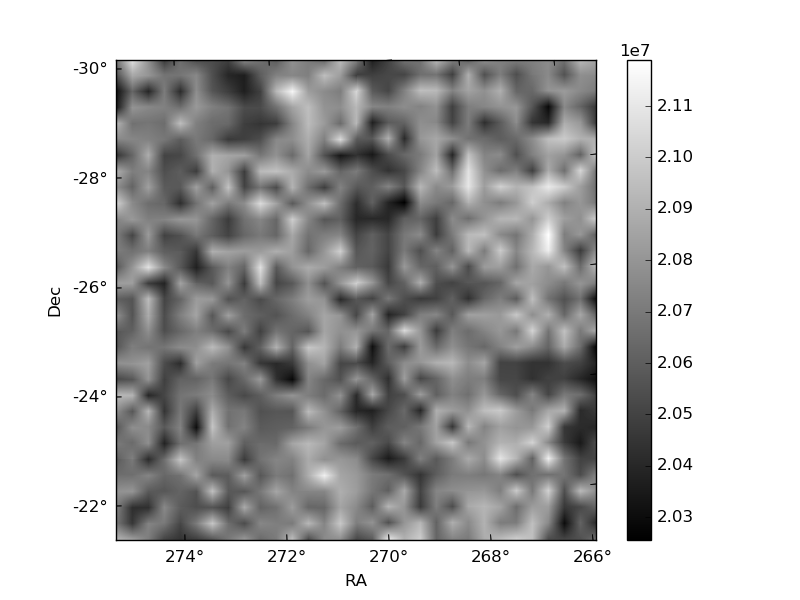
Histogram calculated using DETX and DETY for each event in the final _common_clean file
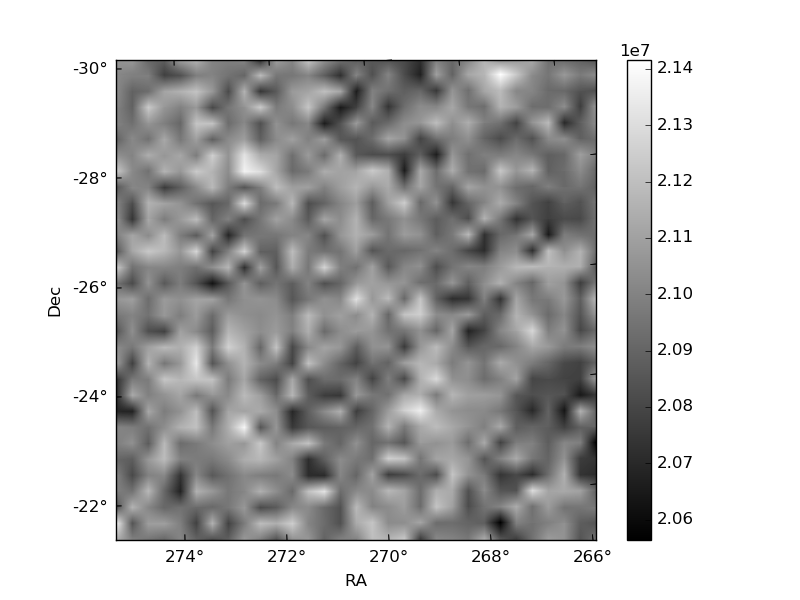
| Quadrant A | 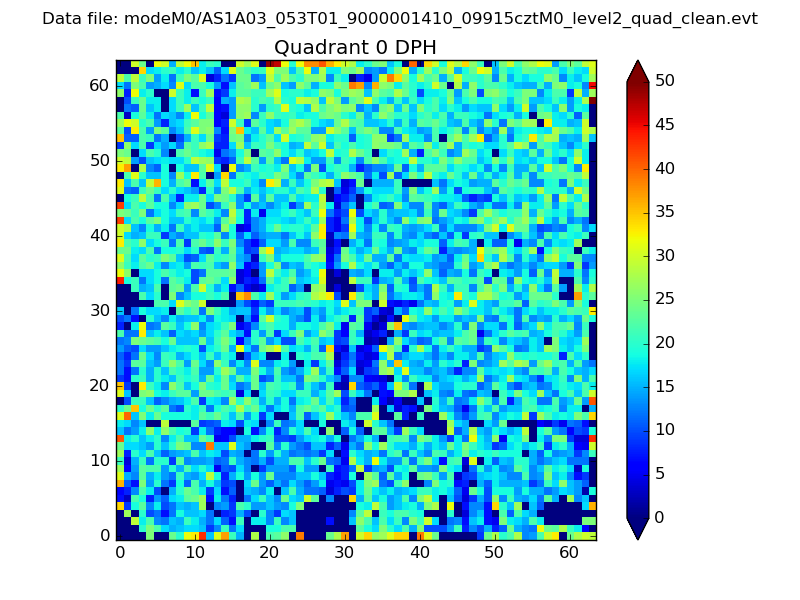 |
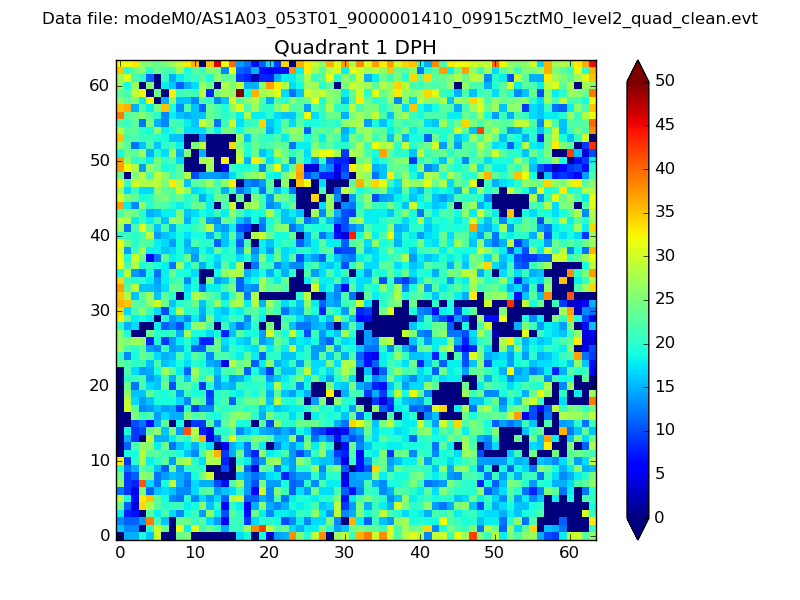 |
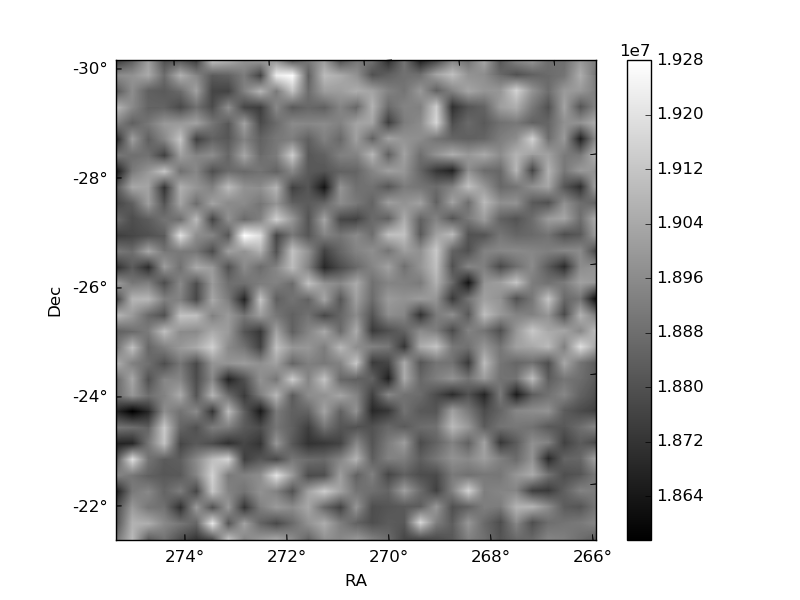
Quadrant B |
|---|---|---|---|
| Quadrant D | 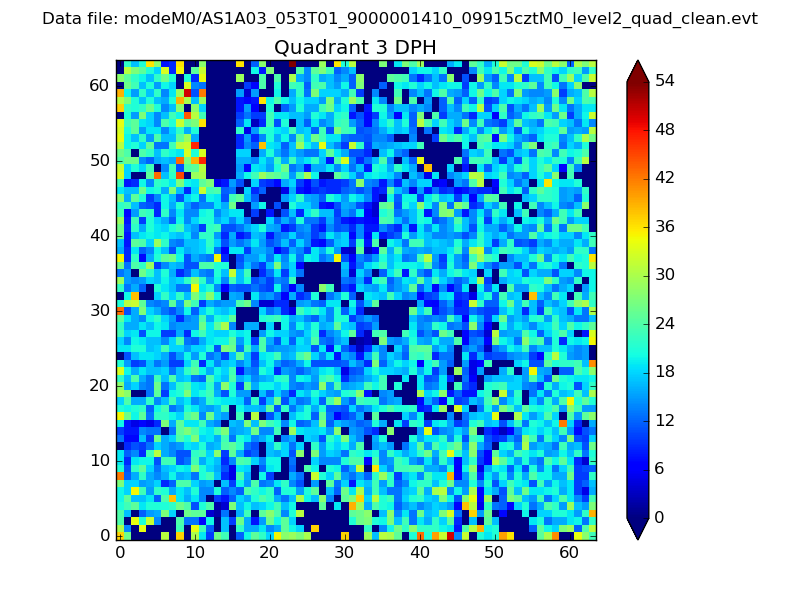 |
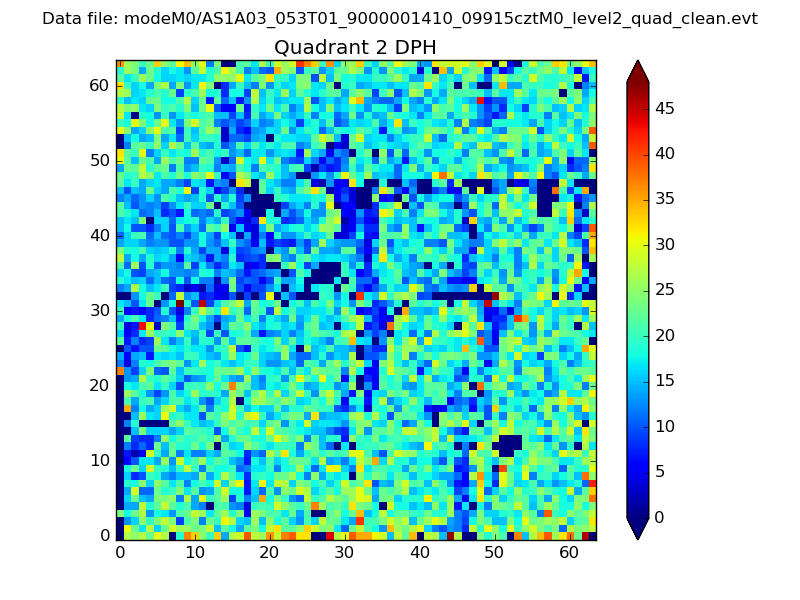 |
Quadrant C |
| Plot type | Count rate plots | Images |
|---|---|---|
| Comparison with Poisson distribution Blue bars denote a histogram of data divided into 1 sec bins. Red curve is a Poisson curve with rate = median count rate of data. |
 |
 |
| Quadrant-wise count rates Data is divided into 100 sec bins |
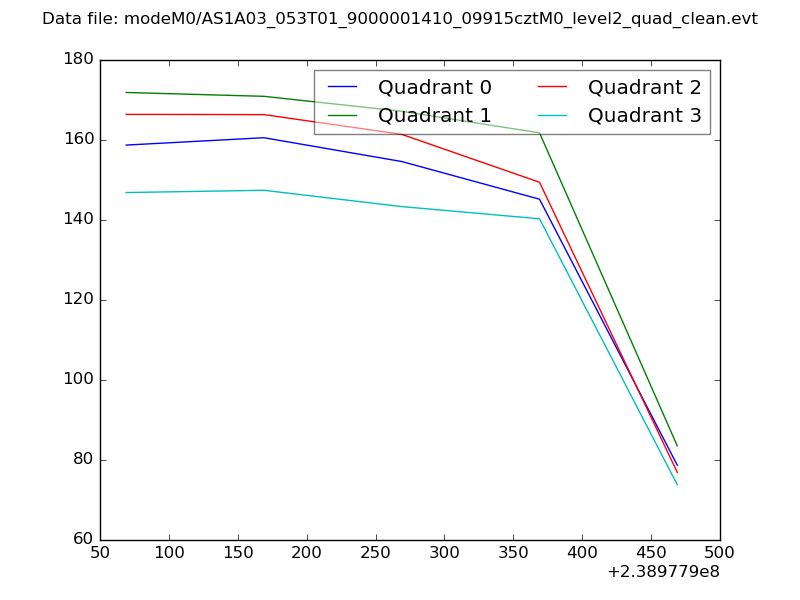 |
|
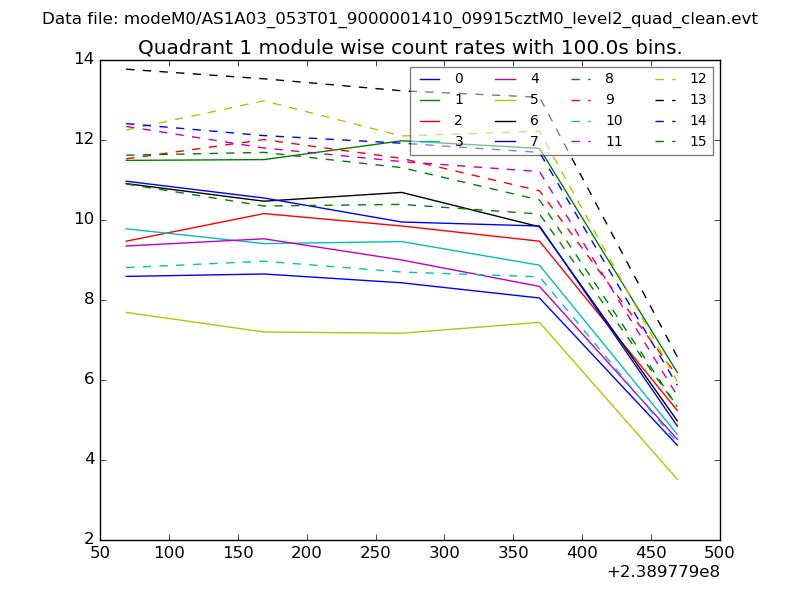
| Module-wise count rates for Quadrant A Data is divided into 100 sec bins |
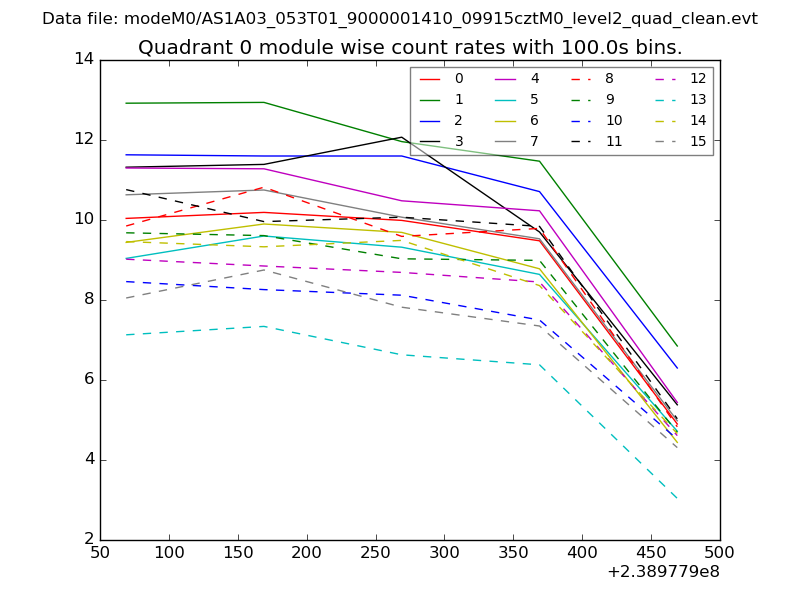 |
 |
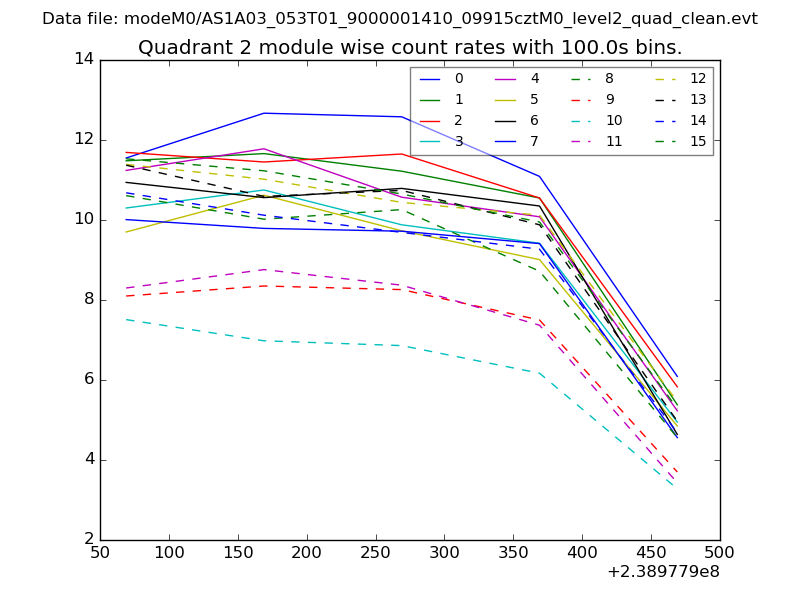
| Module-wise count rates for Quadrant B Data is divided into 100 sec bins |
 |
 |
| Module-wise count rates for Quadrant C Data is divided into 100 sec bins |
 |
 |
| Module-wise count rates for Quadrant D Data is divided into 100 sec bins |
 |
 |
| Parameter | Plot |
|---|---|
| CZT HV Monitor | 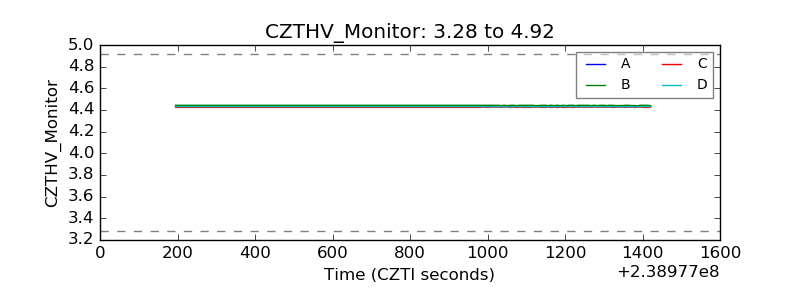 |
| D_VDD | 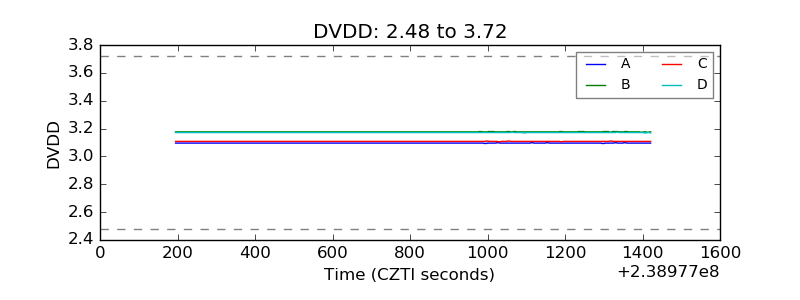 |
| Temperature 1 |  |
| Veto HV Monitor | 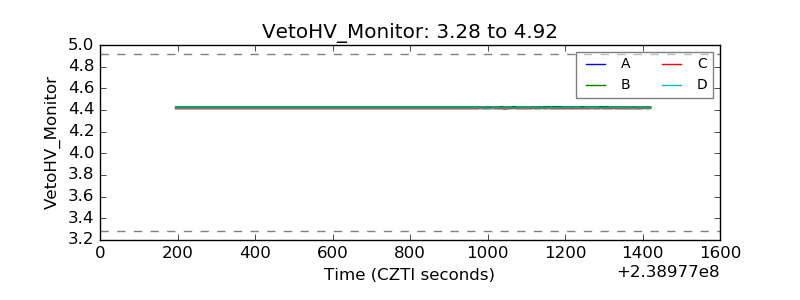 |
| Veto LLD | 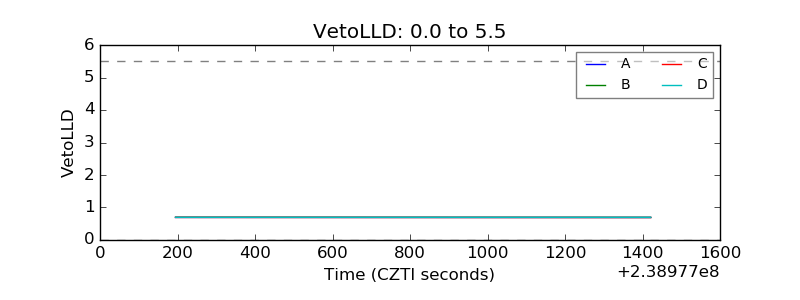 |
| Alpha Counter | 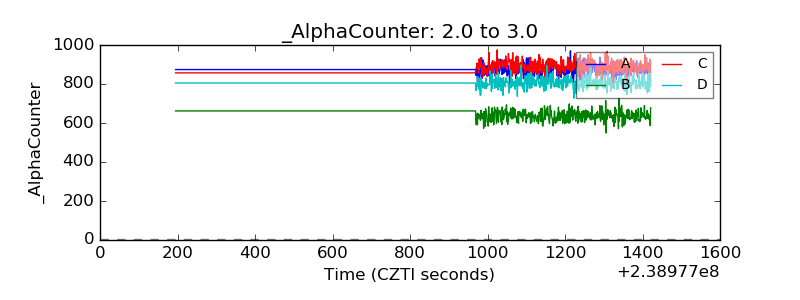 |
| _CPM_Rate | 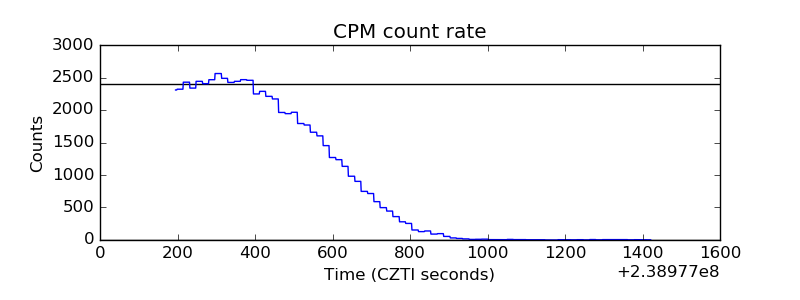 |
| CZT Counter | 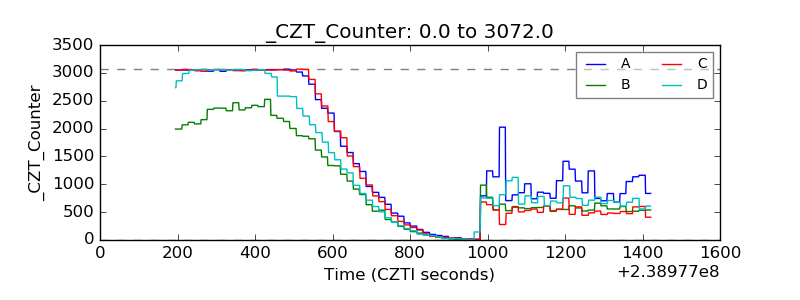 |
| +2.5 Volts monitor |  |
| +5 Volts monitor |  |
| _ROLL_ROT | 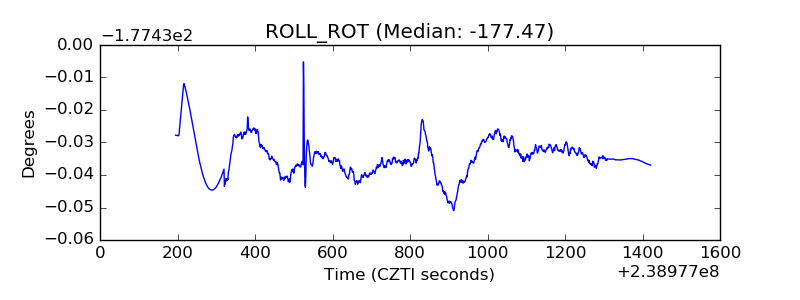 |
| _Roll_DEC |  |
| _Roll_RA | 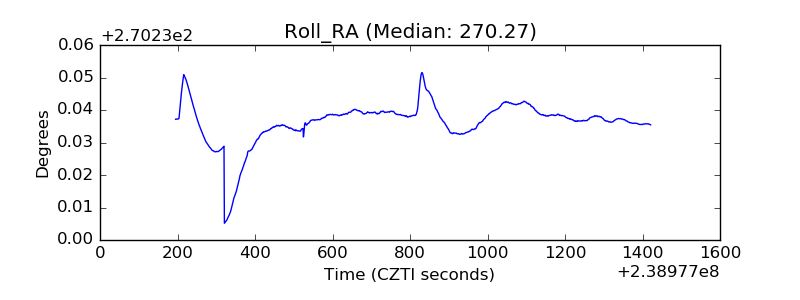 |
| Veto Counter | 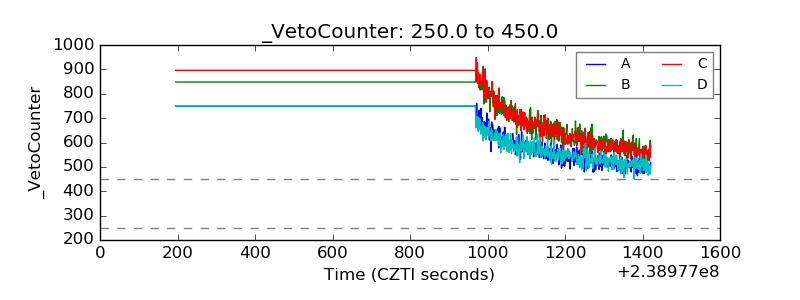 |