| Param | Original file | Final file |
|---|---|---|
| Filename | modeM0/AS1A02_029T01_9000001416_09927cztM0_level2.evt | modeM0/AS1A02_029T01_9000001416_09927cztM0_level2_quad_clean.evt |
| Size (bytes) | 514,293,120 | 89,337,600 |
| Size | 490.5 MB | 85.2 MB |
| Events in quadrant A | 3,353,034 | 584,492 |
| Events in quadrant B | 3,405,040 | 592,756 |
| Events in quadrant C | 2,971,521 | 579,230 |
| Events in quadrant D | 5,412,196 | 502,843 |
| Mode M9 | |||
|---|---|---|---|
| Quadrant | BADHDUFLAG | Total packets | Discarded packets |
| A | 0 | 16 | 0 |
| B | 0 | 16 | 0 |
| C | 0 | 16 | 0 |
| D | 0 | 17 | 0 |
| Mode SS | |||
|---|---|---|---|
| Quadrant | BADHDUFLAG | Total packets | Discarded packets |
| A | 0 | 132 | 0 |
| B | 0 | 132 | 0 |
| C | 0 | 132 | 0 |
| D | 0 | 132 | 0 |
| Mode M0 | |||
|---|---|---|---|
| Quadrant | BADHDUFLAG | Total packets | Discarded packets |
| A | 0 | 14127 | 7 |
| B | 0 | 14267 | 5 |
| C | 0 | 13202 | 2 |
| D | 0 | 20388 | 6 |
| Quadrant | Total seconds | Saturated seconds | Saturation percentage |
|---|---|---|---|
| A | 6383 | 78 | 1.221996% |
| B | 6384 | 94 | 1.472431% |
| C | 6385 | 39 | 0.610807% |
| D | 6384 | 508 | 7.957393% |
Noise dominated data is calculated using 1-second bins in cleaned event files. If a bin has >2000 counts, and if more than 50% of those come from <1% of pixels, then it is considered to be noise-dominated and hence unusable.
| Quadrant | # 1 sec bins | Bins with >0 counts | Bins with >2000 counts | High rate bins dominated by noise | Noise dominated (total time) | Noise dominated (detector-on time) | Marked lightcurve |
|---|---|---|---|---|---|---|---|
| A | 7625 | 6385 | 1 | 1 | 0.01% | 0.02% | 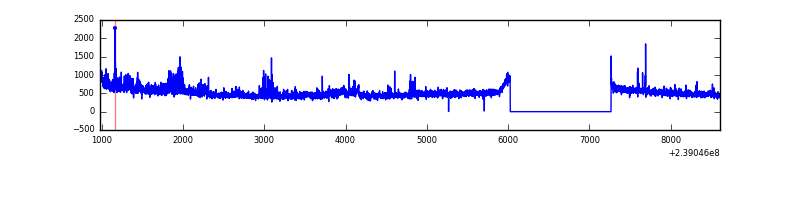 |
| B | 7625 | 6385 | 7 | 7 | 0.09% | 0.11% | 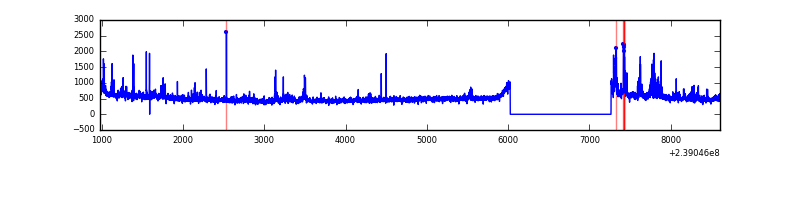 |
| C | 7625 | 6385 | 3 | 3 | 0.04% | 0.05% | 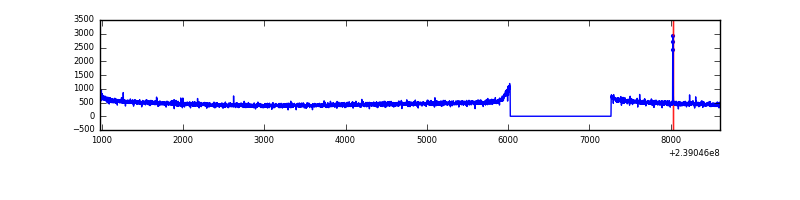 |
| D | 7625 | 6385 | 475 | 475 | 6.23% | 7.44% | 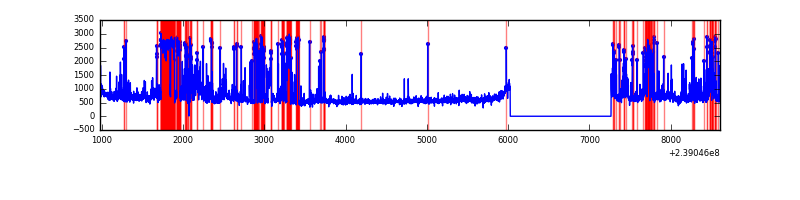 |
Top three noisy pixels from each quadrant. If the there are fewer than three noisy pixels in the level2.evt file, extra rows are filled as -1
| Pixel properties | Quadrant properties | ||||||
|---|---|---|---|---|---|---|---|
| Quadrant | DetID | PixID | Counts | Sigma | Mean | Median | Sigma |
| A | 15 | 239 | 256360 | 1613.25 | 787 | 772 | 158.4 |
| A | 14 | 111 | 58824 | 366.42 | 787 | 772 | 158.4 |
| A | 0 | 226 | 7399 | 41.83 | 787 | 772 | 158.4 |
| B | 4 | 81 | 130795 | 862.09 | 793 | 775 | 150.8 |
| B | 4 | 239 | 57523 | 376.26 | 793 | 775 | 150.8 |
| B | 0 | 219 | 39809 | 258.81 | 793 | 775 | 150.8 |
| C | 14 | 128 | 9866 | 51.7 | 757 | 761 | 176.1 |
| C | 13 | 61 | 5968 | 29.57 | 757 | 761 | 176.1 |
| C | 14 | 67 | 4786 | 22.86 | 757 | 761 | 176.1 |
| D | 2 | 16 | 829324 | 4388.98 | 716 | 697 | 188.8 |
| D | 8 | 195 | 687061 | 3635.46 | 716 | 697 | 188.8 |
| D | 2 | 33 | 540912 | 2861.35 | 716 | 697 | 188.8 |
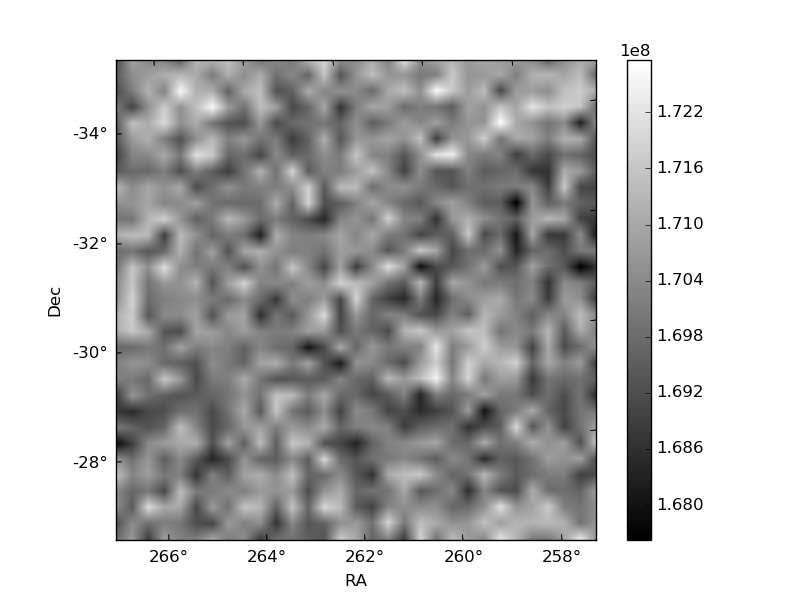
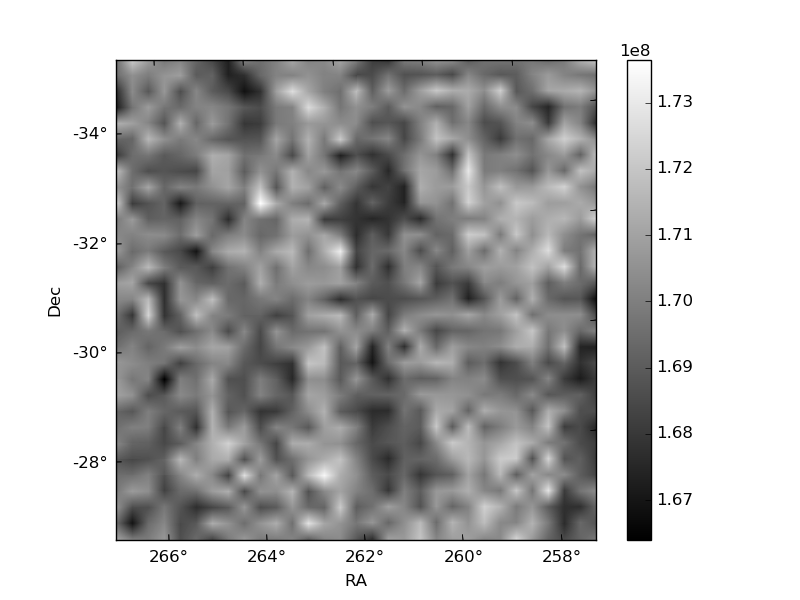
Histogram calculated using DETX and DETY for each event in the final _common_clean file
| Quadrant A |  |
 |
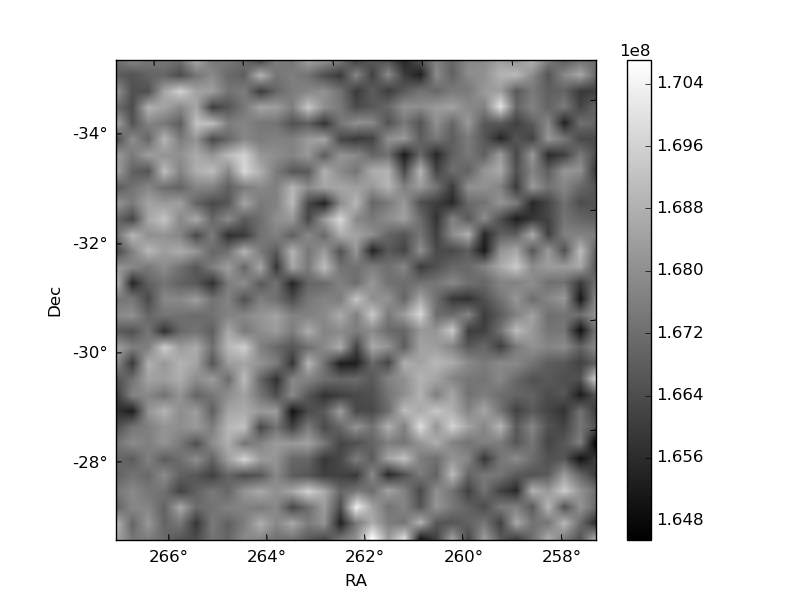
Quadrant B |
|---|---|---|---|
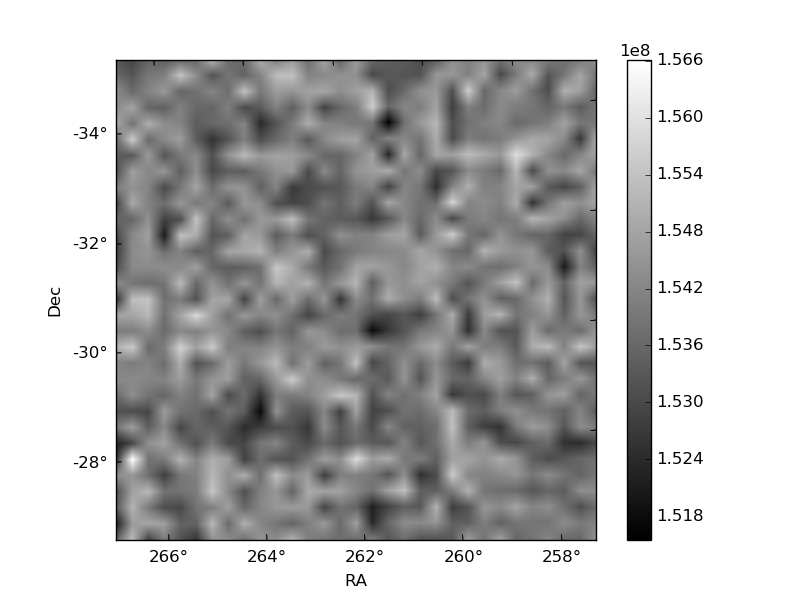
| Quadrant D |  |
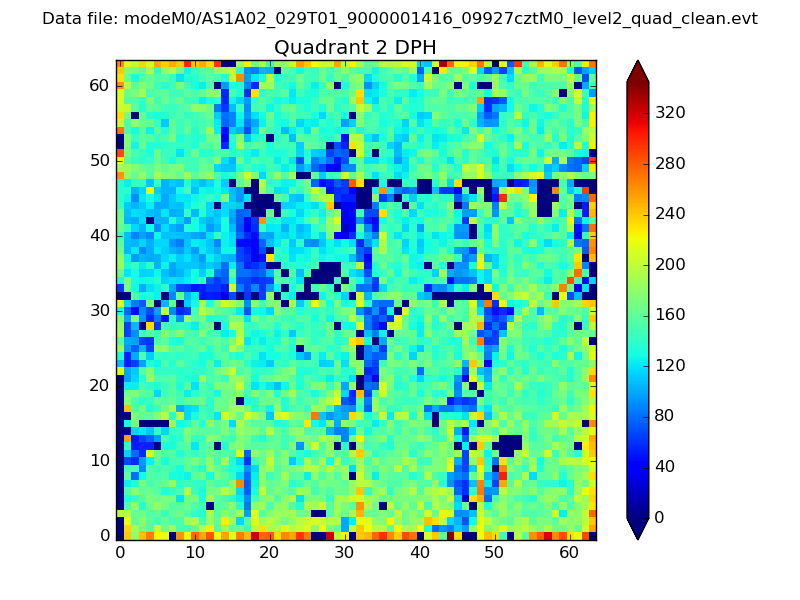 |
Quadrant C |
| Plot type | Count rate plots | Images |
|---|---|---|
| Comparison with Poisson distribution Blue bars denote a histogram of data divided into 1 sec bins. Red curve is a Poisson curve with rate = median count rate of data. |
 |
 |
| Quadrant-wise count rates Data is divided into 100 sec bins |
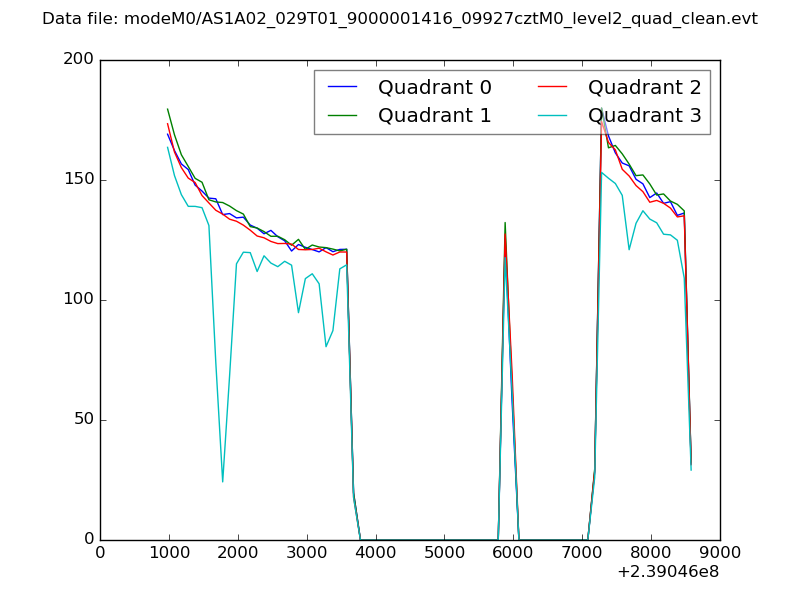 |
|
| Module-wise count rates for Quadrant A Data is divided into 100 sec bins |
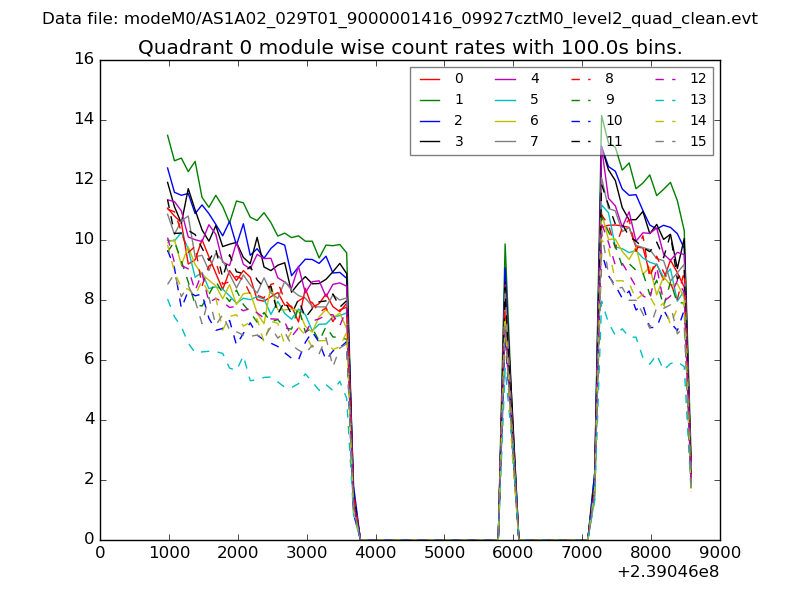 |
 |
| Module-wise count rates for Quadrant B Data is divided into 100 sec bins |
 |
 |
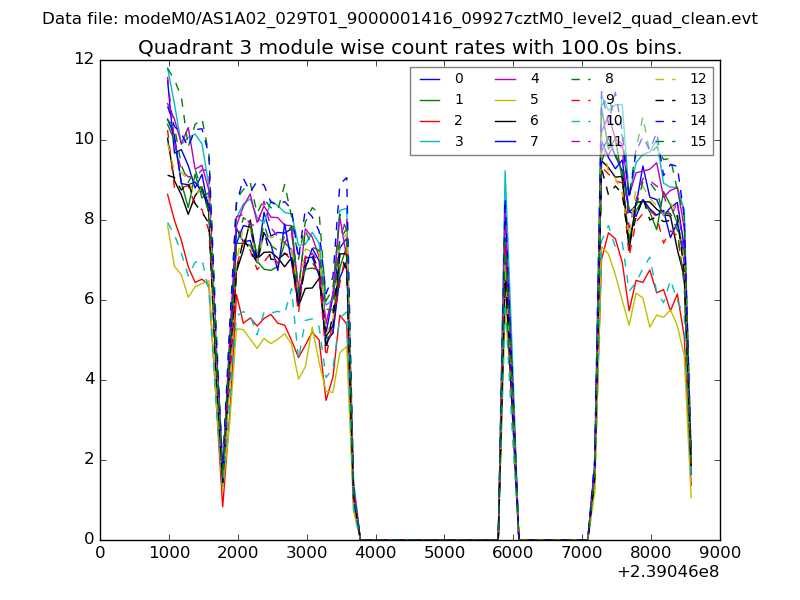
| Module-wise count rates for Quadrant C Data is divided into 100 sec bins |
 |
 |
| Module-wise count rates for Quadrant D Data is divided into 100 sec bins |
 |
 |
| Parameter | Plot |
|---|---|
| CZT HV Monitor |  |
| D_VDD | 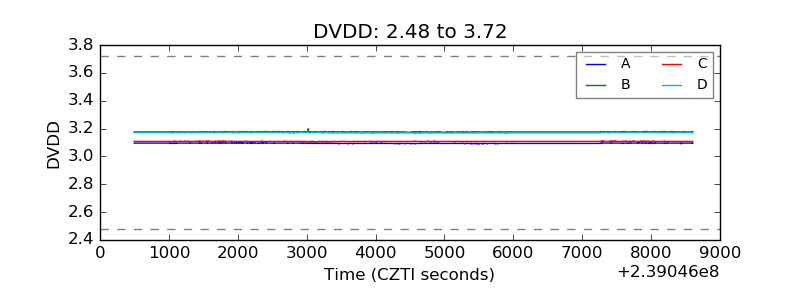 |
| Temperature 1 | 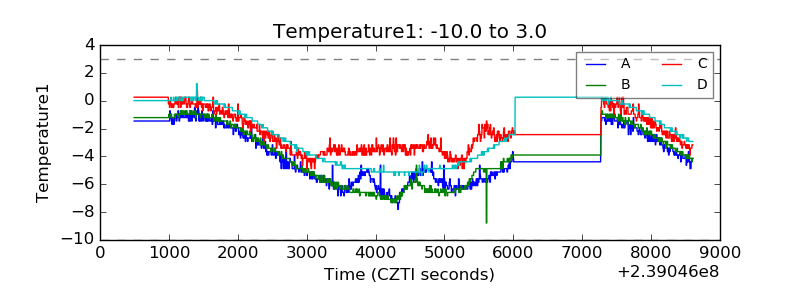 |
| Veto HV Monitor | 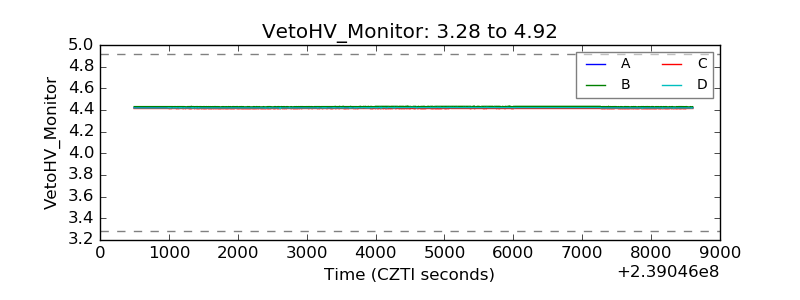 |
| Veto LLD | 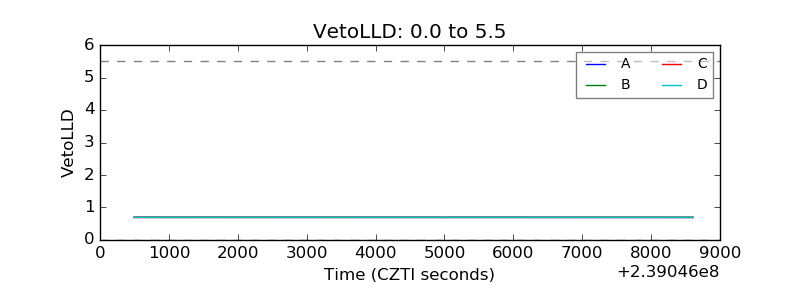 |
| Alpha Counter | 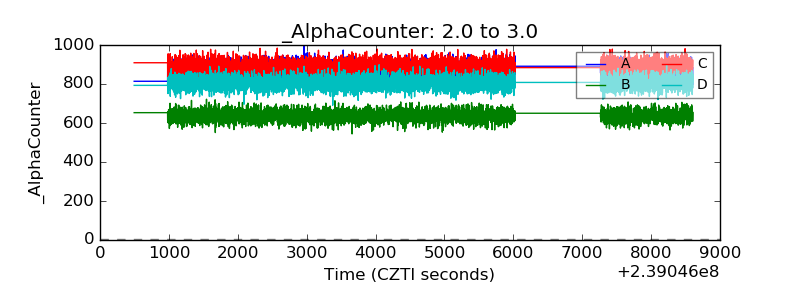 |
| _CPM_Rate | 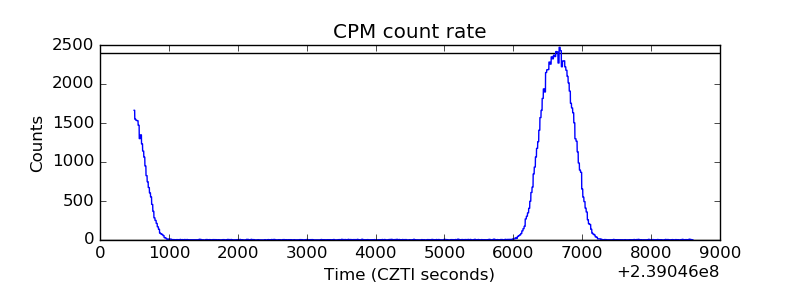 |
| CZT Counter | 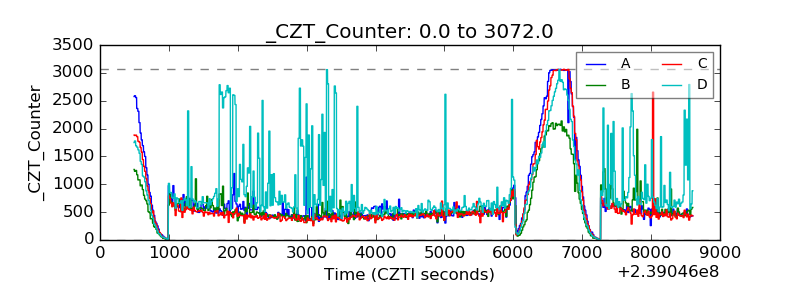 |
| +2.5 Volts monitor |  |
| +5 Volts monitor |  |
| _ROLL_ROT | 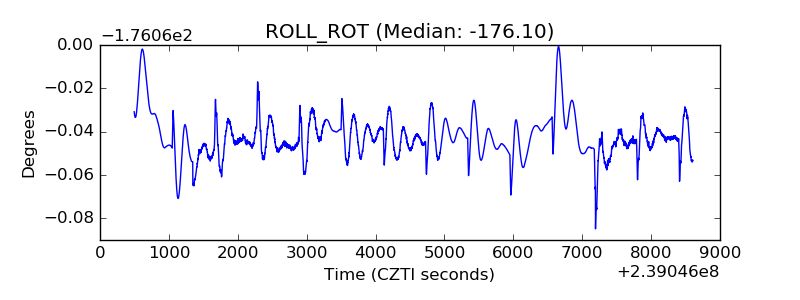 |
| _Roll_DEC | 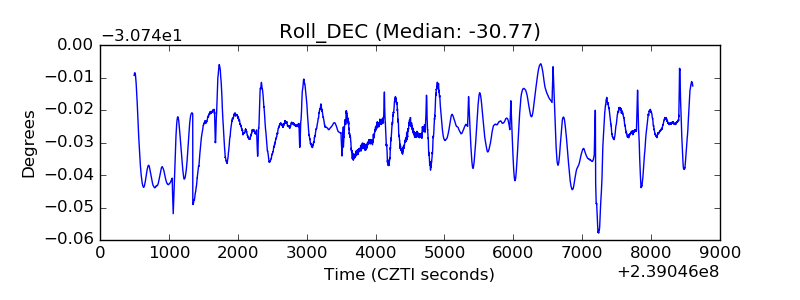 |
| _Roll_RA | 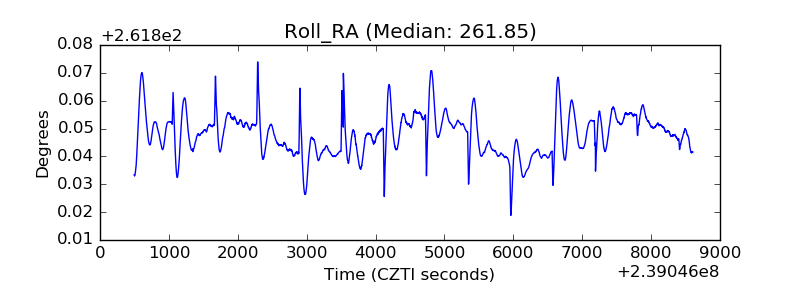 |
| Veto Counter | 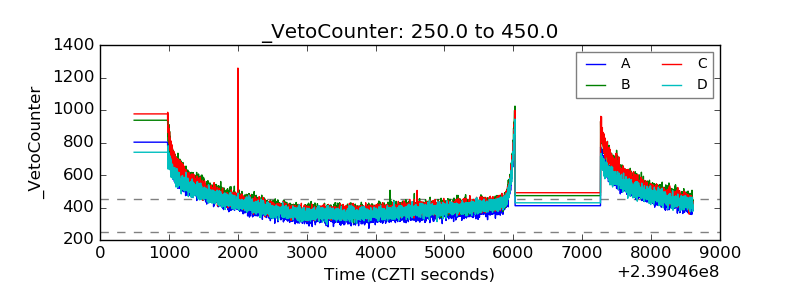 |