| Param | Original file | Final file |
|---|---|---|
| Filename | modeM0/AS1A02_029T01_9000001416_09928cztM0_level2.evt | modeM0/AS1A02_029T01_9000001416_09928cztM0_level2_quad_clean.evt |
| Size (bytes) | 392,261,760 | 66,018,240 |
| Size | 374.1 MB | 63.0 MB |
| Events in quadrant A | 2,647,429 | 440,833 |
| Events in quadrant B | 2,575,770 | 440,638 |
| Events in quadrant C | 2,373,243 | 440,485 |
| Events in quadrant D | 3,947,073 | 331,099 |
| Mode M9 | |||
|---|---|---|---|
| Quadrant | BADHDUFLAG | Total packets | Discarded packets |
| A | 0 | 14 | 0 |
| B | 0 | 14 | 0 |
| C | 0 | 14 | 1 |
| D | 0 | 14 | 0 |
| Mode SS | |||
|---|---|---|---|
| Quadrant | BADHDUFLAG | Total packets | Discarded packets |
| A | 0 | 118 | 30 |
| B | 0 | 118 | 16 |
| C | 0 | 118 | 18 |
| D | 0 | 118 | 20 |
| Mode M0 | |||
|---|---|---|---|
| Quadrant | BADHDUFLAG | Total packets | Discarded packets |
| A | 0 | 12994 | 1959 |
| B | 0 | 12966 | 2205 |
| C | 0 | 12201 | 1819 |
| D | 0 | 18809 | 3828 |
| Quadrant | Total seconds | Saturated seconds | Saturation percentage |
|---|---|---|---|
| A | 5008 | 59 | 1.178115% |
| B | 4942 | 53 | 1.072440% |
| C | 5022 | 28 | 0.557547% |
| D | 4749 | 468 | 9.854706% |
Noise dominated data is calculated using 1-second bins in cleaned event files. If a bin has >2000 counts, and if more than 50% of those come from <1% of pixels, then it is considered to be noise-dominated and hence unusable.
| Quadrant | # 1 sec bins | Bins with >0 counts | Bins with >2000 counts | High rate bins dominated by noise | Noise dominated (total time) | Noise dominated (detector-on time) | Marked lightcurve |
|---|---|---|---|---|---|---|---|
| A | 7225 | 5618 | 4 | 4 | 0.06% | 0.07% | 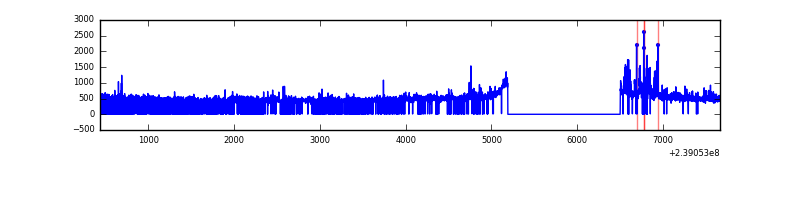 |
| B | 7224 | 5549 | 2 | 2 | 0.03% | 0.04% | 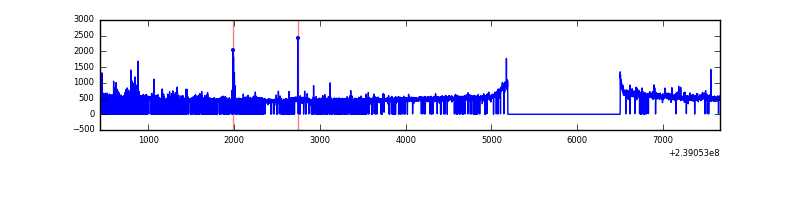 |
| C | 7225 | 5614 | 2 | 2 | 0.03% | 0.04% | 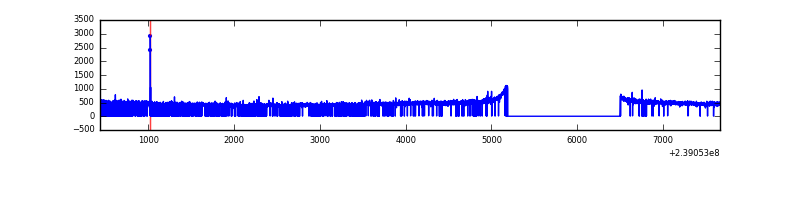 |
| D | 7225 | 5386 | 425 | 425 | 5.88% | 7.89% | 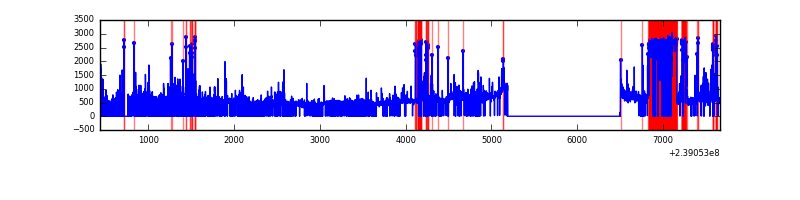 |
Top three noisy pixels from each quadrant. If the there are fewer than three noisy pixels in the level2.evt file, extra rows are filled as -1
| Pixel properties | Quadrant properties | ||||||
|---|---|---|---|---|---|---|---|
| Quadrant | DetID | PixID | Counts | Sigma | Mean | Median | Sigma |
| A | 15 | 239 | 183644 | 1448.03 | 620 | 609 | 126.4 |
| A | 8 | 15 | 72793 | 571.06 | 620 | 609 | 126.4 |
| A | 0 | 226 | 5885 | 41.74 | 620 | 609 | 126.4 |
| B | 0 | 219 | 58969 | 488.1 | 621 | 607 | 119.6 |
| B | 4 | 81 | 37986 | 312.61 | 621 | 607 | 119.6 |
| B | 4 | 239 | 22505 | 183.14 | 621 | 607 | 119.6 |
| C | 14 | 128 | 6654 | 42.87 | 604 | 608 | 141.0 |
| C | 12 | 4 | 5229 | 32.77 | 604 | 608 | 141.0 |
| C | 13 | 61 | 4711 | 29.1 | 604 | 608 | 141.0 |
| D | 2 | 16 | 1018857 | 7476.59 | 520 | 507 | 136.2 |
| D | 8 | 195 | 354323 | 2597.67 | 520 | 507 | 136.2 |
| D | 12 | 17 | 201418 | 1475.06 | 520 | 507 | 136.2 |
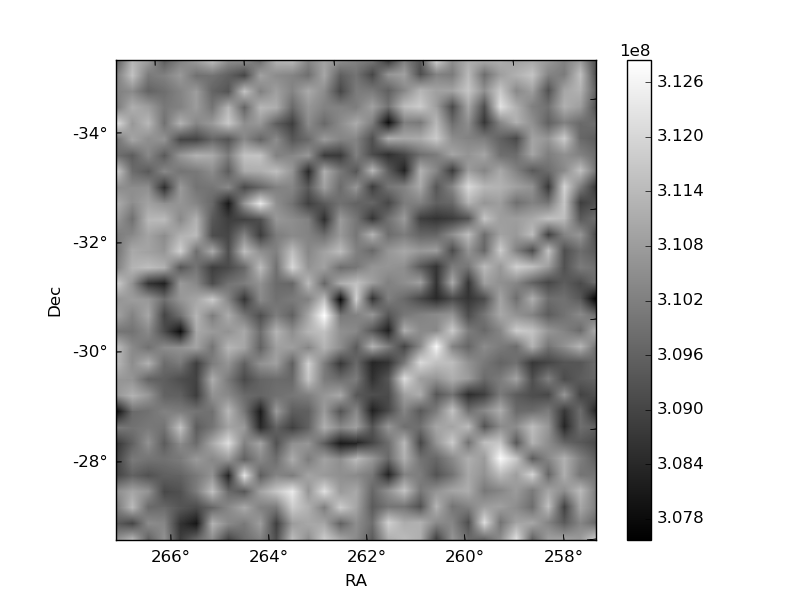
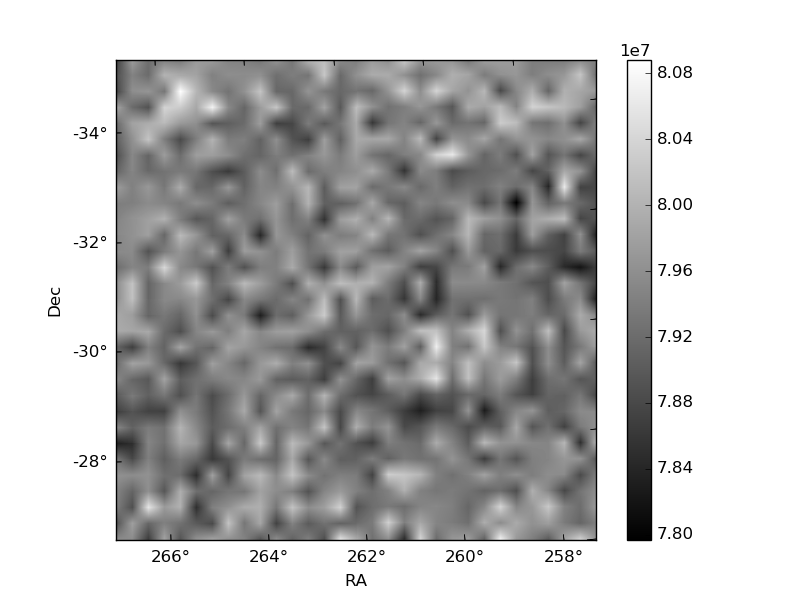
Histogram calculated using DETX and DETY for each event in the final _common_clean file
| Quadrant A | 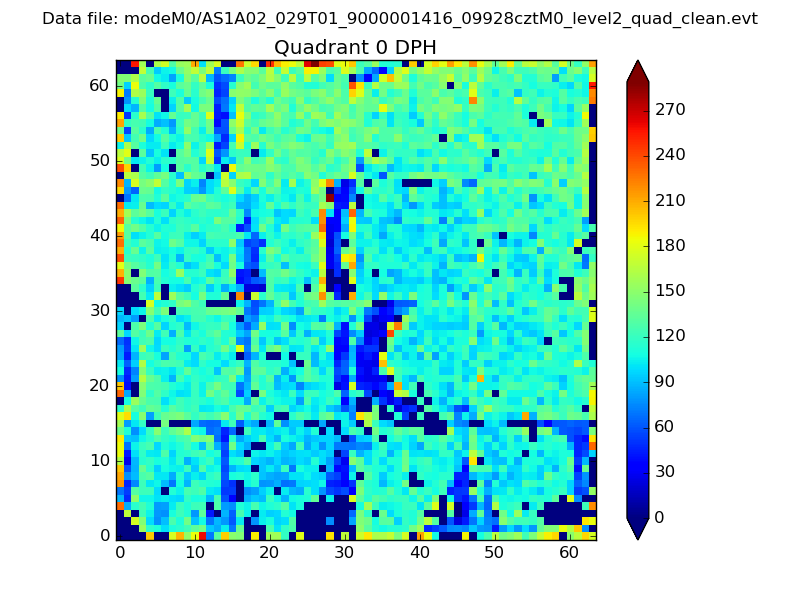 |
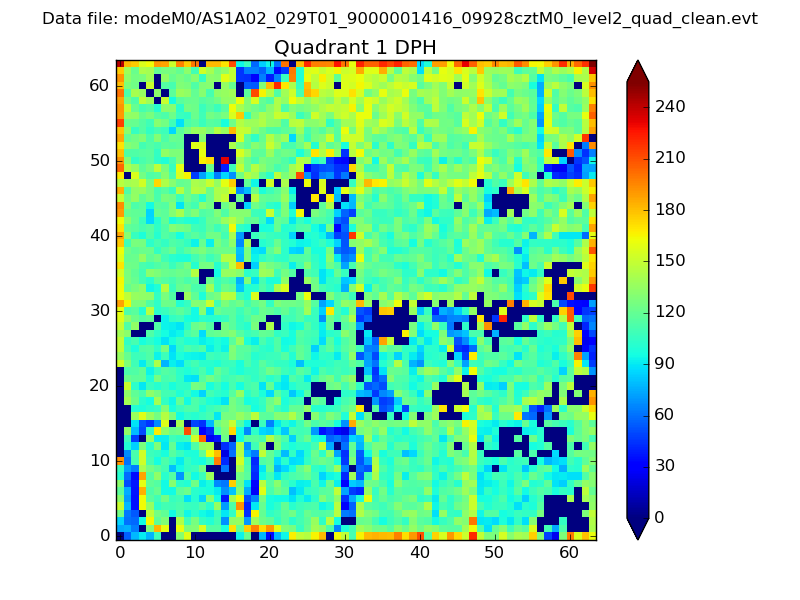 |
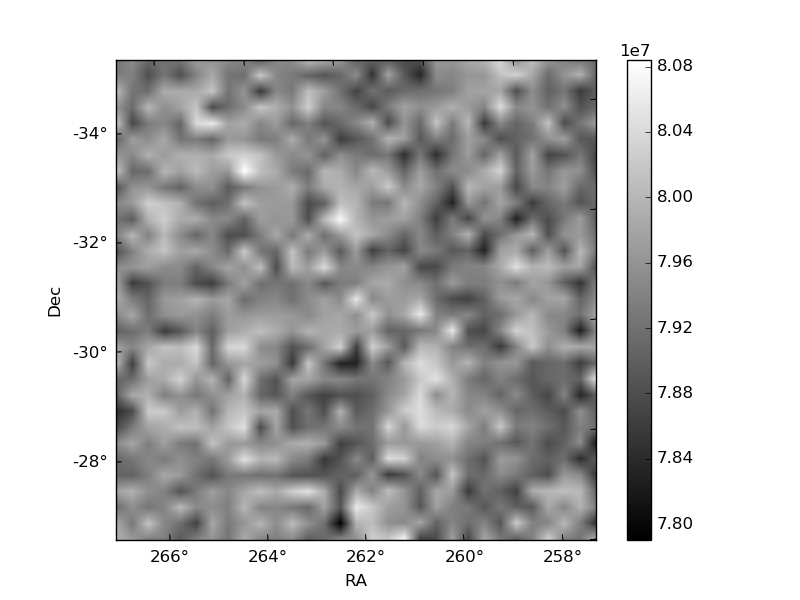
Quadrant B |
|---|---|---|---|
| Quadrant D | 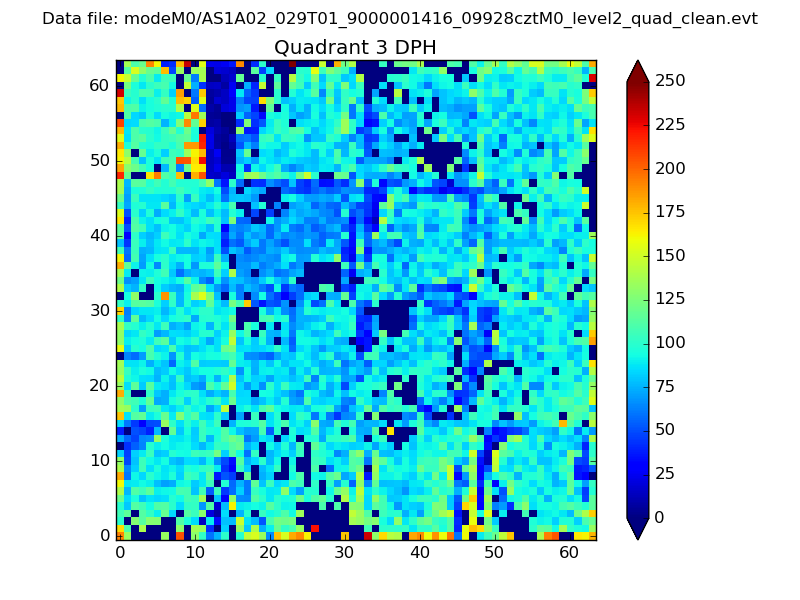 |
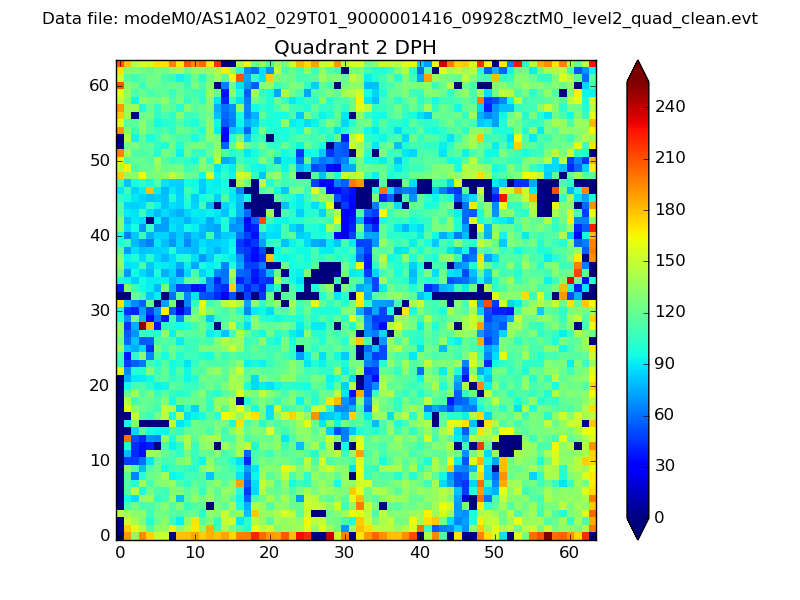 |
Quadrant C |
| Plot type | Count rate plots | Images |
|---|---|---|
| Comparison with Poisson distribution Blue bars denote a histogram of data divided into 1 sec bins. Red curve is a Poisson curve with rate = median count rate of data. |
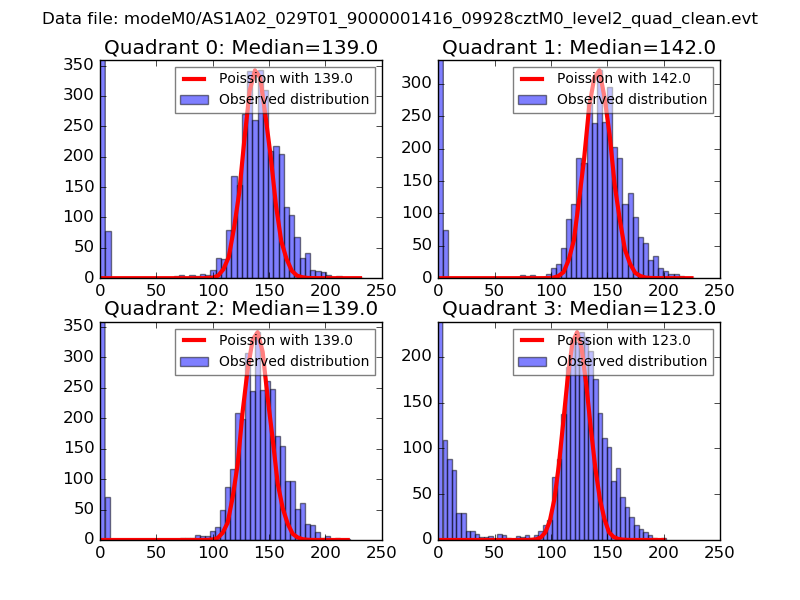 |
 |
| Quadrant-wise count rates Data is divided into 100 sec bins |
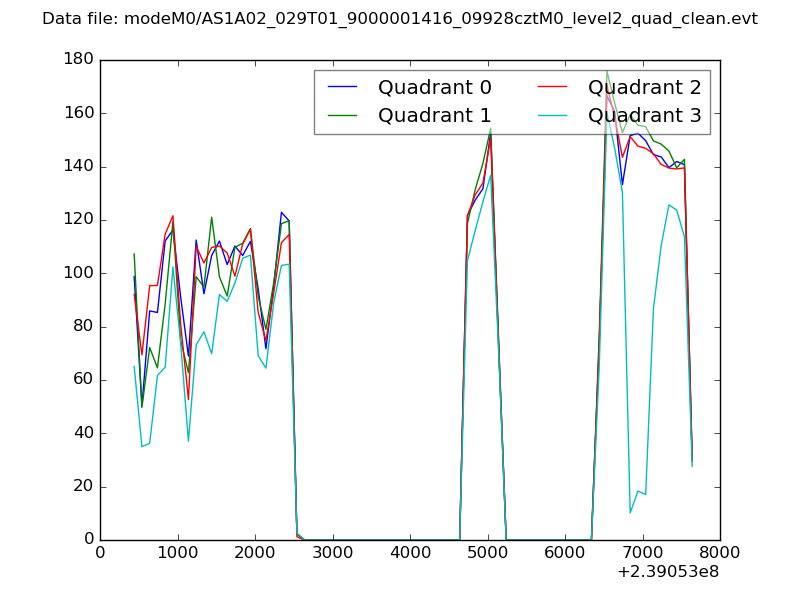 |
|
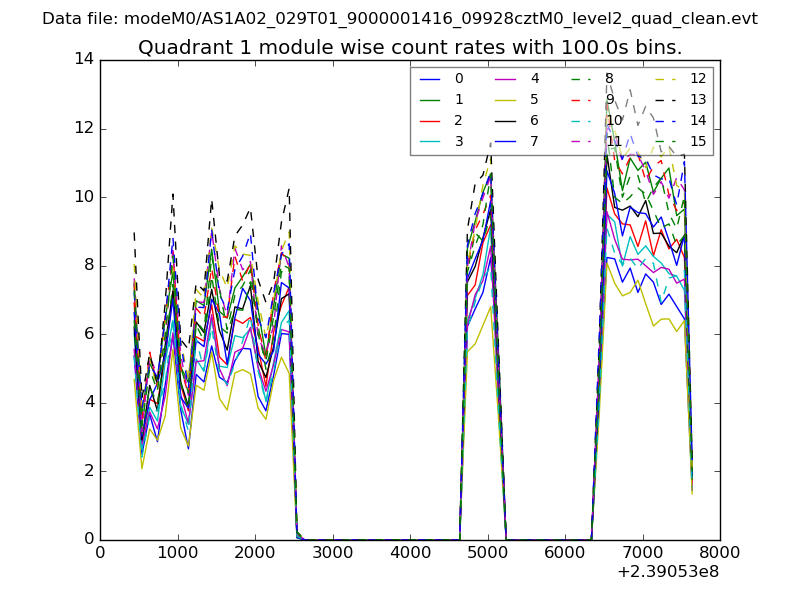
| Module-wise count rates for Quadrant A Data is divided into 100 sec bins |
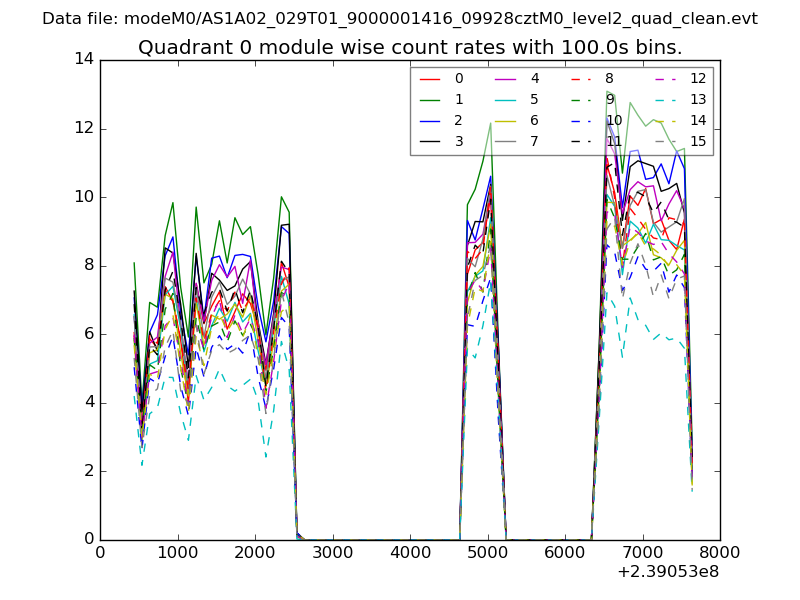 |
 |
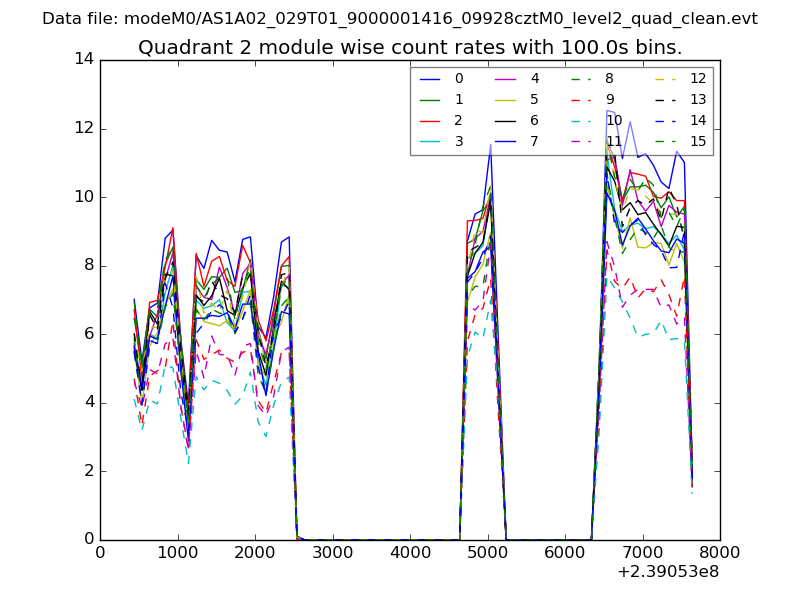
| Module-wise count rates for Quadrant B Data is divided into 100 sec bins |
 |
 |
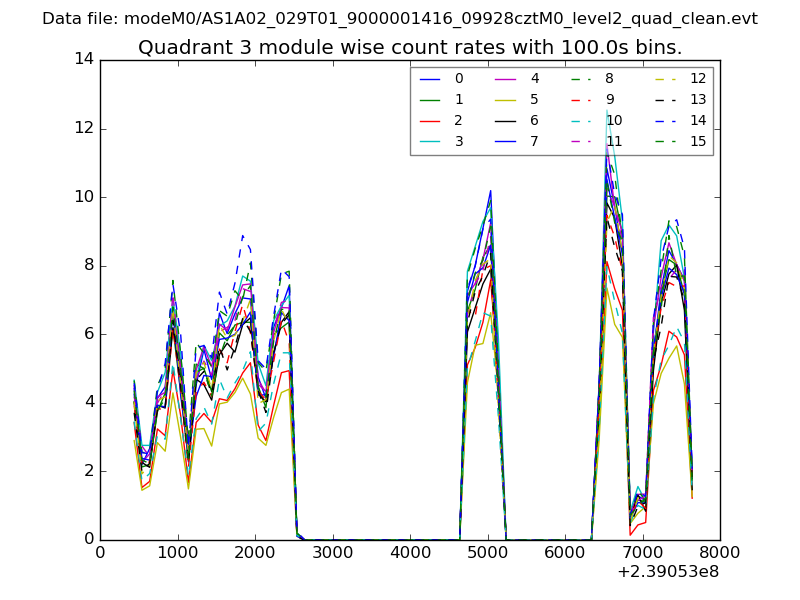
| Module-wise count rates for Quadrant C Data is divided into 100 sec bins |
 |
 |
| Module-wise count rates for Quadrant D Data is divided into 100 sec bins |
 |
 |
| Parameter | Plot |
|---|---|
| CZT HV Monitor | 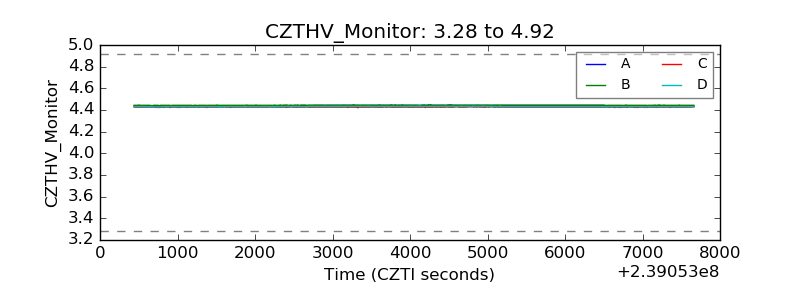 |
| D_VDD | 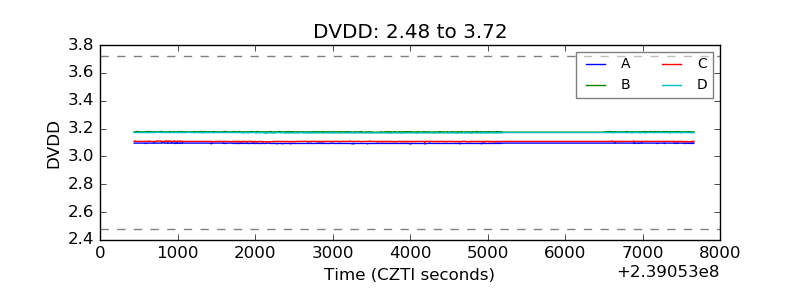 |
| Temperature 1 | 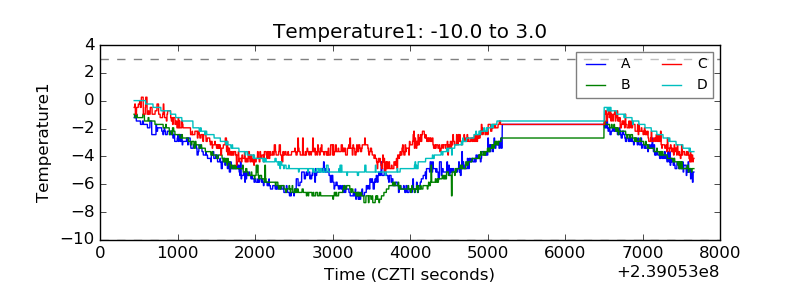 |
| Veto HV Monitor | 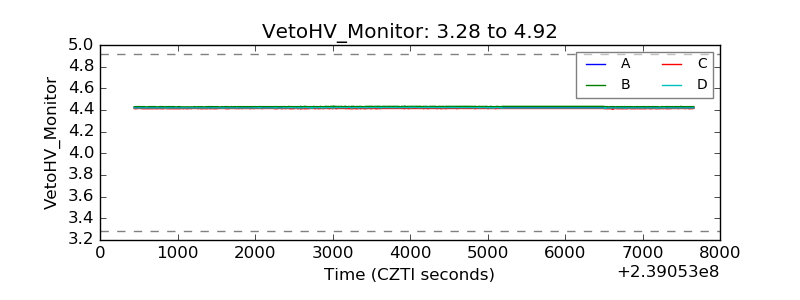 |
| Veto LLD | 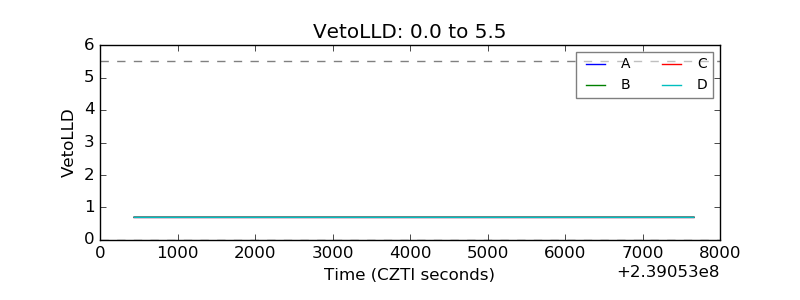 |
| Alpha Counter | 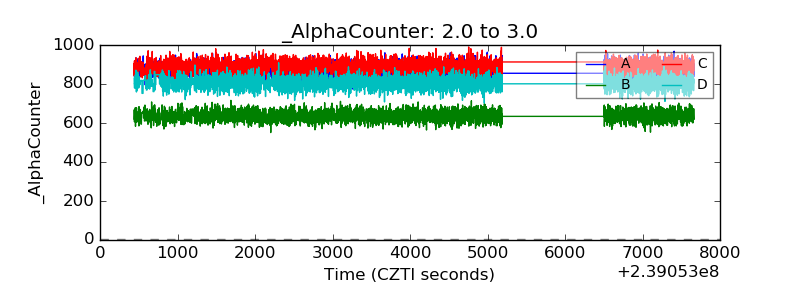 |
| _CPM_Rate | 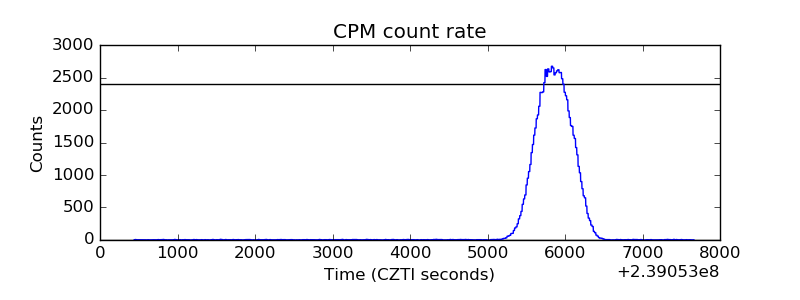 |
| CZT Counter | 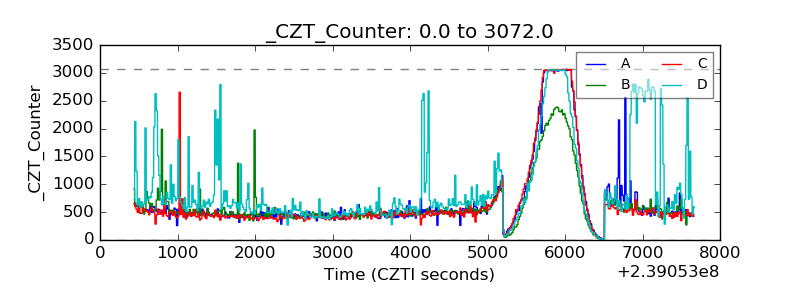 |
| +2.5 Volts monitor |  |
| +5 Volts monitor |  |
| _ROLL_ROT | 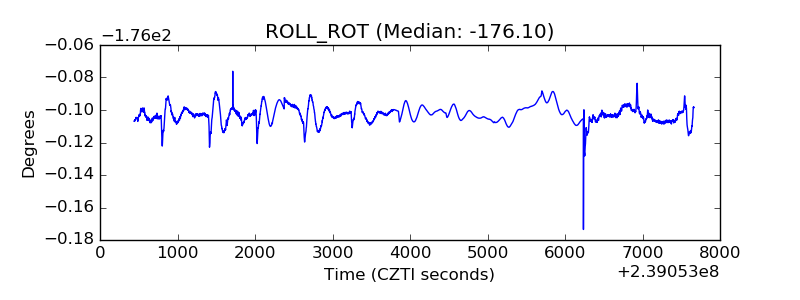 |
| _Roll_DEC | 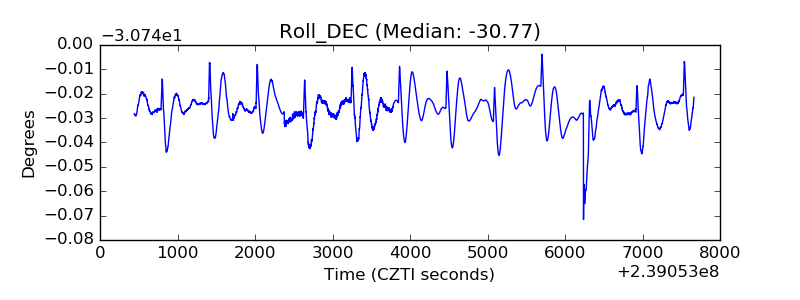 |
| _Roll_RA | 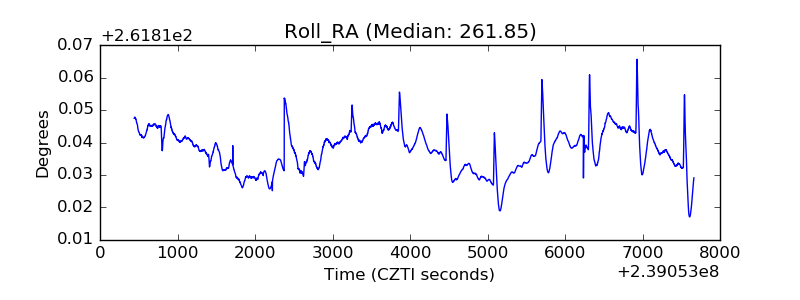 |
| Veto Counter | 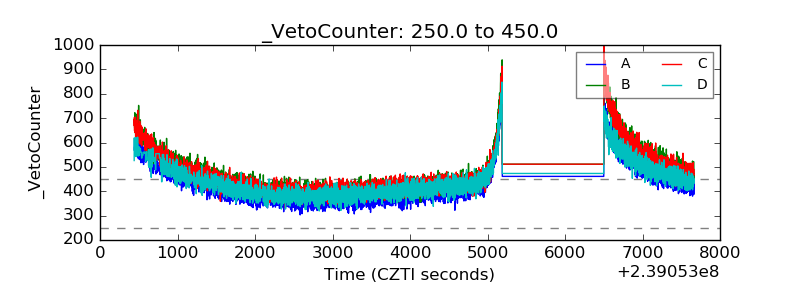 |