| Param | Original file | Final file |
|---|---|---|
| Filename | modeM0/AS1A02_029T01_9000001416_09930cztM0_level2.evt | modeM0/AS1A02_029T01_9000001416_09930cztM0_level2_quad_clean.evt |
| Size (bytes) | 433,071,360 | 77,806,080 |
| Size | 413.0 MB | 74.2 MB |
| Events in quadrant A | 3,340,394 | 488,030 |
| Events in quadrant B | 2,943,410 | 508,965 |
| Events in quadrant C | 2,696,316 | 500,254 |
| Events in quadrant D | 3,744,311 | 456,744 |
| Mode M9 | |||
|---|---|---|---|
| Quadrant | BADHDUFLAG | Total packets | Discarded packets |
| A | 0 | 12 | 0 |
| B | 0 | 12 | 0 |
| C | 0 | 12 | 1 |
| D | 0 | 12 | 1 |
| Mode SS | |||
|---|---|---|---|
| Quadrant | BADHDUFLAG | Total packets | Discarded packets |
| A | 0 | 124 | 6 |
| B | 0 | 124 | 6 |
| C | 0 | 124 | 8 |
| D | 0 | 124 | 8 |
| Mode M0 | |||
|---|---|---|---|
| Quadrant | BADHDUFLAG | Total packets | Discarded packets |
| A | 0 | 14522 | 793 |
| B | 0 | 13148 | 656 |
| C | 0 | 12462 | 587 |
| D | 0 | 15783 | 895 |
| Quadrant | Total seconds | Saturated seconds | Saturation percentage |
|---|---|---|---|
| A | 5739 | 90 | 1.568217% |
| B | 5748 | 79 | 1.374391% |
| C | 5764 | 26 | 0.451076% |
| D | 5726 | 168 | 2.933985% |
Noise dominated data is calculated using 1-second bins in cleaned event files. If a bin has >2000 counts, and if more than 50% of those come from <1% of pixels, then it is considered to be noise-dominated and hence unusable.
| Quadrant | # 1 sec bins | Bins with >0 counts | Bins with >2000 counts | High rate bins dominated by noise | Noise dominated (total time) | Noise dominated (detector-on time) | Marked lightcurve |
|---|---|---|---|---|---|---|---|
| A | 7338 | 5997 | 5 | 5 | 0.07% | 0.08% | 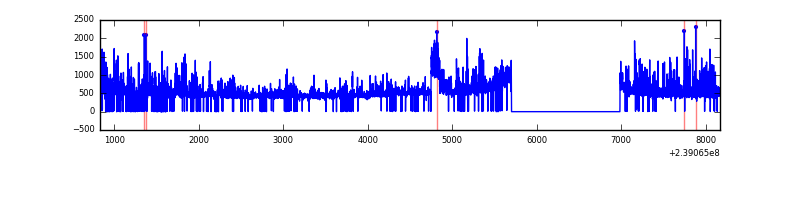 |
| B | 7338 | 5997 | 2 | 2 | 0.03% | 0.03% | 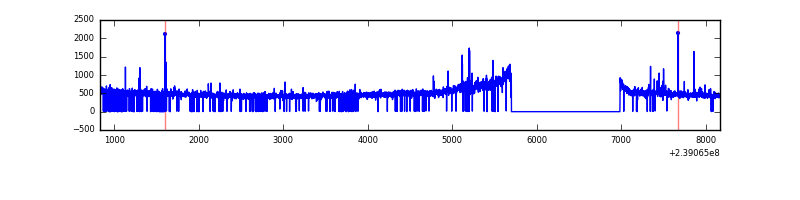 |
| C | 7338 | 6012 | 1 | 1 | 0.01% | 0.02% | 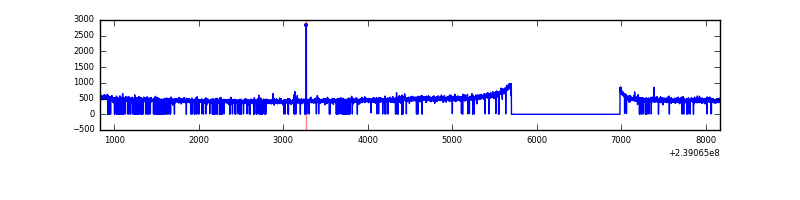 |
| D | 7338 | 5985 | 126 | 126 | 1.72% | 2.11% | 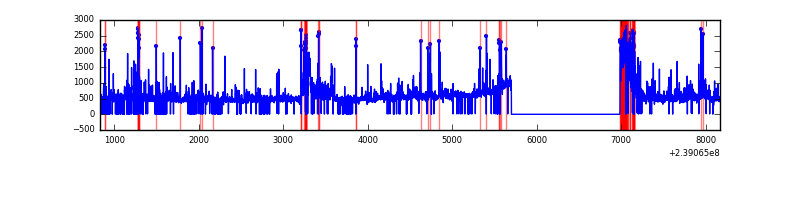 |
Top three noisy pixels from each quadrant. If the there are fewer than three noisy pixels in the level2.evt file, extra rows are filled as -1
| Pixel properties | Quadrant properties | ||||||
|---|---|---|---|---|---|---|---|
| Quadrant | DetID | PixID | Counts | Sigma | Mean | Median | Sigma |
| A | 15 | 239 | 554071 | 3872.83 | 698 | 683 | 142.9 |
| A | 14 | 111 | 90478 | 628.42 | 698 | 683 | 142.9 |
| A | 0 | 226 | 6549 | 41.05 | 698 | 683 | 142.9 |
| B | 0 | 219 | 45654 | 329.04 | 713 | 696 | 136.6 |
| B | 0 | 214 | 42107 | 303.08 | 713 | 696 | 136.6 |
| B | 0 | 187 | 24406 | 173.53 | 713 | 696 | 136.6 |
| C | 12 | 4 | 8241 | 47.15 | 687 | 692 | 160.1 |
| C | 13 | 61 | 5186 | 28.07 | 687 | 692 | 160.1 |
| C | 8 | 128 | 3818 | 19.53 | 687 | 692 | 160.1 |
| D | 2 | 16 | 369975 | 2183.41 | 661 | 643 | 169.2 |
| D | 8 | 195 | 312021 | 1840.8 | 661 | 643 | 169.2 |
| D | 1 | 52 | 195679 | 1153.01 | 661 | 643 | 169.2 |
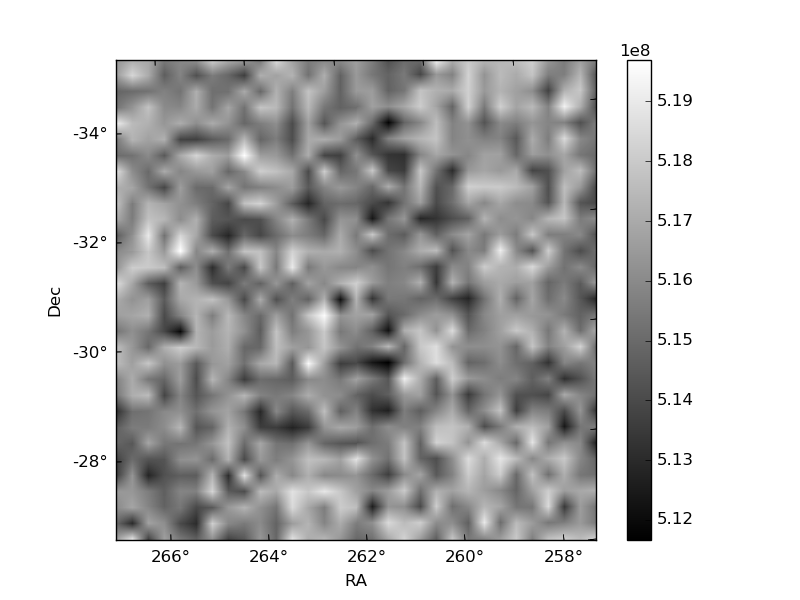
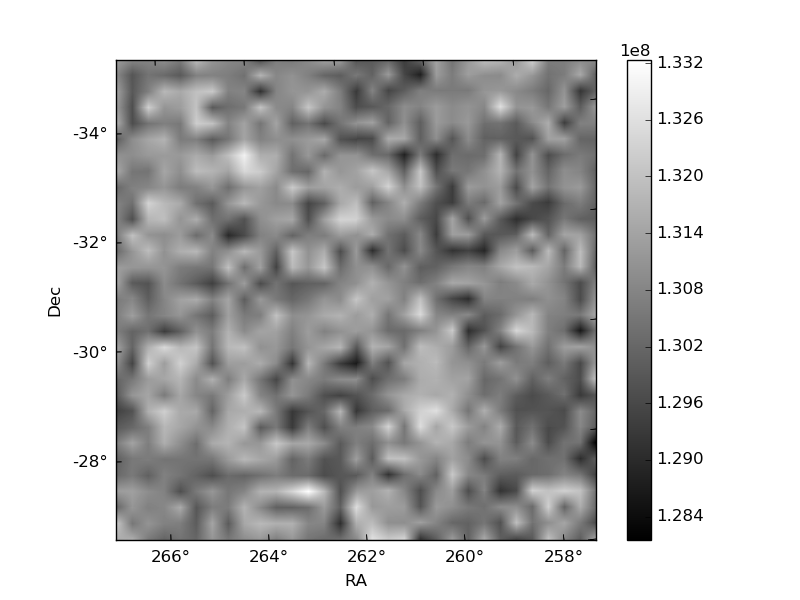
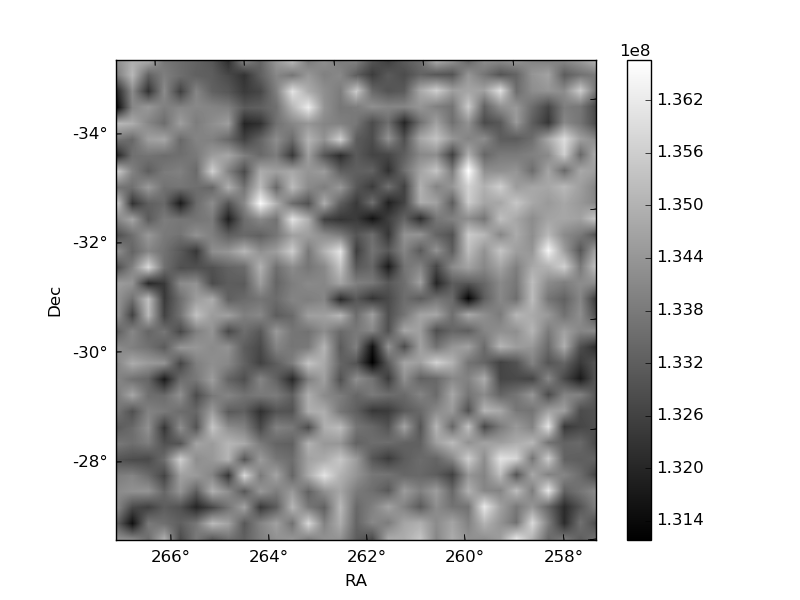
Histogram calculated using DETX and DETY for each event in the final _common_clean file
| Quadrant A | 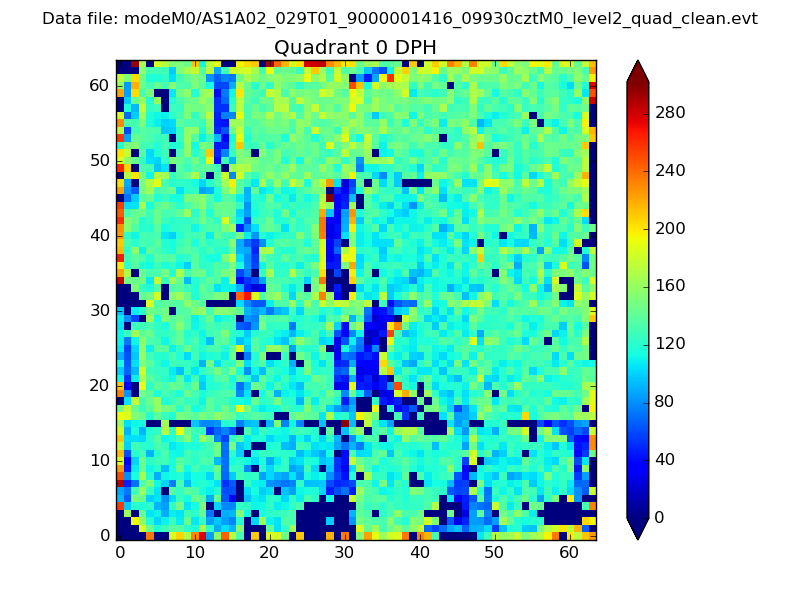 |
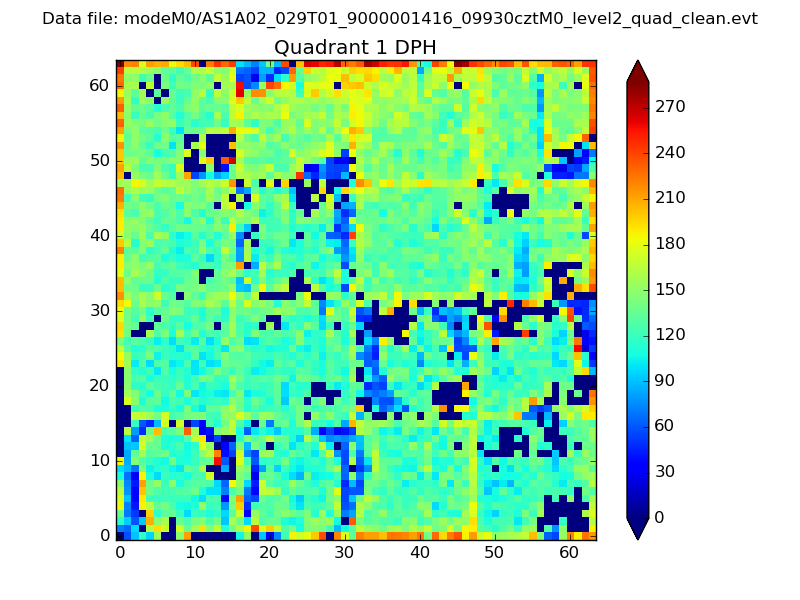 |
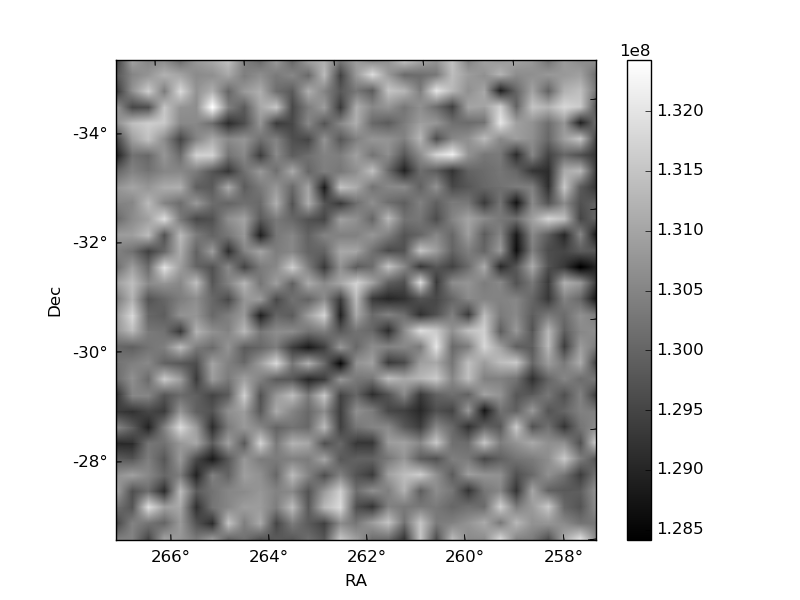
Quadrant B |
|---|---|---|---|
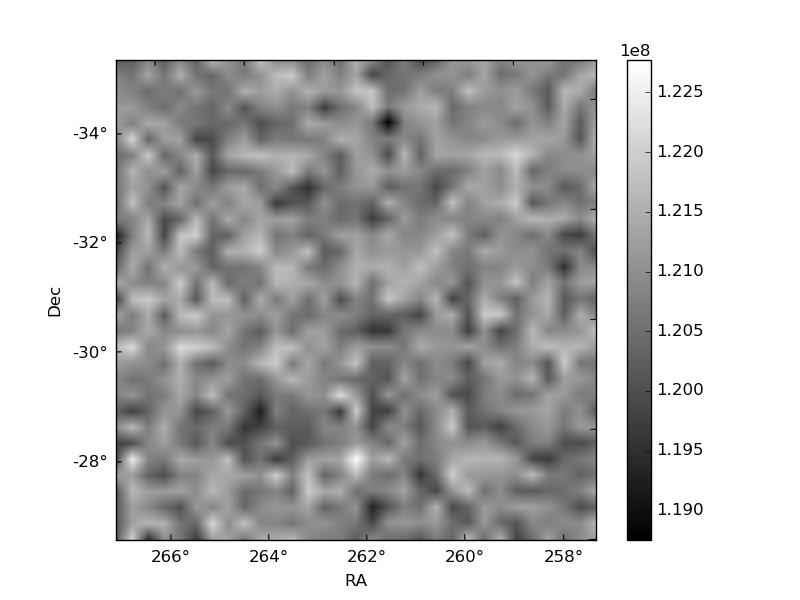
| Quadrant D | 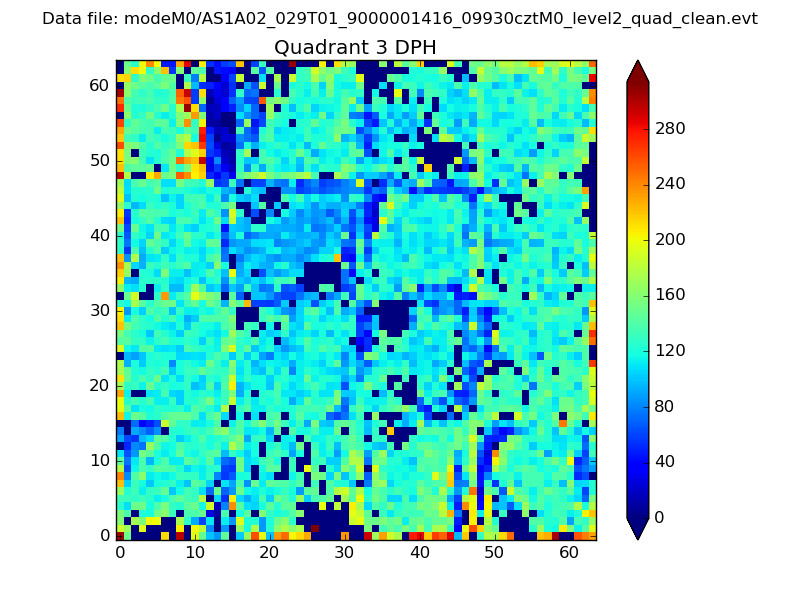 |
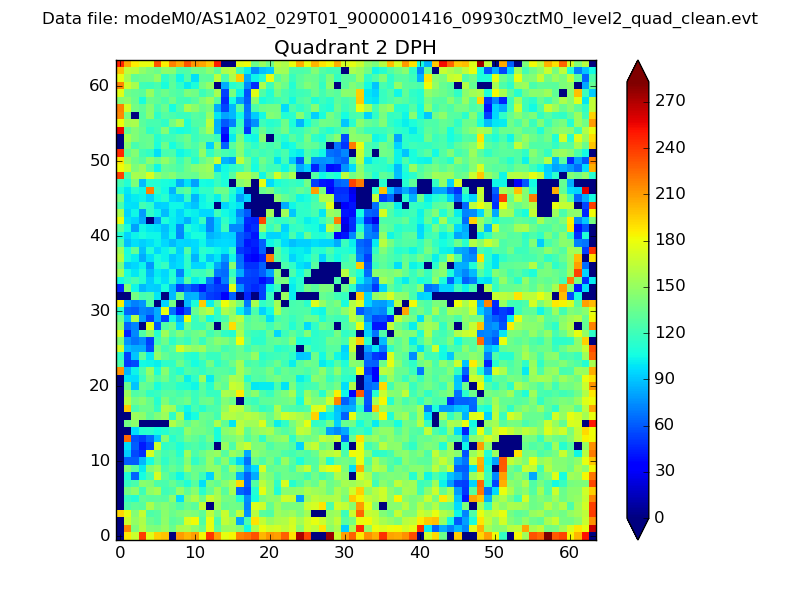 |
Quadrant C |
| Plot type | Count rate plots | Images |
|---|---|---|
| Comparison with Poisson distribution Blue bars denote a histogram of data divided into 1 sec bins. Red curve is a Poisson curve with rate = median count rate of data. |
 |
 |
| Quadrant-wise count rates Data is divided into 100 sec bins |
 |
|
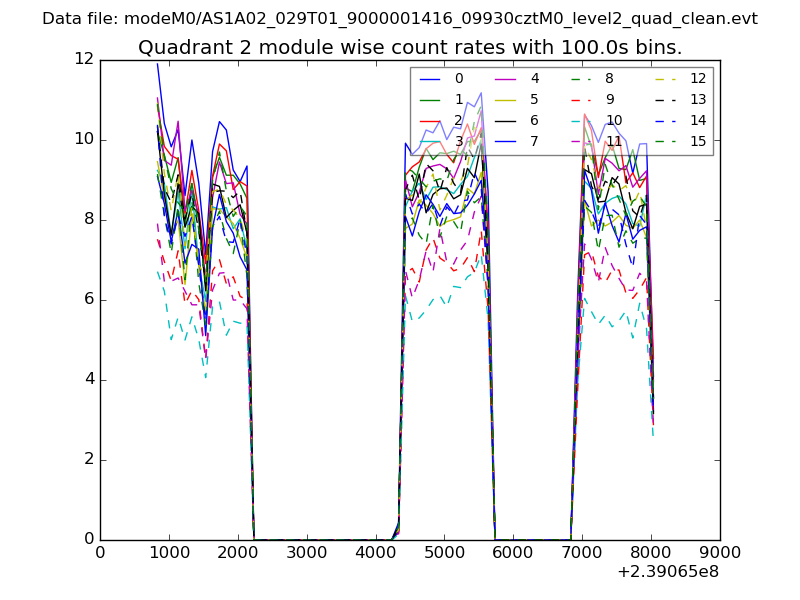
| Module-wise count rates for Quadrant A Data is divided into 100 sec bins |
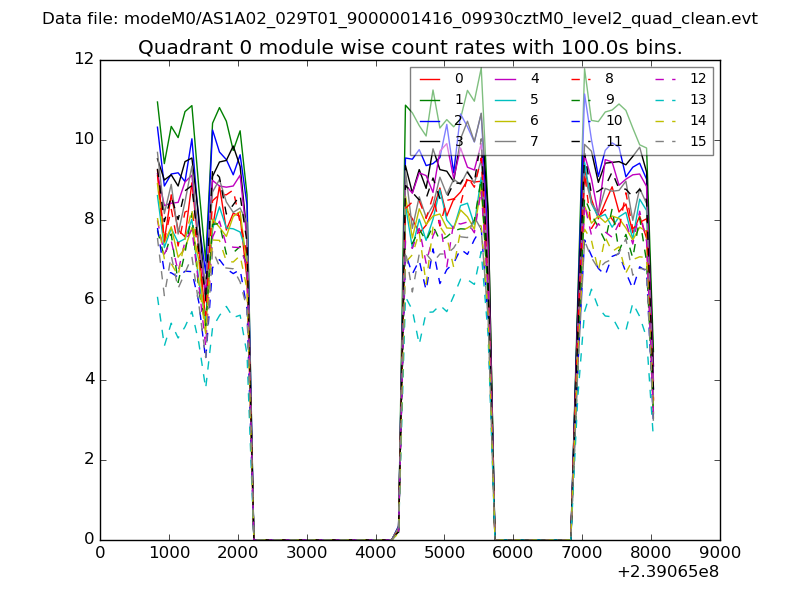 |
 |
| Module-wise count rates for Quadrant B Data is divided into 100 sec bins |
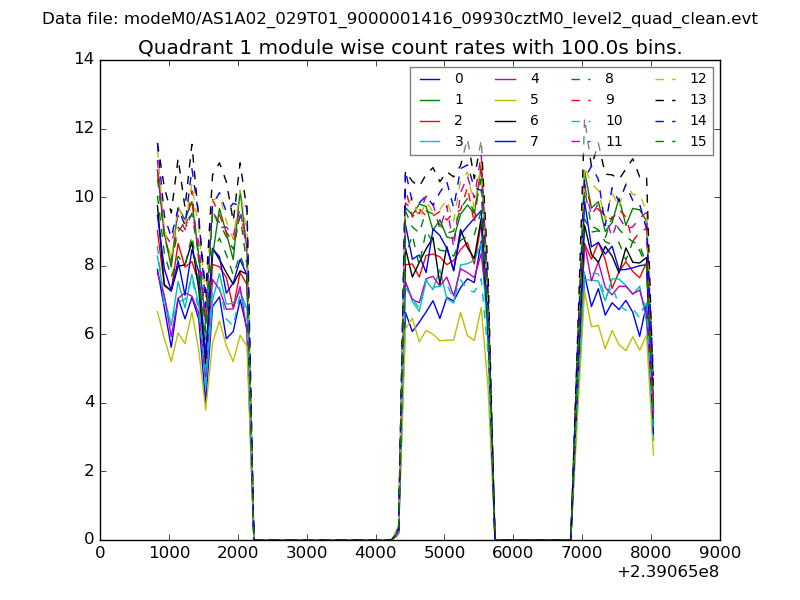 |
 |
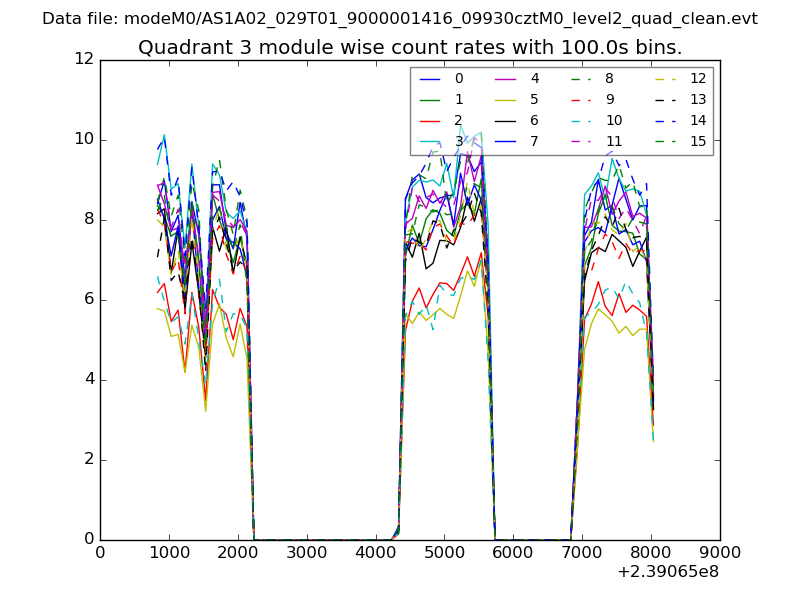
| Module-wise count rates for Quadrant C Data is divided into 100 sec bins |
 |
 |
| Module-wise count rates for Quadrant D Data is divided into 100 sec bins |
 |
 |
| Parameter | Plot |
|---|---|
| CZT HV Monitor | 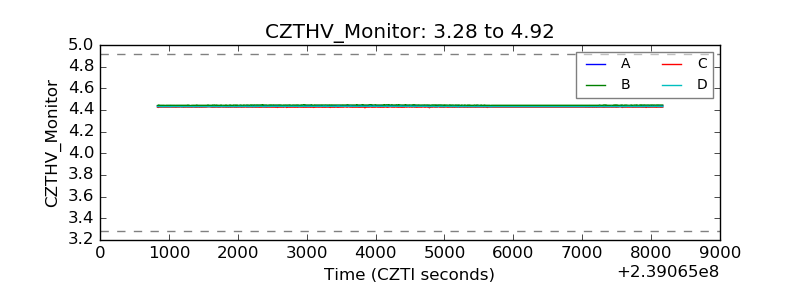 |
| D_VDD | 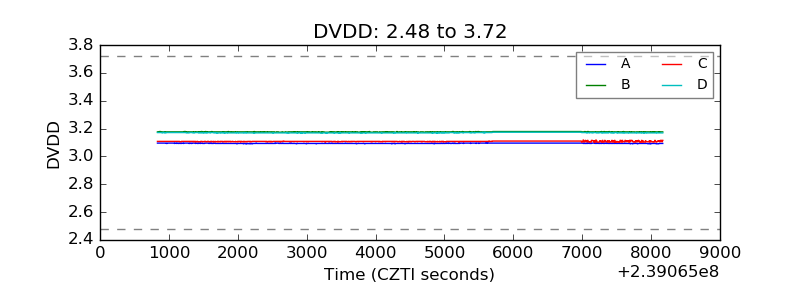 |
| Temperature 1 | 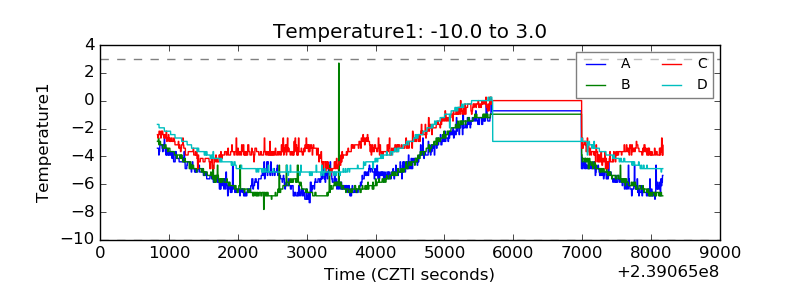 |
| Veto HV Monitor | 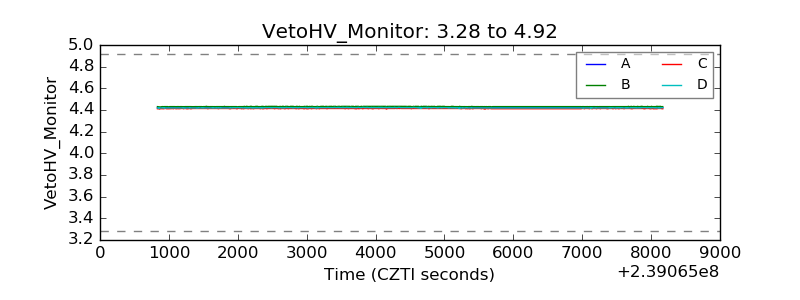 |
| Veto LLD | 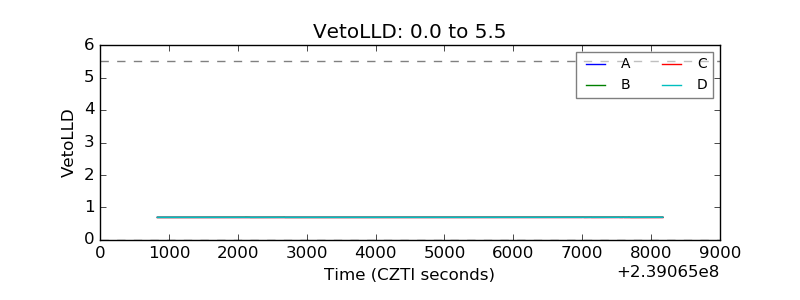 |
| Alpha Counter |  |
| _CPM_Rate | 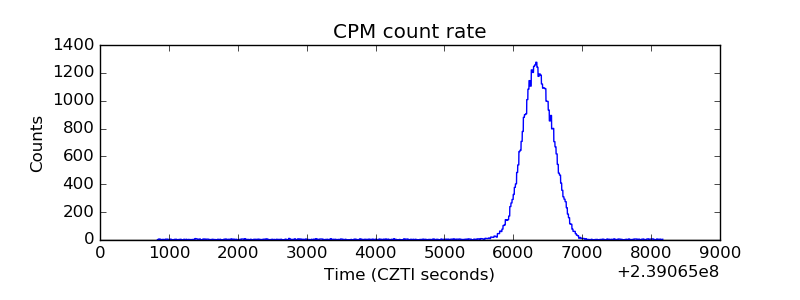 |
| CZT Counter | 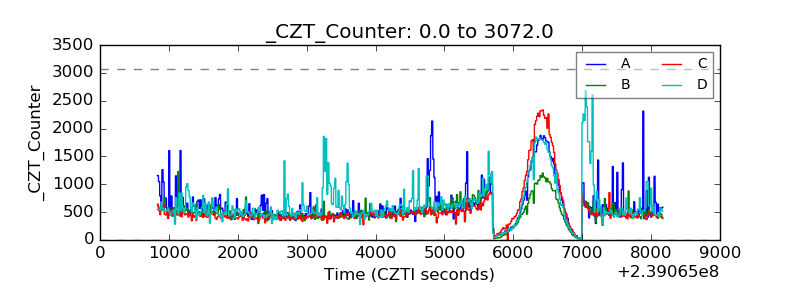 |
| +2.5 Volts monitor |  |
| +5 Volts monitor |  |
| _ROLL_ROT | 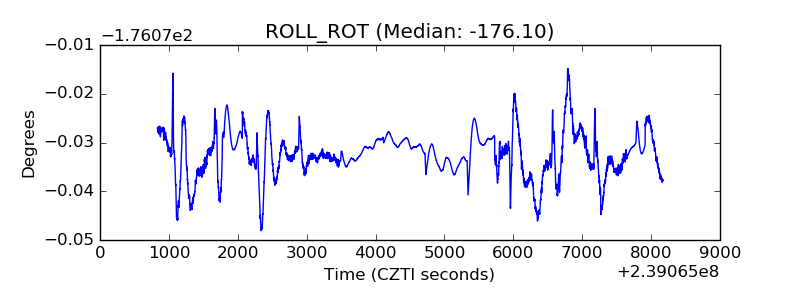 |
| _Roll_DEC | 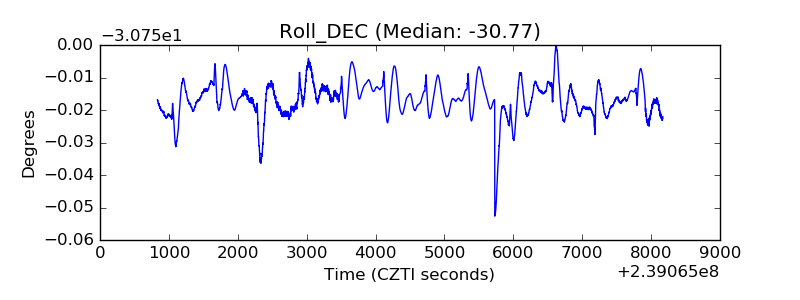 |
| _Roll_RA | 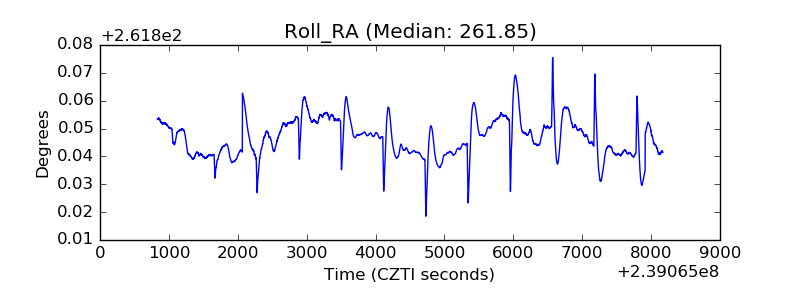 |
| Veto Counter | 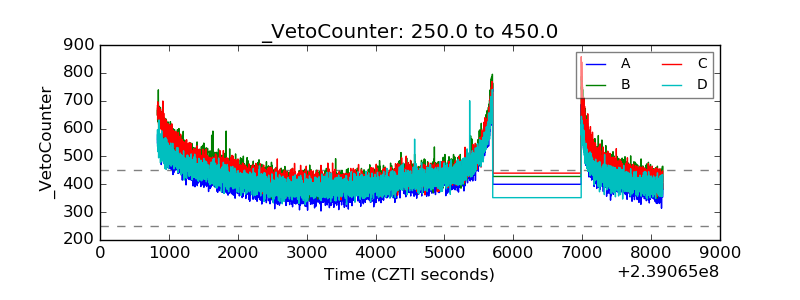 |