| Param | Original file | Final file |
|---|---|---|
| Filename | modeM0/AS1A02_029T01_9000001416_09931cztM0_level2.evt | modeM0/AS1A02_029T01_9000001416_09931cztM0_level2_quad_clean.evt |
| Size (bytes) | 495,616,320 | 72,838,080 |
| Size | 472.7 MB | 69.5 MB |
| Events in quadrant A | 3,640,408 | 450,389 |
| Events in quadrant B | 3,103,084 | 469,415 |
| Events in quadrant C | 2,794,075 | 463,130 |
| Events in quadrant D | 5,059,021 | 397,690 |
| Mode M9 | |||
|---|---|---|---|
| Quadrant | BADHDUFLAG | Total packets | Discarded packets |
| A | 0 | 19 | 0 |
| B | 0 | 19 | 0 |
| C | 0 | 19 | 0 |
| D | 0 | 20 | 2 |
| Mode SS | |||
|---|---|---|---|
| Quadrant | BADHDUFLAG | Total packets | Discarded packets |
| A | 0 | 130 | 6 |
| B | 0 | 130 | 12 |
| C | 0 | 130 | 6 |
| D | 0 | 130 | 4 |
| Mode M0 | |||
|---|---|---|---|
| Quadrant | BADHDUFLAG | Total packets | Discarded packets |
| A | 0 | 15728 | 704 |
| B | 0 | 13842 | 476 |
| C | 0 | 12912 | 457 |
| D | 0 | 20325 | 1203 |
| Quadrant | Total seconds | Saturated seconds | Saturation percentage |
|---|---|---|---|
| A | 6081 | 126 | 2.072028% |
| B | 6116 | 35 | 0.572269% |
| C | 6114 | 16 | 0.261694% |
| D | 6018 | 539 | 8.956464% |
Noise dominated data is calculated using 1-second bins in cleaned event files. If a bin has >2000 counts, and if more than 50% of those come from <1% of pixels, then it is considered to be noise-dominated and hence unusable.
| Quadrant | # 1 sec bins | Bins with >0 counts | Bins with >2000 counts | High rate bins dominated by noise | Noise dominated (total time) | Noise dominated (detector-on time) | Marked lightcurve |
|---|---|---|---|---|---|---|---|
| A | 7443 | 6302 | 64 | 64 | 0.86% | 1.02% | 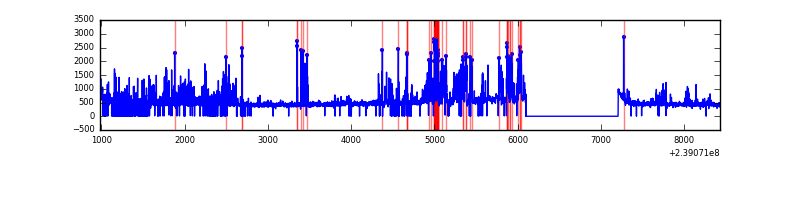 |
| B | 7443 | 6298 | 5 | 5 | 0.07% | 0.08% | 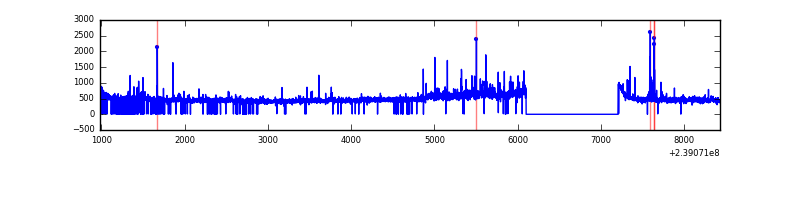 |
| C | 7443 | 6295 | 0 | 0 | 0.00% | 0.00% | 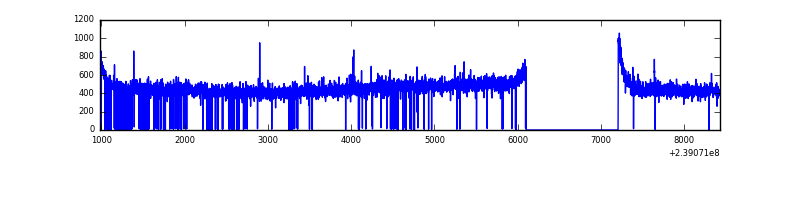 |
| D | 7443 | 6259 | 492 | 492 | 6.61% | 7.86% | 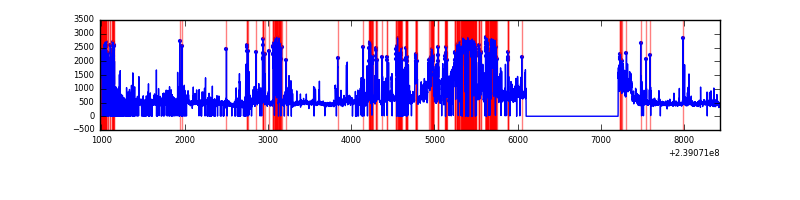 |
Top three noisy pixels from each quadrant. If the there are fewer than three noisy pixels in the level2.evt file, extra rows are filled as -1
| Pixel properties | Quadrant properties | ||||||
|---|---|---|---|---|---|---|---|
| Quadrant | DetID | PixID | Counts | Sigma | Mean | Median | Sigma |
| A | 15 | 239 | 856511 | 5904.92 | 717 | 704 | 144.9 |
| A | 15 | 174 | 16857 | 111.45 | 717 | 704 | 144.9 |
| A | 13 | 253 | 6776 | 41.9 | 717 | 704 | 144.9 |
| B | 0 | 214 | 90494 | 634.73 | 737 | 720 | 141.4 |
| B | 4 | 239 | 55301 | 385.91 | 737 | 720 | 141.4 |
| B | 4 | 81 | 27336 | 188.18 | 737 | 720 | 141.4 |
| C | 12 | 4 | 11122 | 63.31 | 708 | 712 | 164.4 |
| C | 8 | 128 | 10148 | 57.39 | 708 | 712 | 164.4 |
| C | 8 | 112 | 5799 | 30.94 | 708 | 712 | 164.4 |
| D | 2 | 16 | 1218492 | 7155.15 | 661 | 643 | 170.2 |
| D | 1 | 52 | 762069 | 4473.56 | 661 | 643 | 170.2 |
| D | 8 | 195 | 261562 | 1532.96 | 661 | 643 | 170.2 |
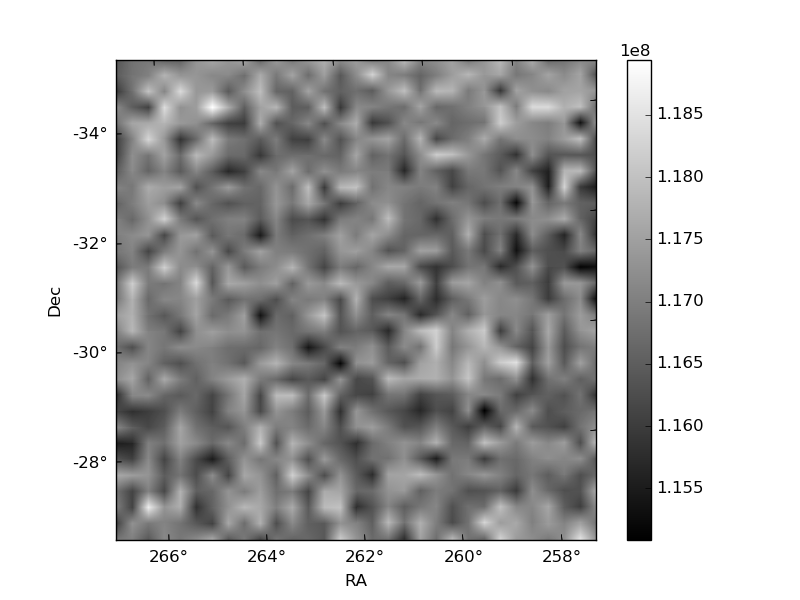
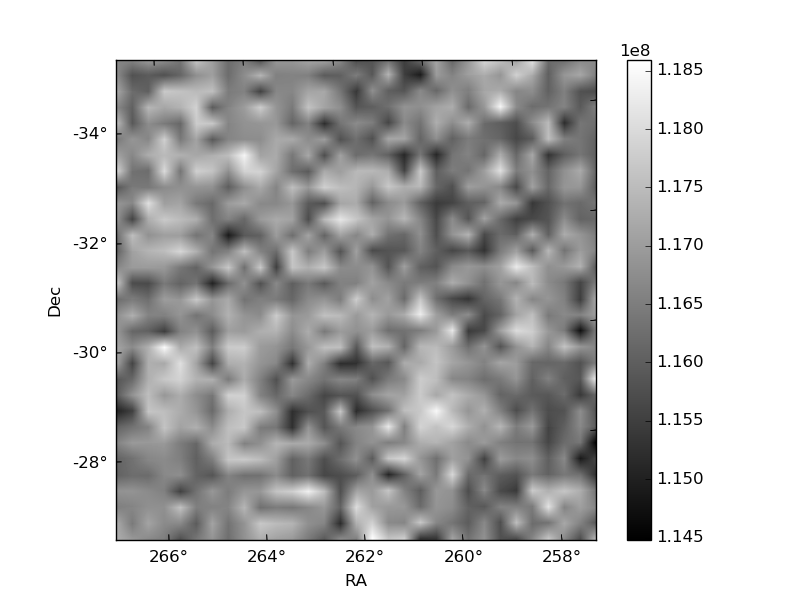
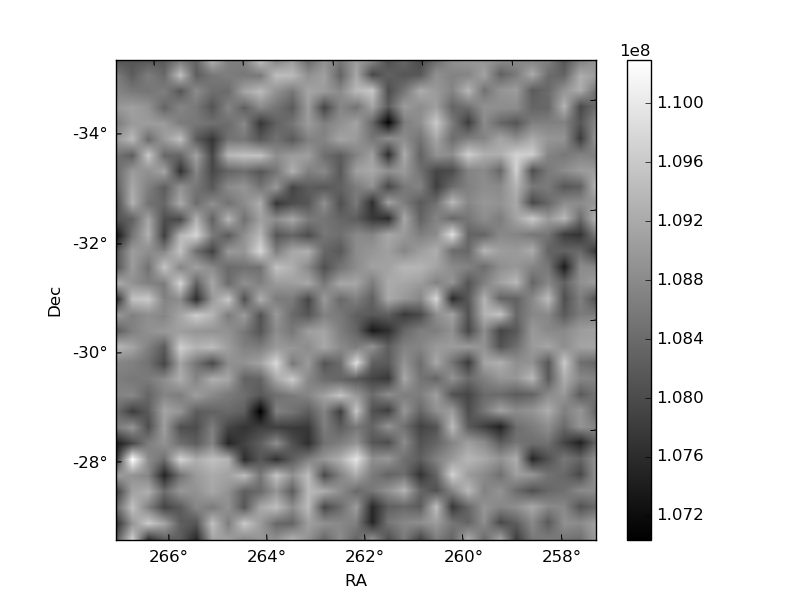
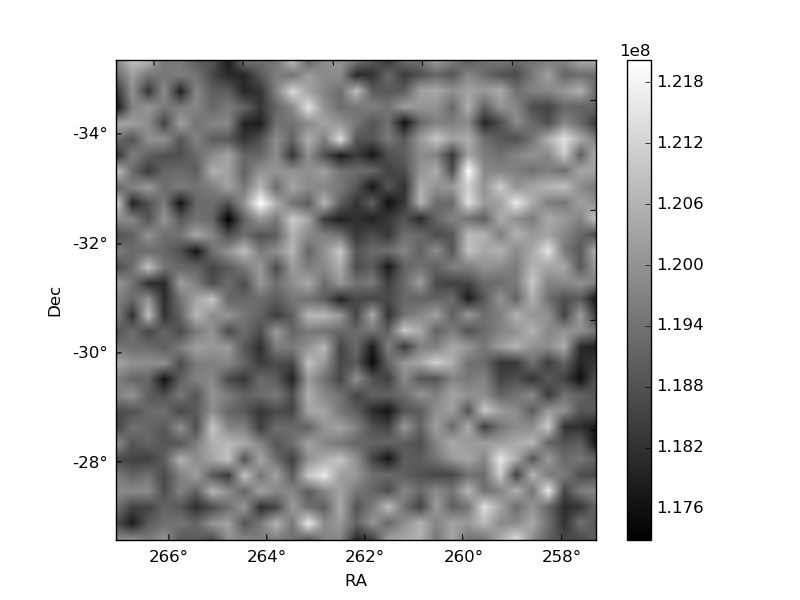
Histogram calculated using DETX and DETY for each event in the final _common_clean file
| Quadrant A | 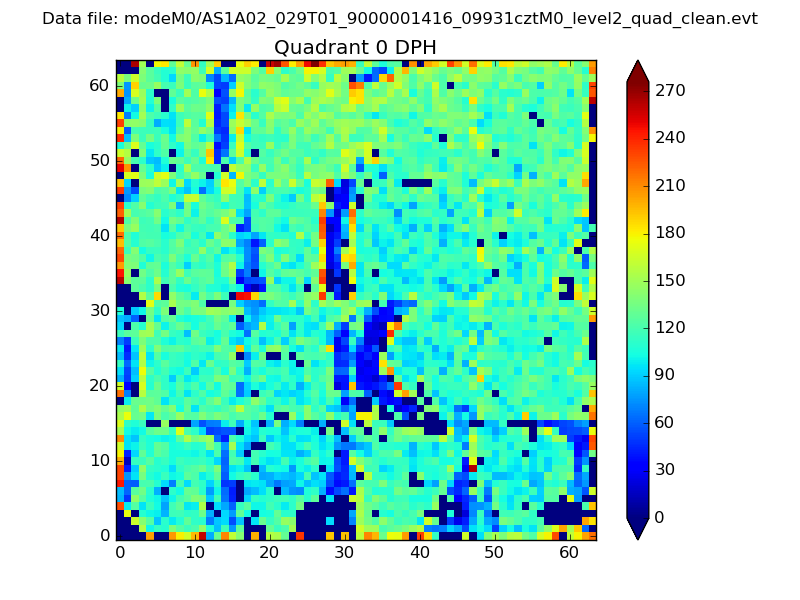 |
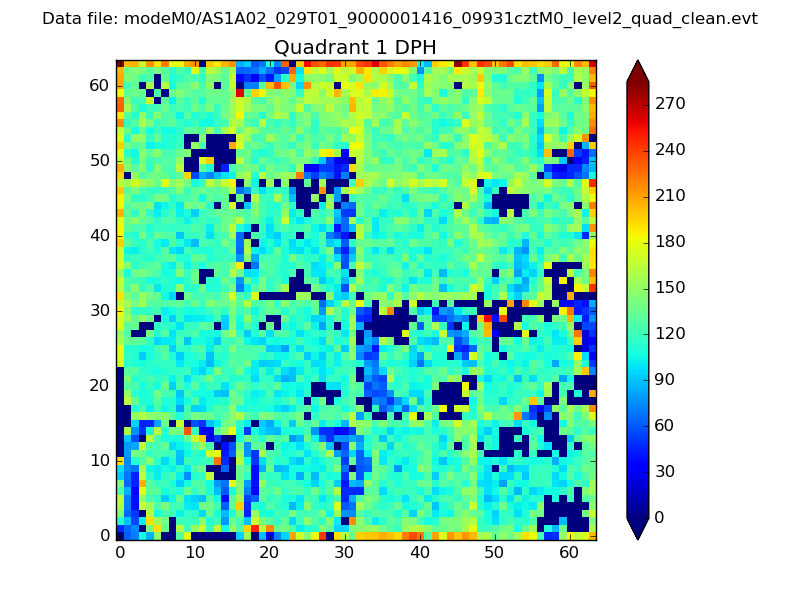 |
Quadrant B |
|---|---|---|---|
| Quadrant D | 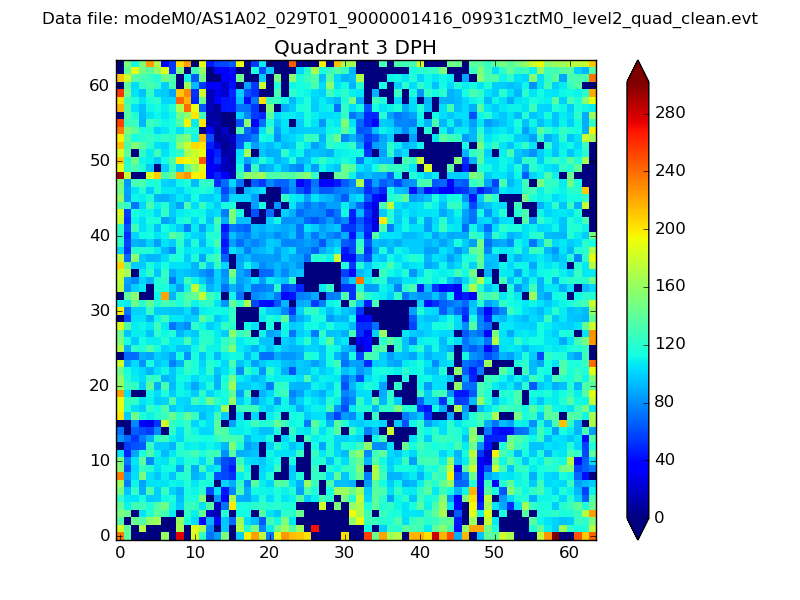 |
 |
Quadrant C |
| Plot type | Count rate plots | Images |
|---|---|---|
| Comparison with Poisson distribution Blue bars denote a histogram of data divided into 1 sec bins. Red curve is a Poisson curve with rate = median count rate of data. |
 |
 |
| Quadrant-wise count rates Data is divided into 100 sec bins |
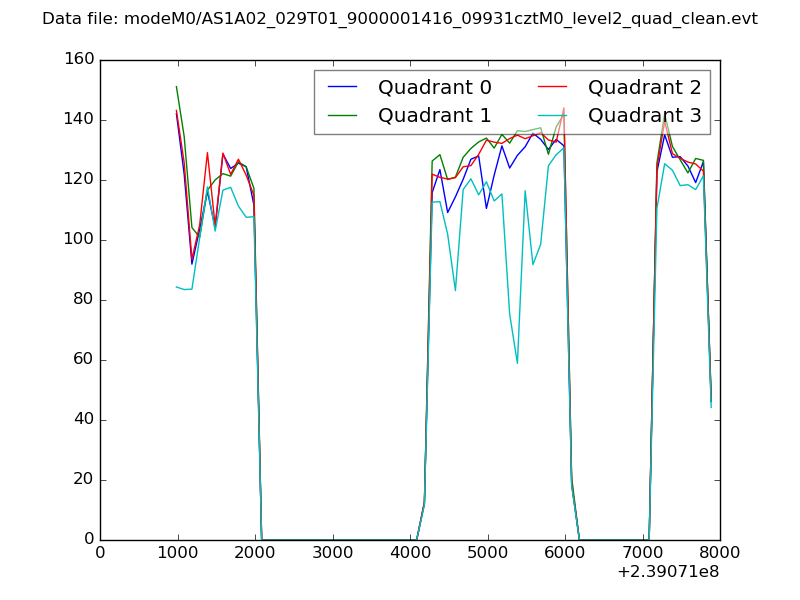 |
|
| Module-wise count rates for Quadrant A Data is divided into 100 sec bins |
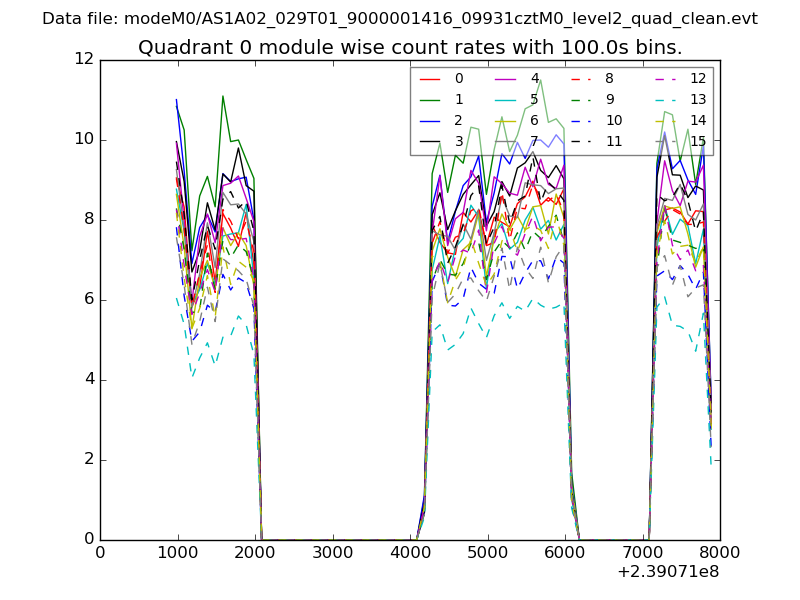 |
 |
| Module-wise count rates for Quadrant B Data is divided into 100 sec bins |
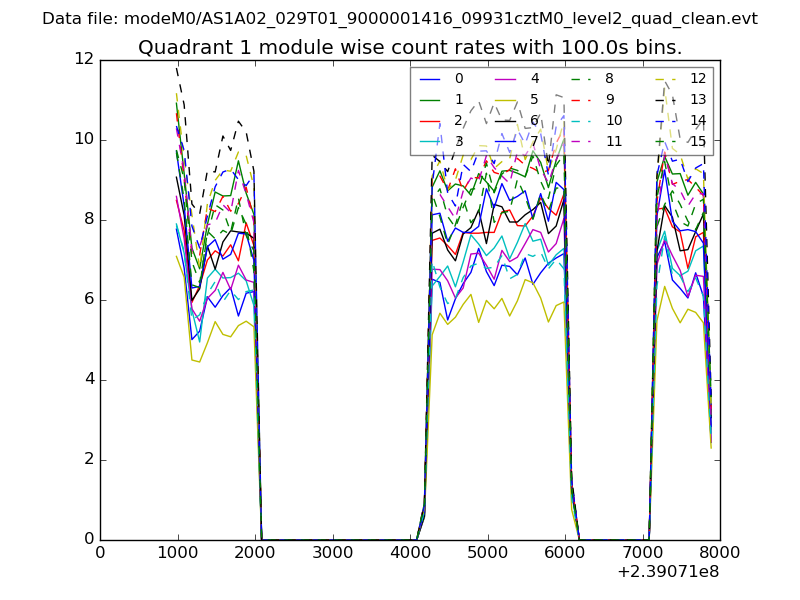 |
 |
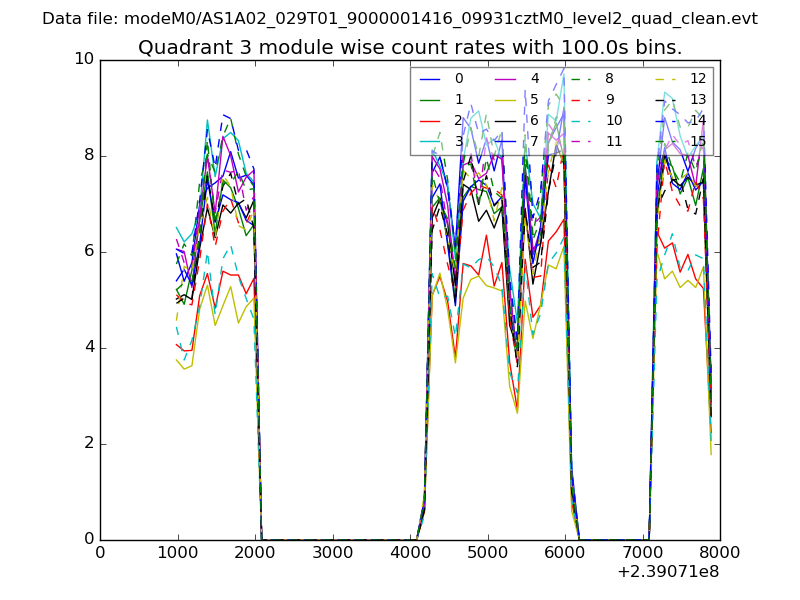
| Module-wise count rates for Quadrant C Data is divided into 100 sec bins |
 |
 |
| Module-wise count rates for Quadrant D Data is divided into 100 sec bins |
 |
 |
| Parameter | Plot |
|---|---|
| CZT HV Monitor |  |
| D_VDD | 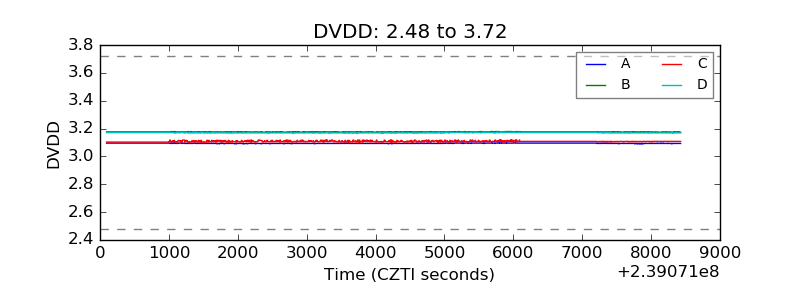 |
| Temperature 1 | 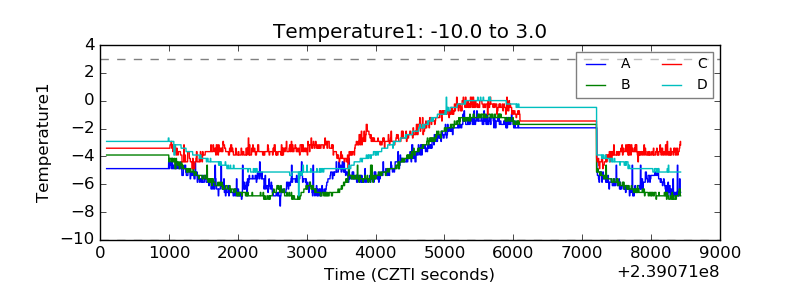 |
| Veto HV Monitor | 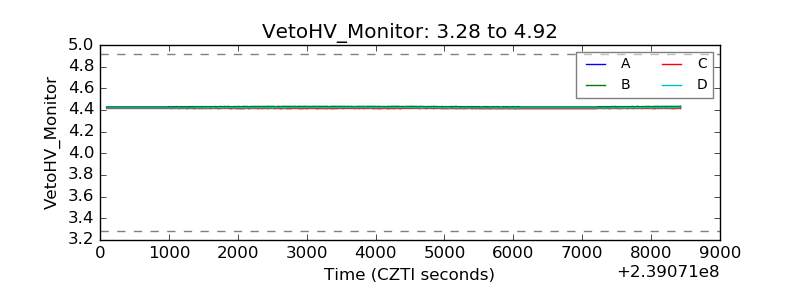 |
| Veto LLD | 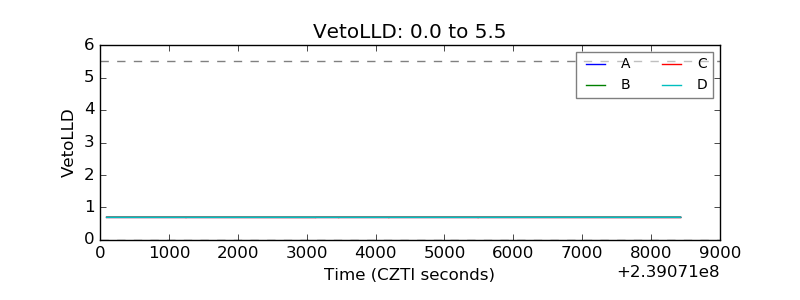 |
| Alpha Counter |  |
| _CPM_Rate | 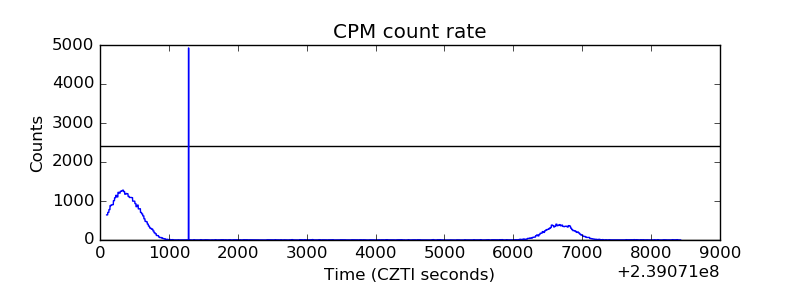 |
| CZT Counter | 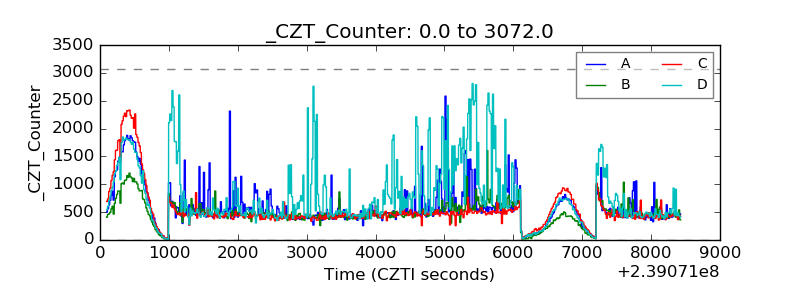 |
| +2.5 Volts monitor |  |
| +5 Volts monitor |  |
| _ROLL_ROT | 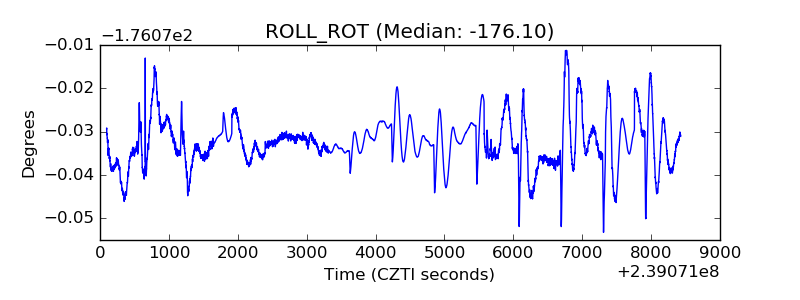 |
| _Roll_DEC | 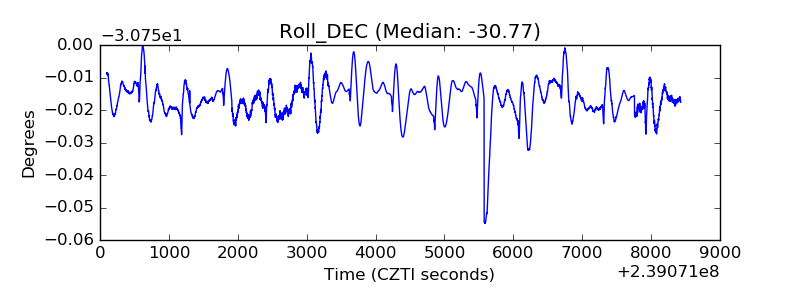 |
| _Roll_RA | 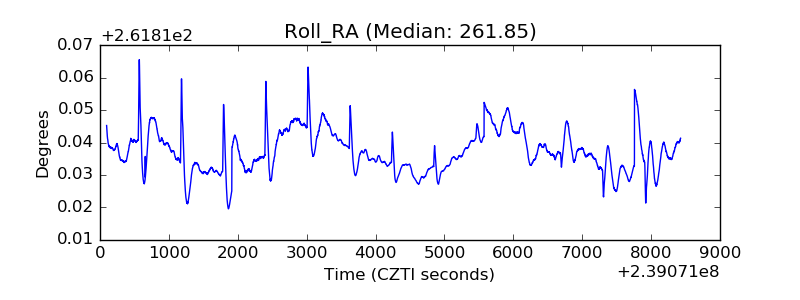 |
| Veto Counter | 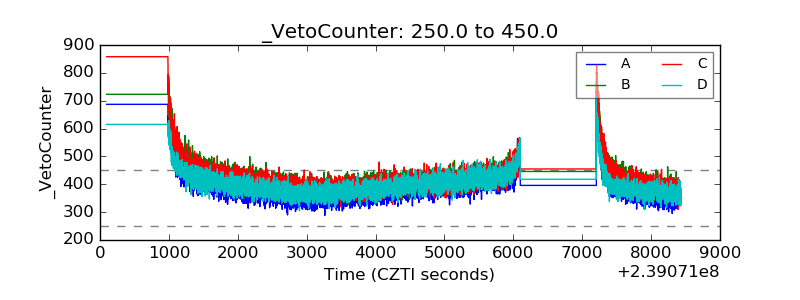 |