| Param | Original file | Final file |
|---|---|---|
| Filename | modeM0/AS1A02_029T01_9000001416_09932cztM0_level2.evt | modeM0/AS1A02_029T01_9000001416_09932cztM0_level2_quad_clean.evt |
| Size (bytes) | 576,532,800 | 89,161,920 |
| Size | 549.8 MB | 85.0 MB |
| Events in quadrant A | 4,434,892 | 545,383 |
| Events in quadrant B | 3,903,913 | 557,012 |
| Events in quadrant C | 3,518,356 | 550,577 |
| Events in quadrant D | 5,079,325 | 509,664 |
| Mode M9 | |||
|---|---|---|---|
| Quadrant | BADHDUFLAG | Total packets | Discarded packets |
| A | 0 | 18 | 0 |
| B | 0 | 18 | 0 |
| C | 0 | 18 | 0 |
| D | 0 | 18 | 0 |
| Mode SS | |||
|---|---|---|---|
| Quadrant | BADHDUFLAG | Total packets | Discarded packets |
| A | 0 | 158 | 0 |
| B | 0 | 158 | 0 |
| C | 0 | 158 | 0 |
| D | 0 | 158 | 0 |
| Mode M0 | |||
|---|---|---|---|
| Quadrant | BADHDUFLAG | Total packets | Discarded packets |
| A | 0 | 18609 | 3 |
| B | 0 | 16784 | 2 |
| C | 0 | 15893 | 2 |
| D | 0 | 20337 | 2 |
| Quadrant | Total seconds | Saturated seconds | Saturation percentage |
|---|---|---|---|
| A | 7727 | 149 | 1.928303% |
| B | 7727 | 86 | 1.112980% |
| C | 7727 | 71 | 0.918856% |
| D | 7727 | 313 | 4.050731% |
Noise dominated data is calculated using 1-second bins in cleaned event files. If a bin has >2000 counts, and if more than 50% of those come from <1% of pixels, then it is considered to be noise-dominated and hence unusable.
| Quadrant | # 1 sec bins | Bins with >0 counts | Bins with >2000 counts | High rate bins dominated by noise | Noise dominated (total time) | Noise dominated (detector-on time) | Marked lightcurve |
|---|---|---|---|---|---|---|---|
| A | 9512 | 7728 | 34 | 34 | 0.36% | 0.44% | 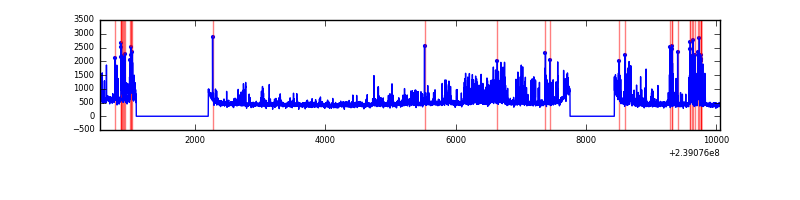 |
| B | 9512 | 7728 | 7 | 7 | 0.07% | 0.09% | 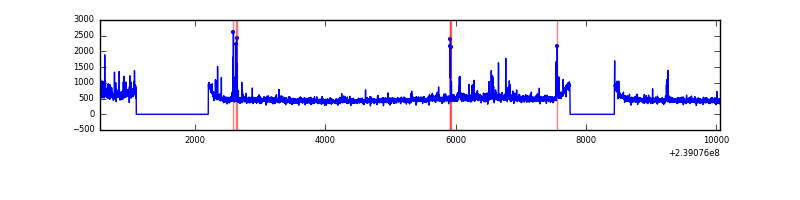 |
| C | 9512 | 7728 | 0 | 0 | 0.00% | 0.00% | 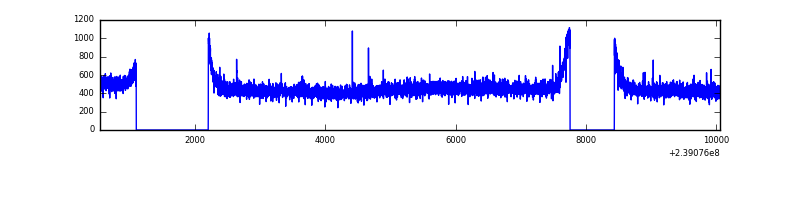 |
| D | 9512 | 7728 | 219 | 219 | 2.30% | 2.83% | 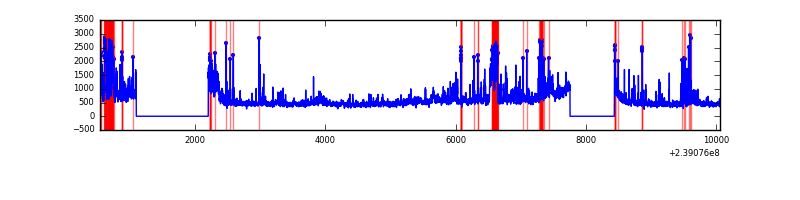 |
Top three noisy pixels from each quadrant. If the there are fewer than three noisy pixels in the level2.evt file, extra rows are filled as -1
| Pixel properties | Quadrant properties | ||||||
|---|---|---|---|---|---|---|---|
| Quadrant | DetID | PixID | Counts | Sigma | Mean | Median | Sigma |
| A | 15 | 239 | 892577 | 4756.73 | 918 | 896 | 187.5 |
| A | 0 | 226 | 8557 | 40.87 | 918 | 896 | 187.5 |
| A | 12 | 194 | 7694 | 36.26 | 918 | 896 | 187.5 |
| B | 0 | 214 | 80876 | 447.52 | 930 | 908 | 178.7 |
| B | 4 | 81 | 79761 | 441.28 | 930 | 908 | 178.7 |
| B | 4 | 239 | 55691 | 306.58 | 930 | 908 | 178.7 |
| C | 12 | 4 | 10981 | 48.27 | 898 | 902 | 208.8 |
| C | 13 | 61 | 6795 | 28.22 | 898 | 902 | 208.8 |
| C | 0 | 207 | 2781 | 9.0 | 898 | 902 | 208.8 |
| D | 2 | 16 | 559737 | 2465.43 | 875 | 852 | 226.7 |
| D | 8 | 195 | 341293 | 1501.8 | 875 | 852 | 226.7 |
| D | 2 | 33 | 330242 | 1453.05 | 875 | 852 | 226.7 |
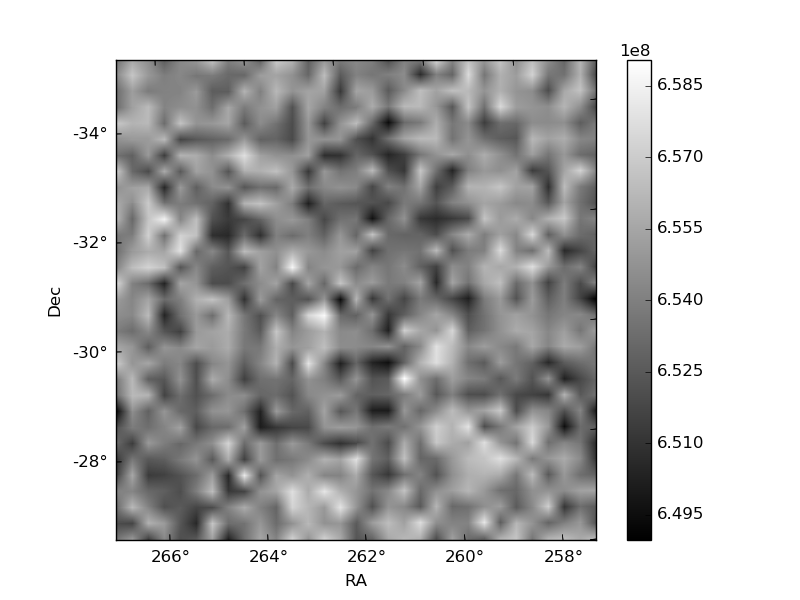
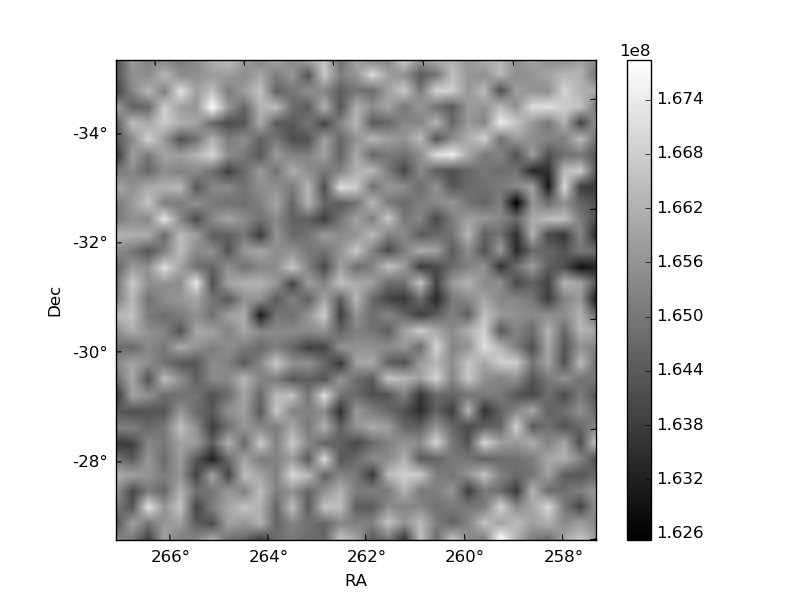
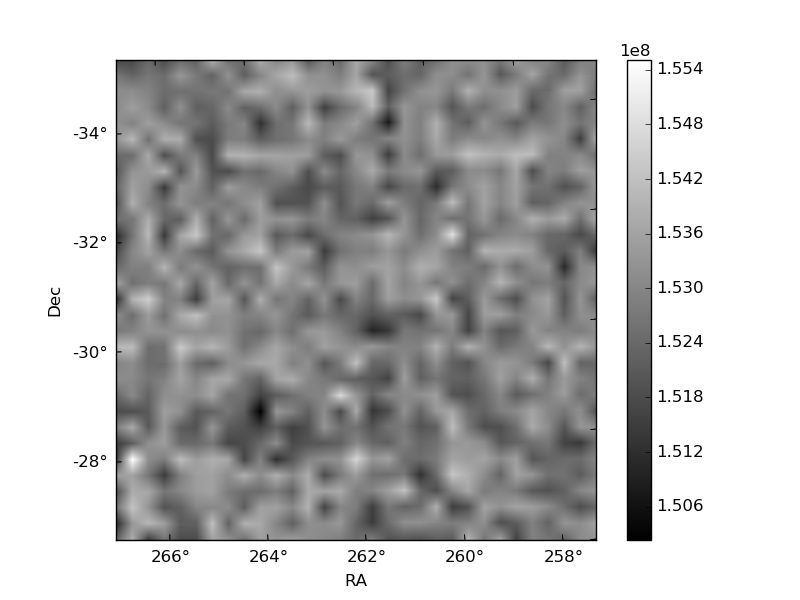
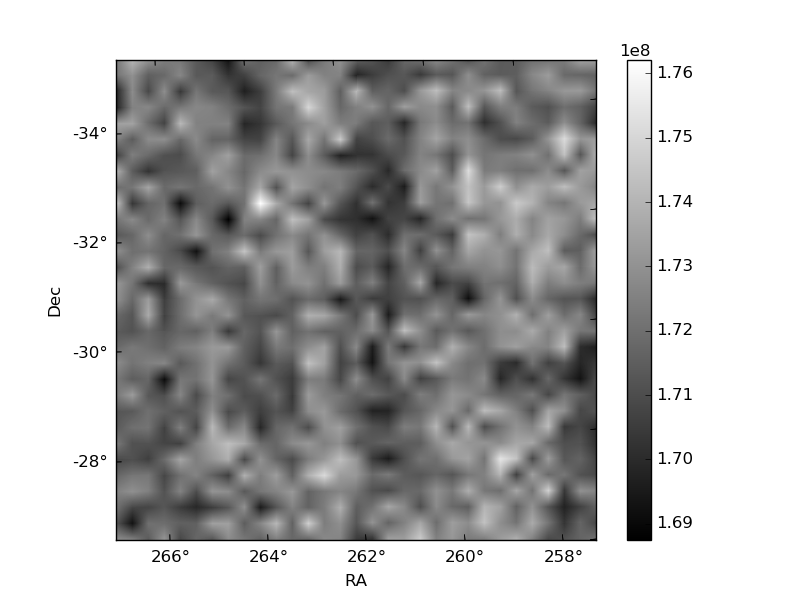
Histogram calculated using DETX and DETY for each event in the final _common_clean file
| Quadrant A | 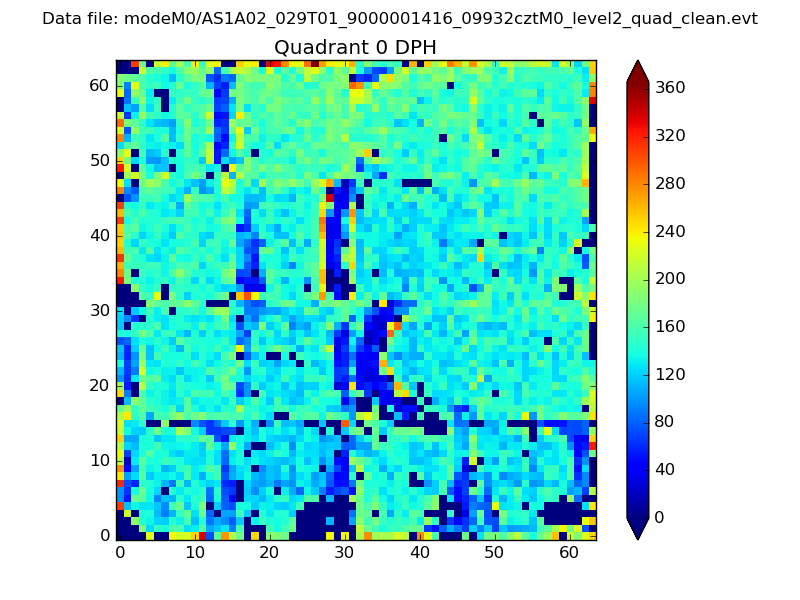 |
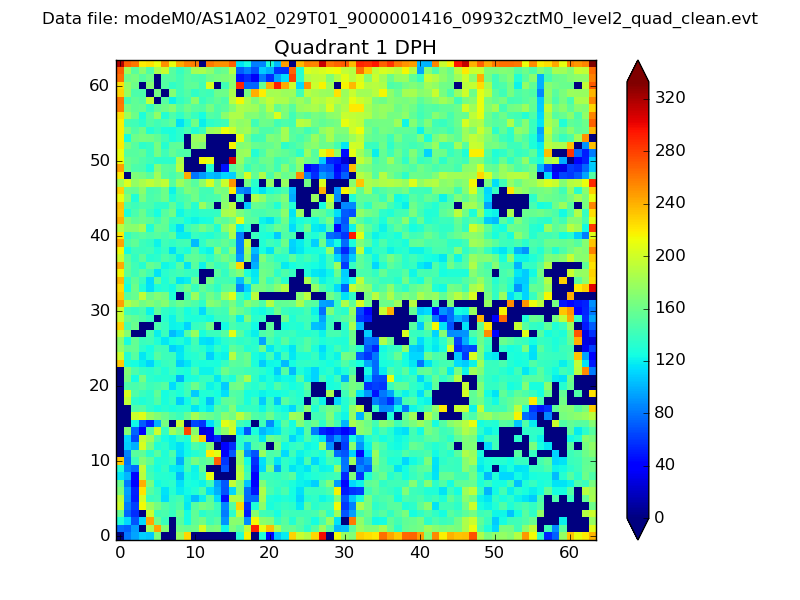 |
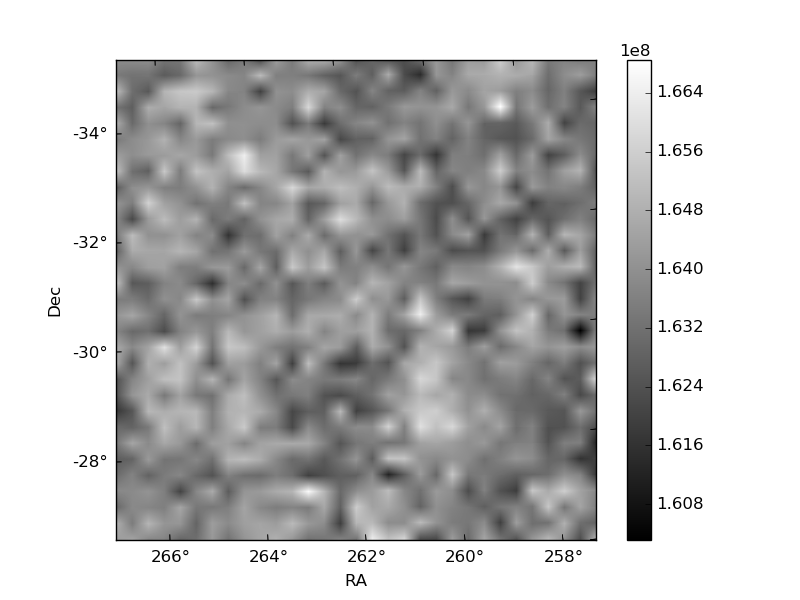
Quadrant B |
|---|---|---|---|
| Quadrant D | 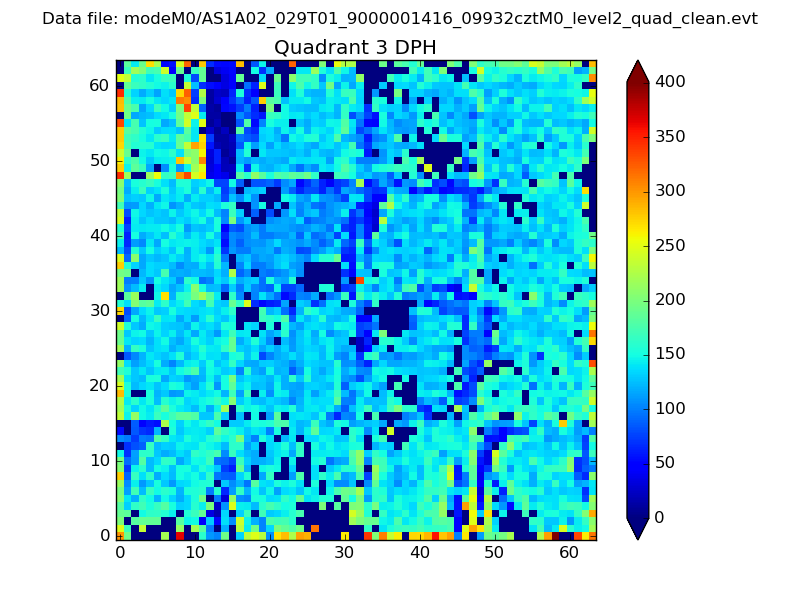 |
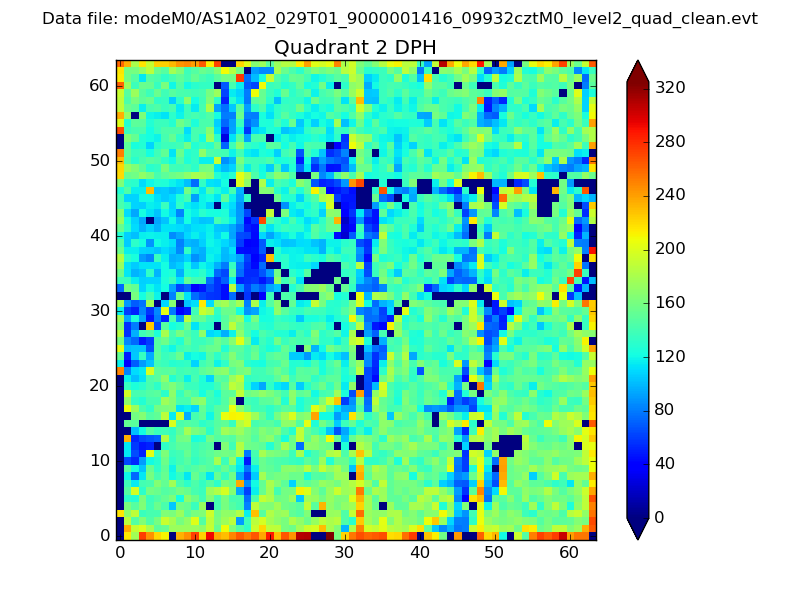 |
Quadrant C |
| Plot type | Count rate plots | Images |
|---|---|---|
| Comparison with Poisson distribution Blue bars denote a histogram of data divided into 1 sec bins. Red curve is a Poisson curve with rate = median count rate of data. |
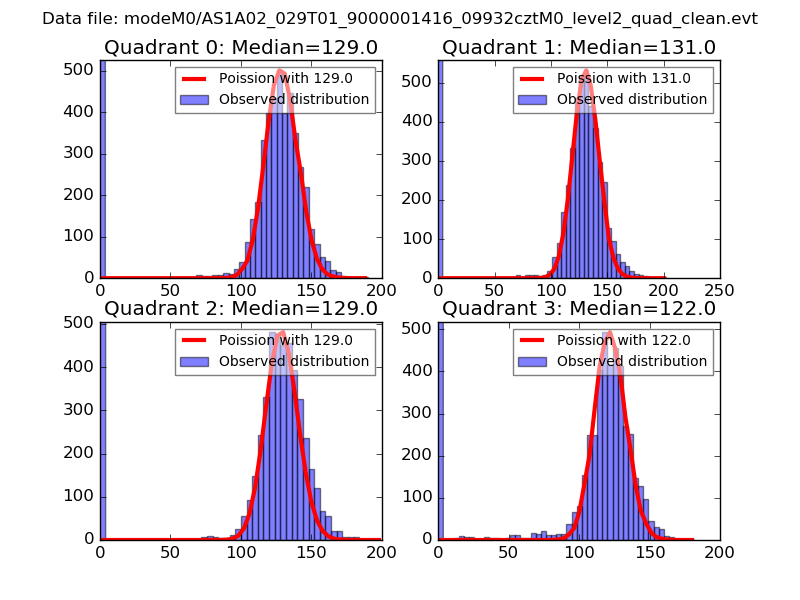 |
 |
| Quadrant-wise count rates Data is divided into 100 sec bins |
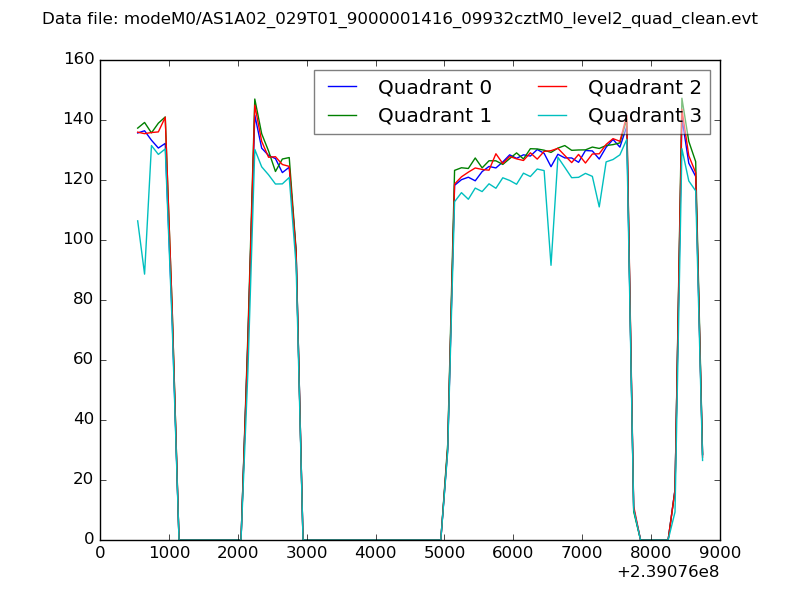 |
|
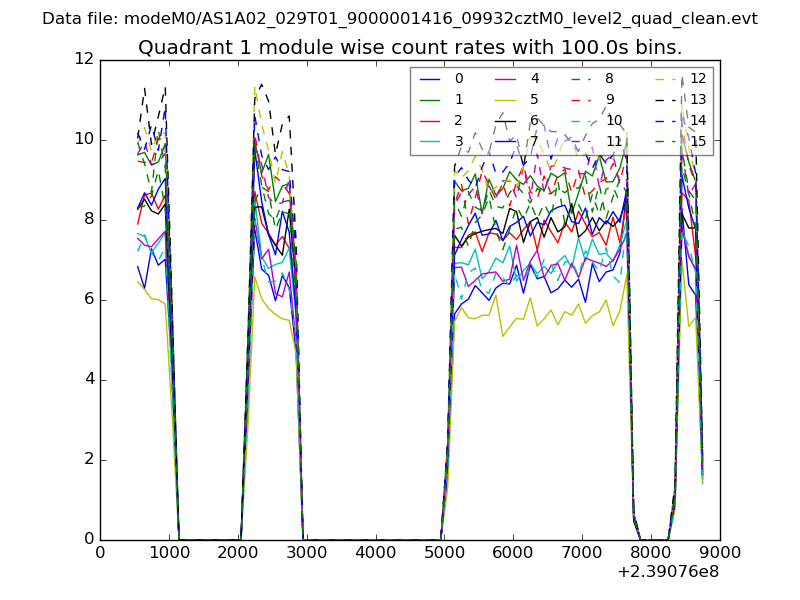
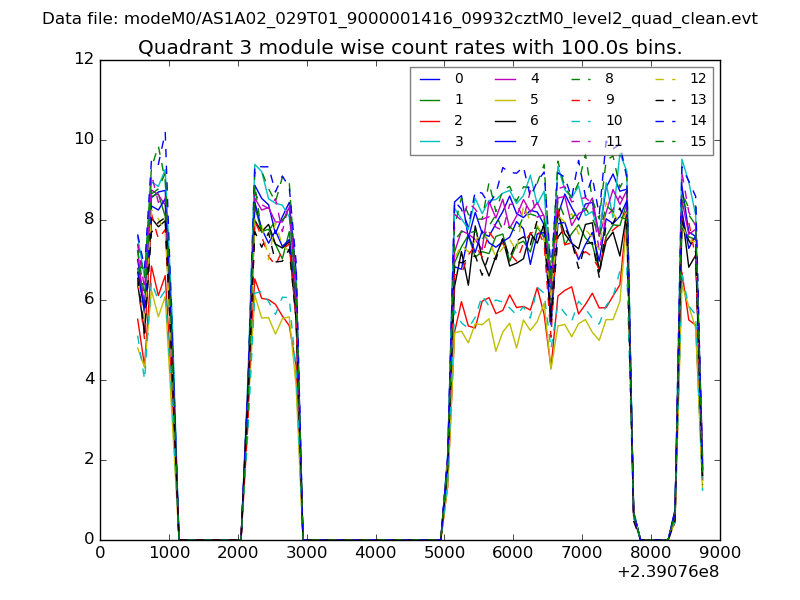
| Module-wise count rates for Quadrant A Data is divided into 100 sec bins |
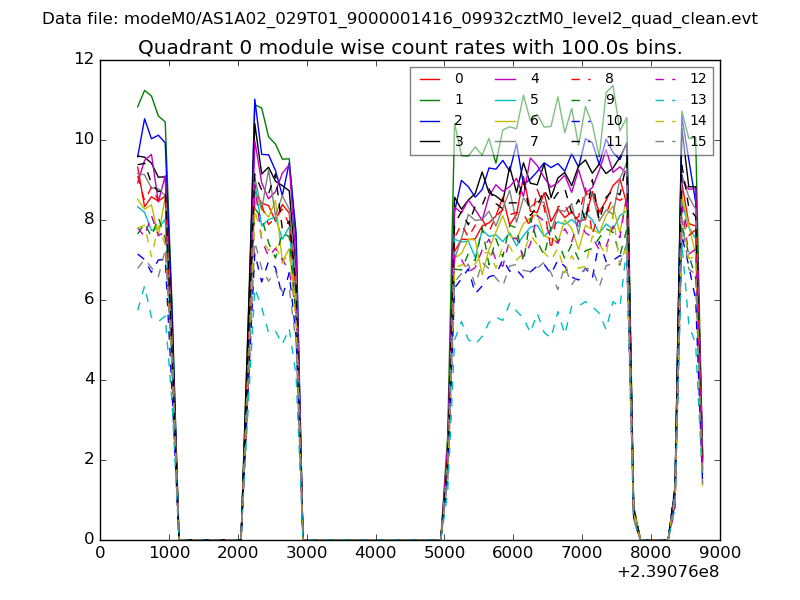 |
 |
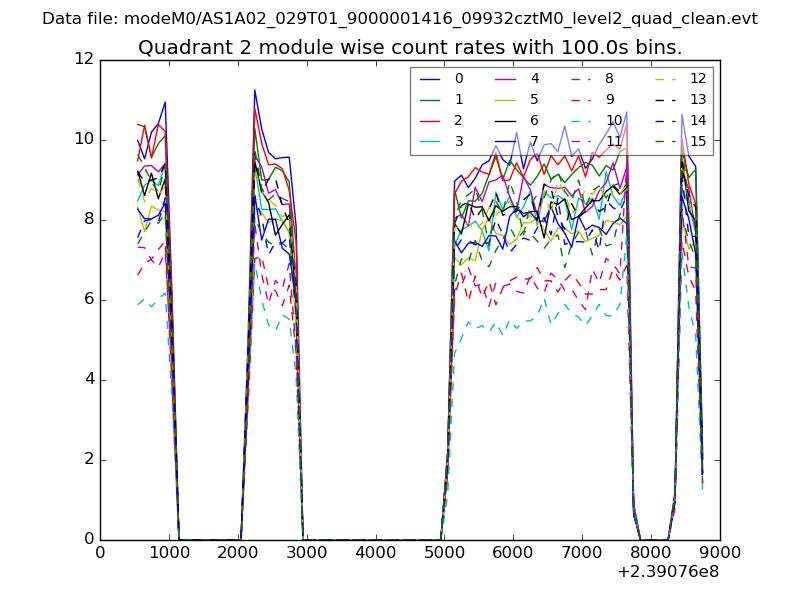
| Module-wise count rates for Quadrant B Data is divided into 100 sec bins |
 |
 |
| Module-wise count rates for Quadrant C Data is divided into 100 sec bins |
 |
 |
| Module-wise count rates for Quadrant D Data is divided into 100 sec bins |
 |
 |
| Parameter | Plot |
|---|---|
| CZT HV Monitor | 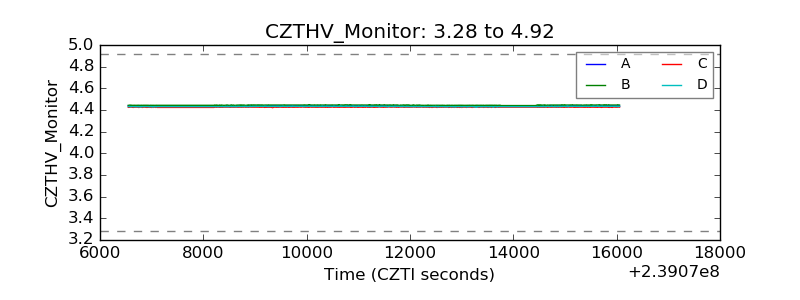 |
| D_VDD | 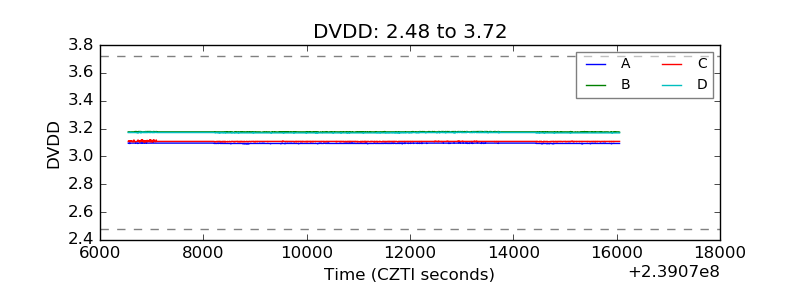 |
| Temperature 1 | 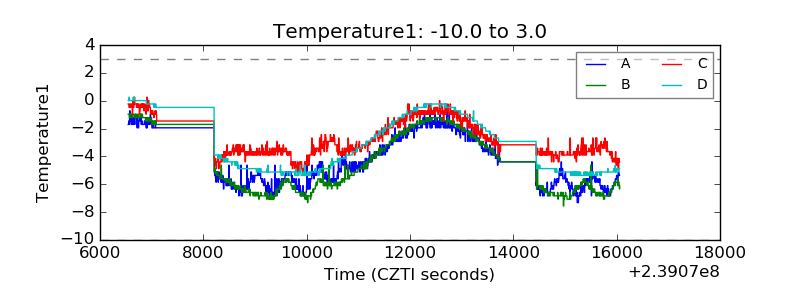 |
| Veto HV Monitor | 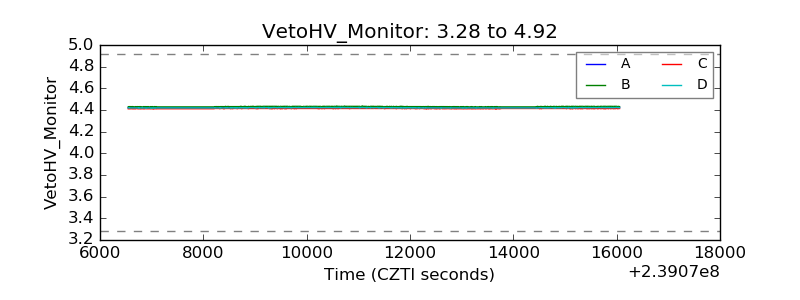 |
| Veto LLD | 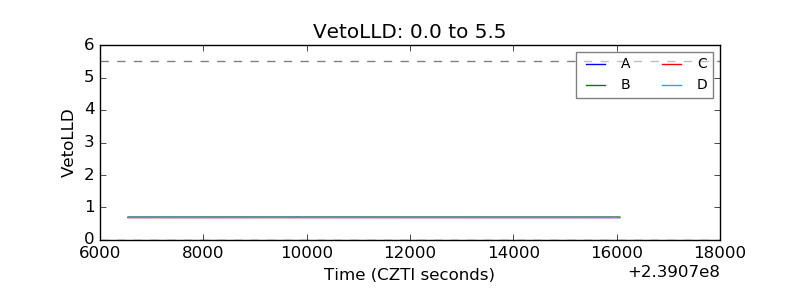 |
| Alpha Counter | 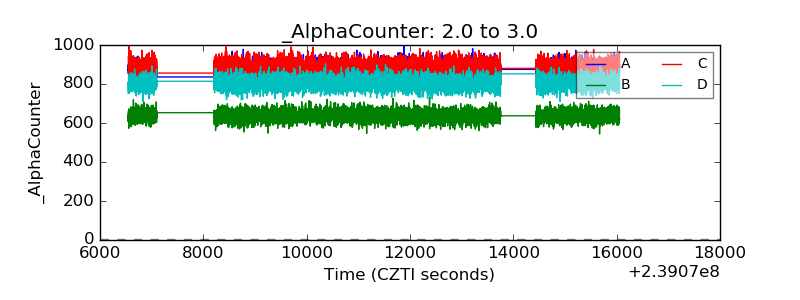 |
| _CPM_Rate | 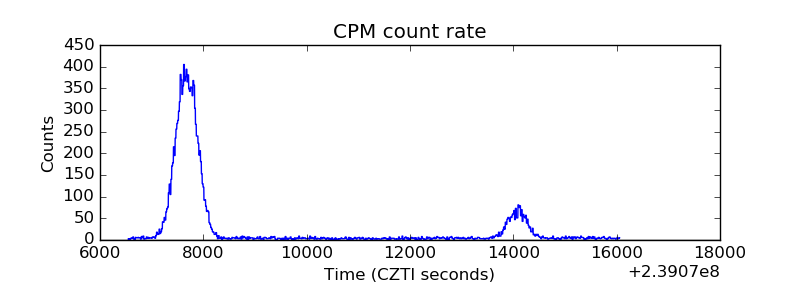 |
| CZT Counter | 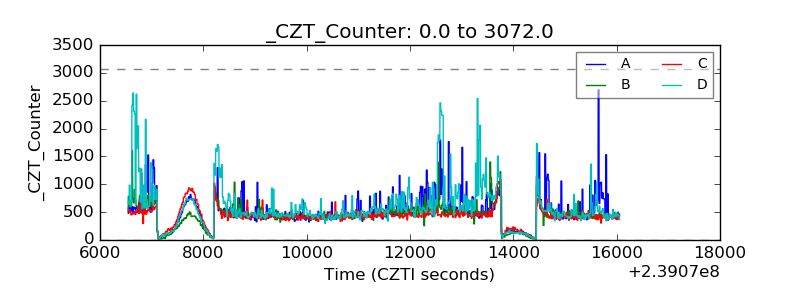 |
| +2.5 Volts monitor |  |
| +5 Volts monitor |  |
| _ROLL_ROT | 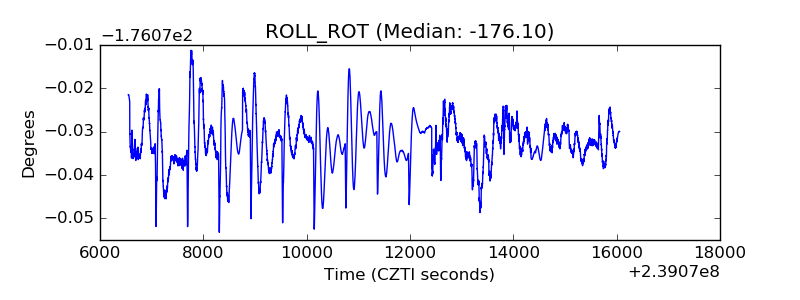 |
| _Roll_DEC | 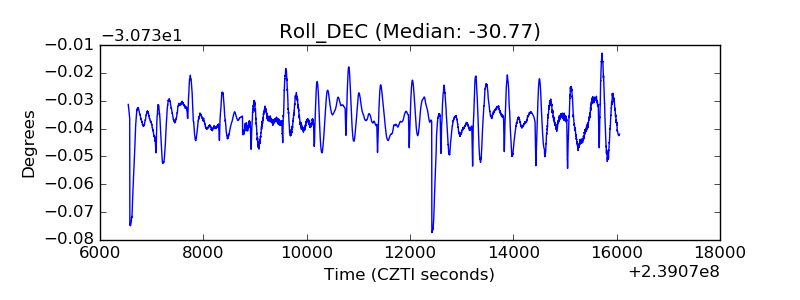 |
| _Roll_RA | 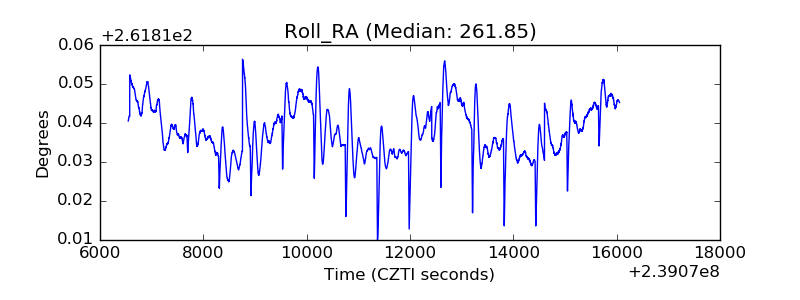 |
| Veto Counter | 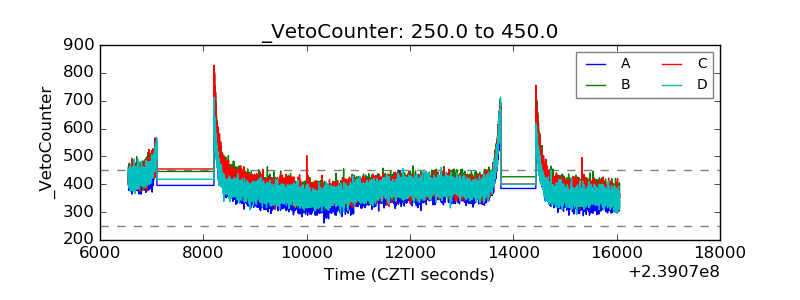 |