| Param | Original file | Final file |
|---|---|---|
| Filename | modeM0/AS1G07_027T01_9000001414cztM0_level2.fits | modeM0/AS1G07_027T01_9000001414cztM0_level2_quad_clean.evt |
| Size (bytes) | 139,746,240 | 152,637,120 |
| Size | 133.3 MB | 145.6 MB |
| Events in quadrant A | 835,472 | 954,576 |
| Events in quadrant B | 813,416 | 960,148 |
| Events in quadrant C | 832,012 | 909,257 |
| Events in quadrant D | 682,094 | 729,761 |
| Mode M0 | |||
|---|---|---|---|
| Quadrant | BADHDUFLAG | Total packets | Discarded packets |
| A | 0 | 35361 | 0 |
| B | 0 | 32319 | 0 |
| C | 0 | 31446 | 0 |
| D | 0 | 56785 | 0 |
| Mode SS | |||
|---|---|---|---|
| Quadrant | BADHDUFLAG | Total packets | Discarded packets |
| A | 0 | 318 | 0 |
| B | 0 | 318 | 0 |
| C | 0 | 318 | 0 |
| D | 0 | 318 | 0 |
| Mode M9 | |||
|---|---|---|---|
| Quadrant | BADHDUFLAG | Total packets | Discarded packets |
| A | 0 | 18 | 0 |
| B | 0 | 18 | 0 |
| C | 0 | 18 | 0 |
| D | 0 | 18 | 0 |
| Quadrant | Total seconds | Saturated seconds | Saturation percentage |
|---|---|---|---|
| A | 15479 | 353 | 2.280509% |
| B | 15476 | 263 | 1.699406% |
| C | 15479 | 187 | 1.208088% |
| D | 15476 | 1757 | 11.353063% |
Noise dominated data is calculated using 1-second bins in cleaned event files. If a bin has >2000 counts, and if more than 50% of those come from <1% of pixels, then it is considered to be noise-dominated and hence unusable.
| Quadrant | # 1 sec bins | Bins with >0 counts | Bins with >2000 counts | High rate bins dominated by noise | Noise dominated (total time) | Noise dominated (detector-on time) | Marked lightcurve |
|---|---|---|---|---|---|---|---|
| A | 17336 | 15476 | 0 | 0 | 0.00% | 0.00% | 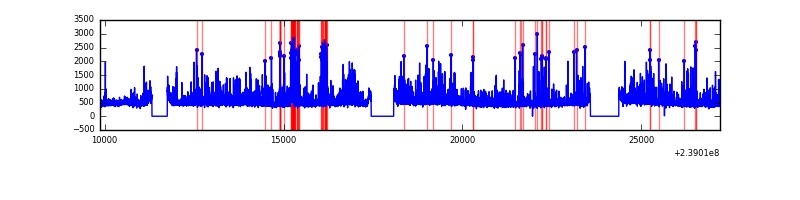 |
| B | 17336 | 15477 | 0 | 0 | 0.00% | 0.00% | 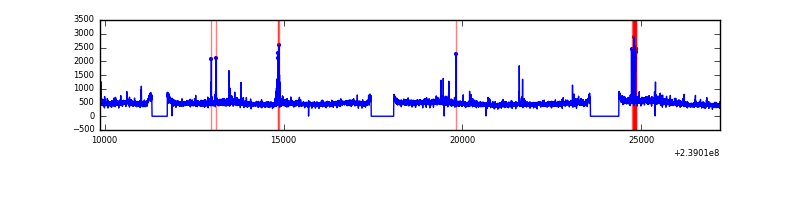 |
| C | 17335 | 15475 | 0 | 0 | 0.00% | 0.00% | 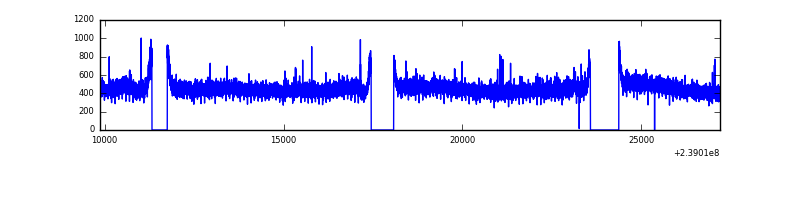 |
| D | 17335 | 15474 | 0 | 0 | 0.00% | 0.00% | 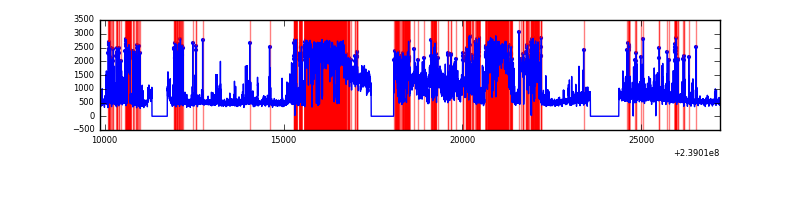 |
Top three noisy pixels from each quadrant. If the there are fewer than three noisy pixels in the level2.evt file, extra rows are filled as -1
| Pixel properties | Quadrant properties | ||||||
|---|---|---|---|---|---|---|---|
| Quadrant | DetID | PixID | Counts | Sigma | Mean | Median | Sigma |
| A | 14 | 188 | 893 | 11.94 | 216 | 202 | 57.9 |
| A | 0 | 29 | 796 | 10.26 | 216 | 202 | 57.9 |
| A | 14 | 204 | 761 | 9.66 | 216 | 202 | 57.9 |
| B | 2 | 9 | 683 | 10.65 | 214 | 203 | 45.1 |
| B | 3 | 17 | 581 | 8.39 | 214 | 203 | 45.1 |
| B | 14 | 254 | 541 | 7.5 | 214 | 203 | 45.1 |
| C | 12 | 241 | 597 | 6.62 | 219 | 203 | 59.6 |
| C | 3 | 158 | 576 | 6.26 | 219 | 203 | 59.6 |
| C | 9 | 242 | 562 | 6.03 | 219 | 203 | 59.6 |
| D | 6 | 67 | 522 | 6.43 | 193 | 175 | 53.9 |
| D | 11 | 82 | 516 | 6.32 | 193 | 175 | 53.9 |
| D | 3 | 14 | 513 | 6.27 | 193 | 175 | 53.9 |
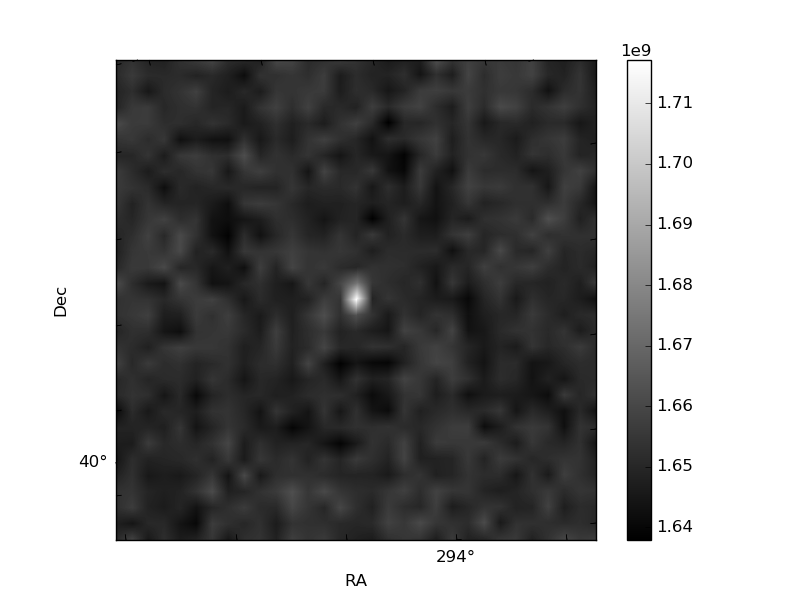
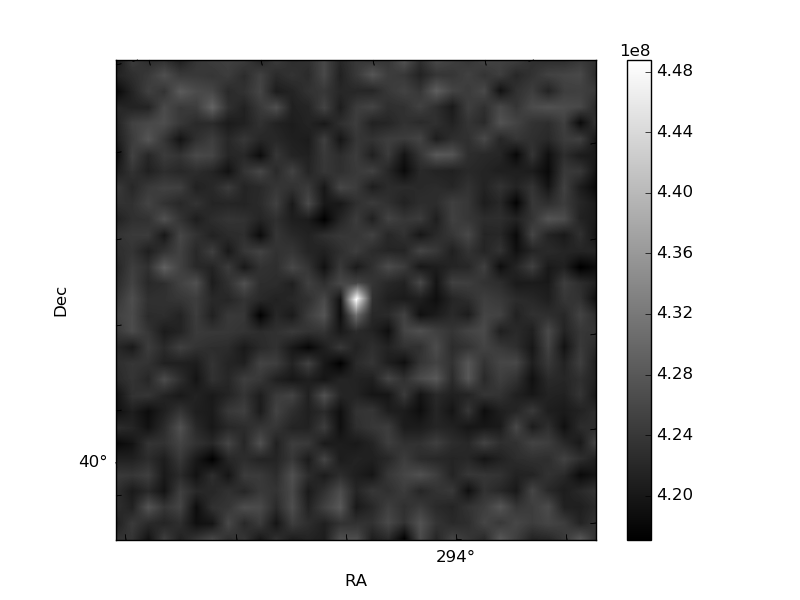
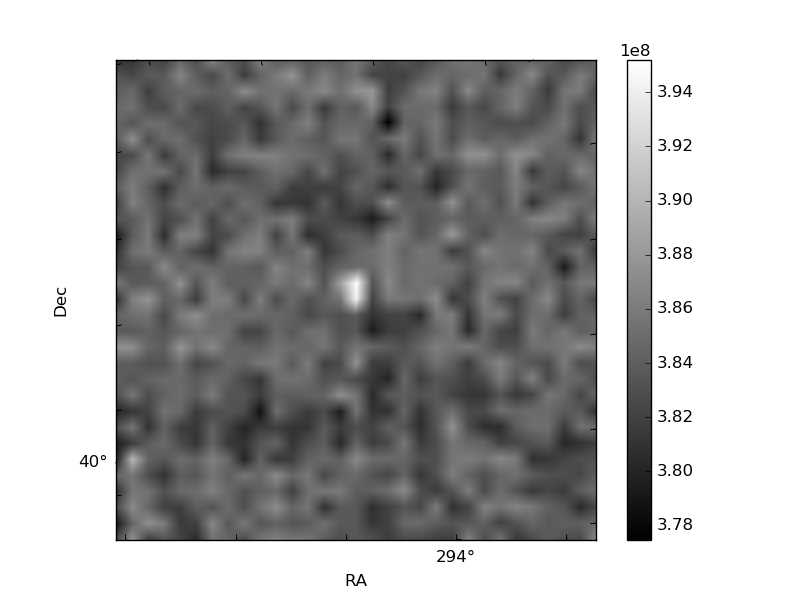
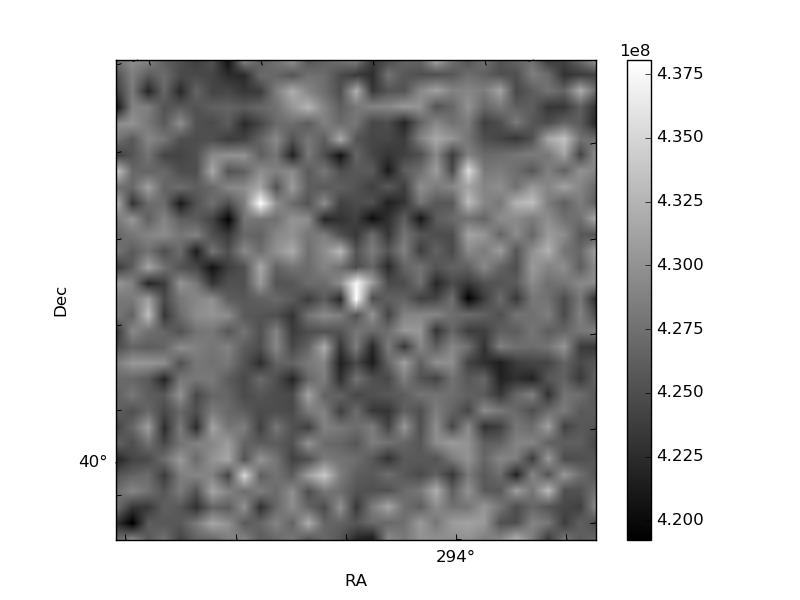
Histogram calculated using DETX and DETY for each event in the final _common_clean file
| Quadrant A | 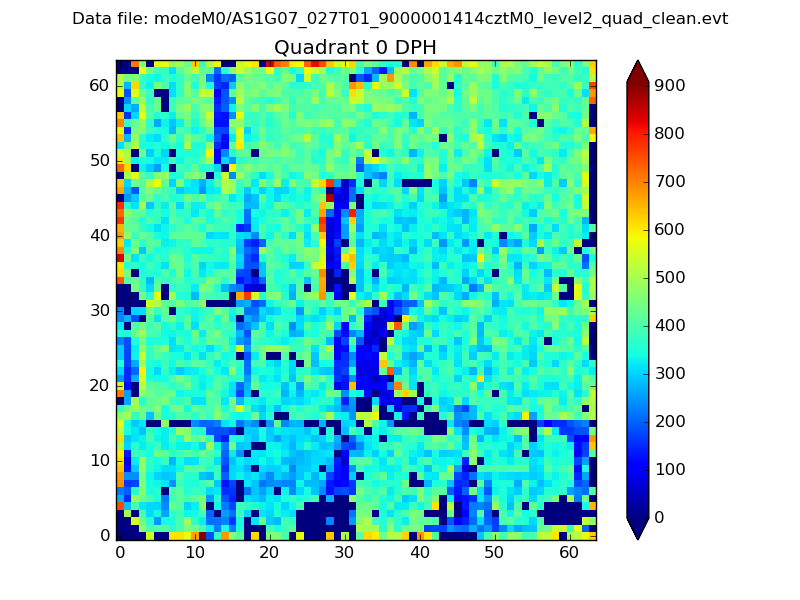 |
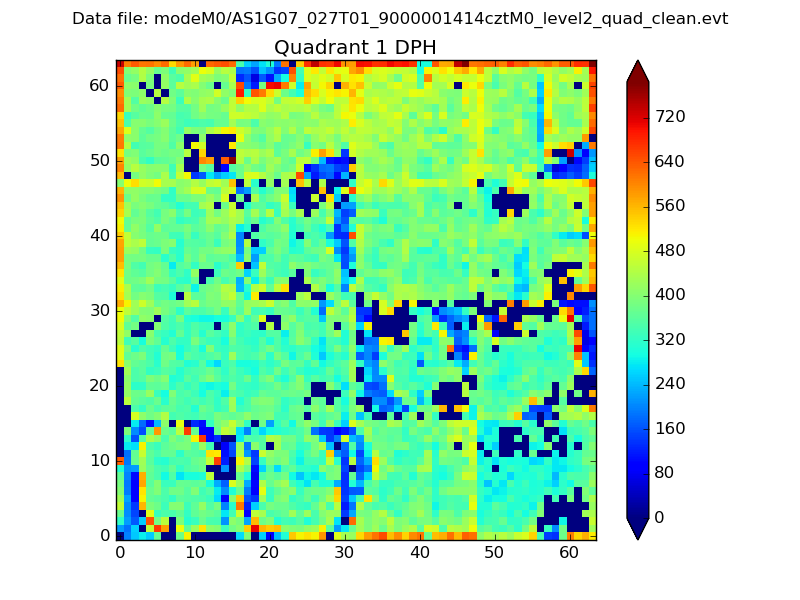 |
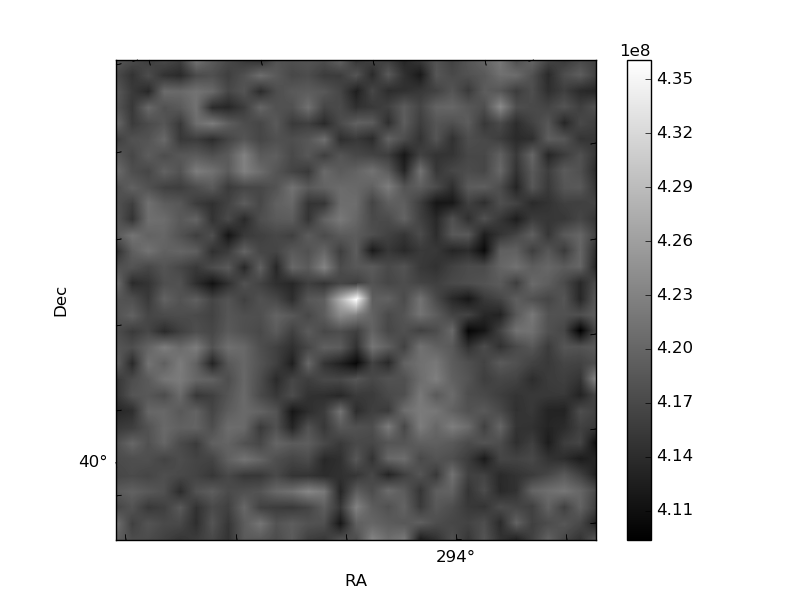
Quadrant B |
|---|---|---|---|
| Quadrant D | 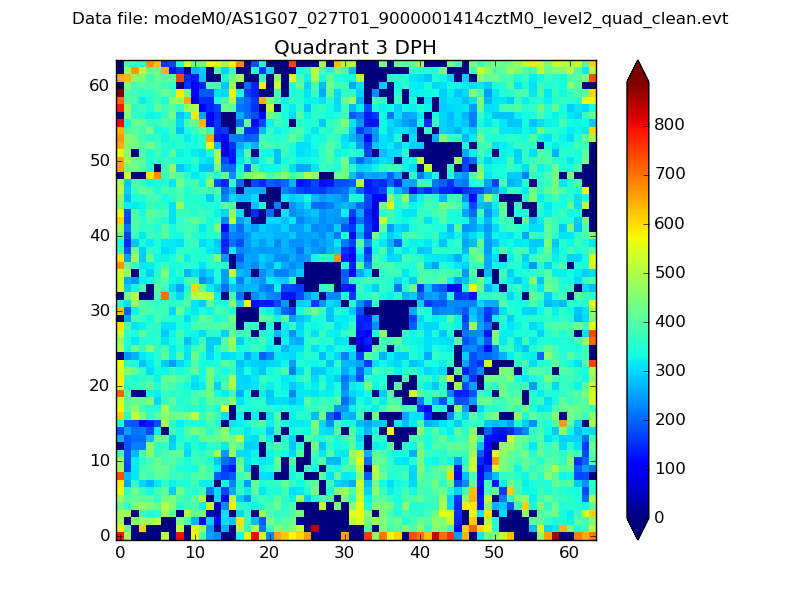 |
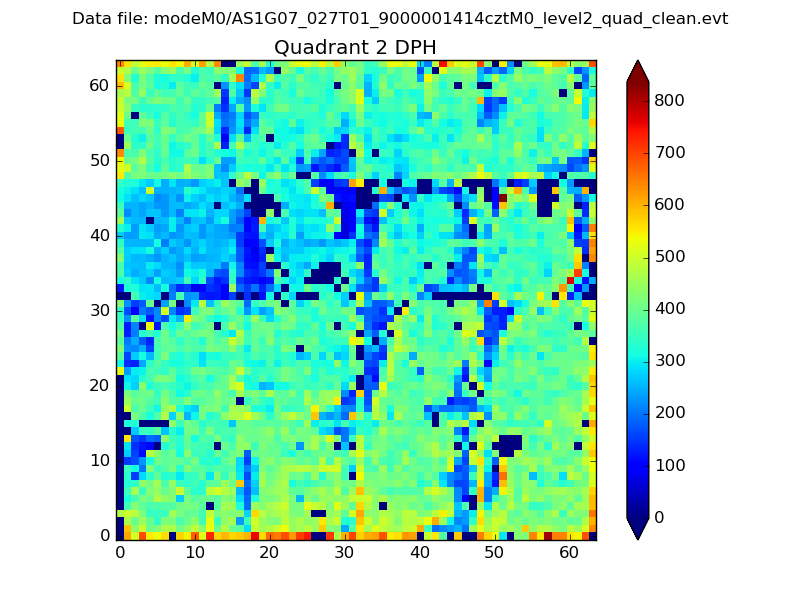 |
Quadrant C |
| Plot type | Count rate plots | Images |
|---|---|---|
| Comparison with Poisson distribution Blue bars denote a histogram of data divided into 1 sec bins. Red curve is a Poisson curve with rate = median count rate of data. |
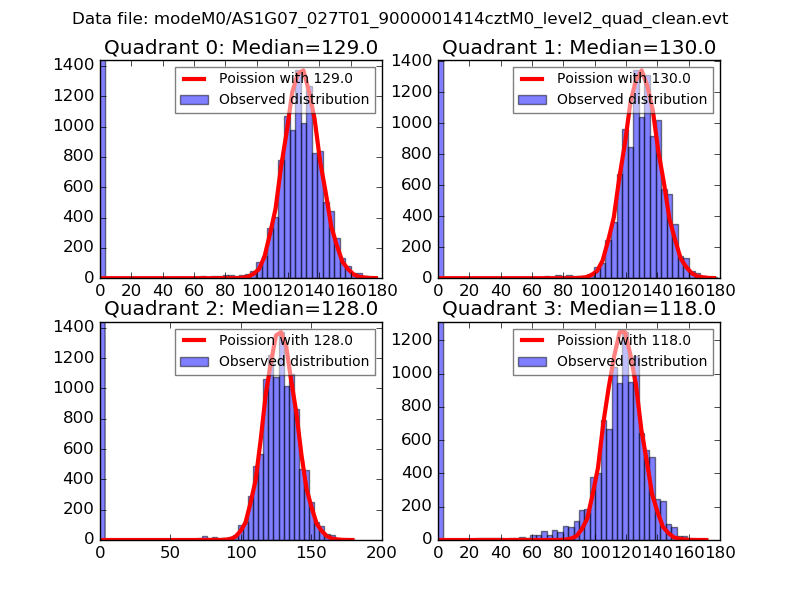 |
 |
| Quadrant-wise count rates Data is divided into 100 sec bins |
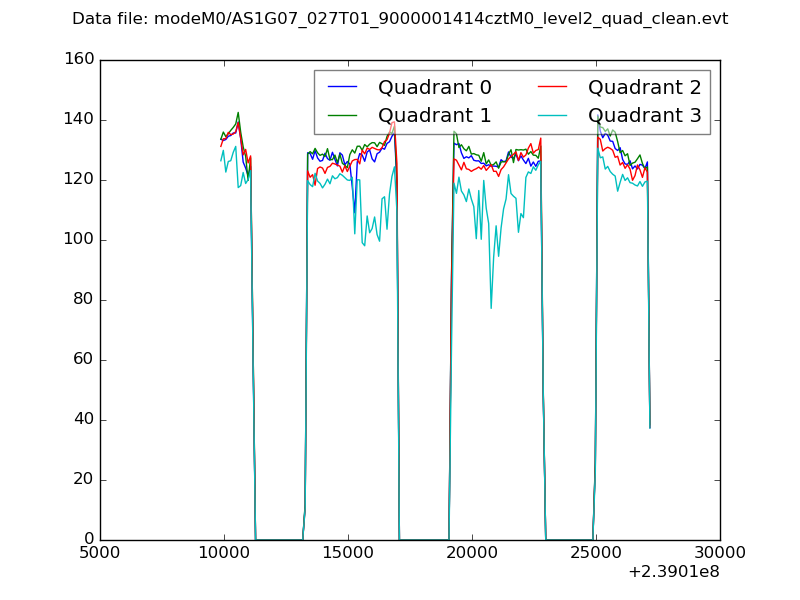 |
|
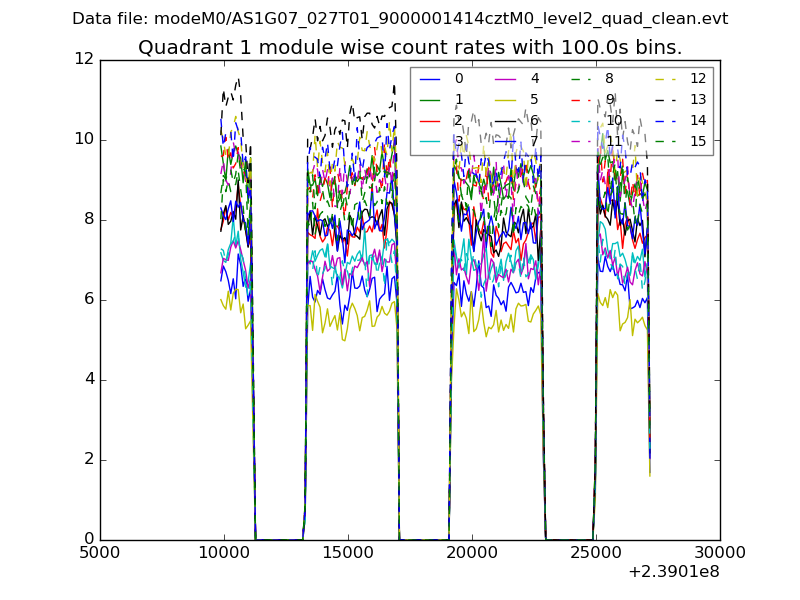
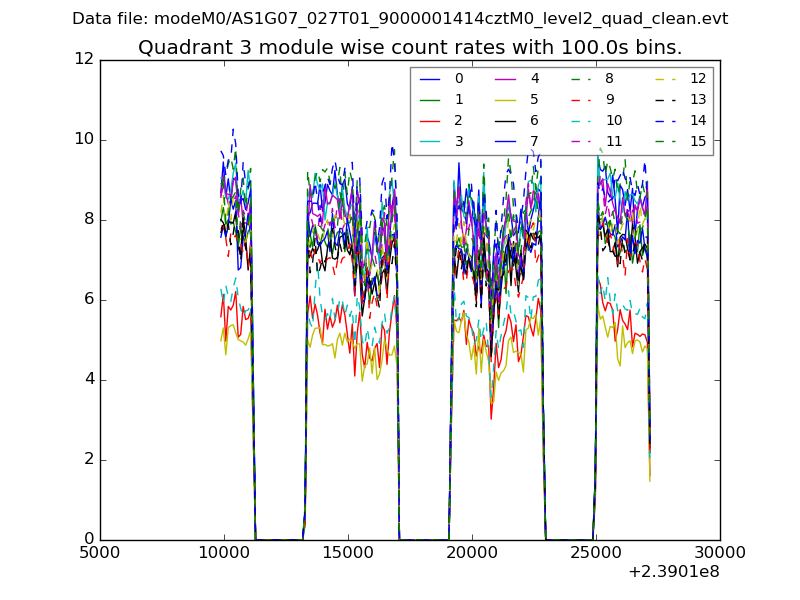
| Module-wise count rates for Quadrant A Data is divided into 100 sec bins |
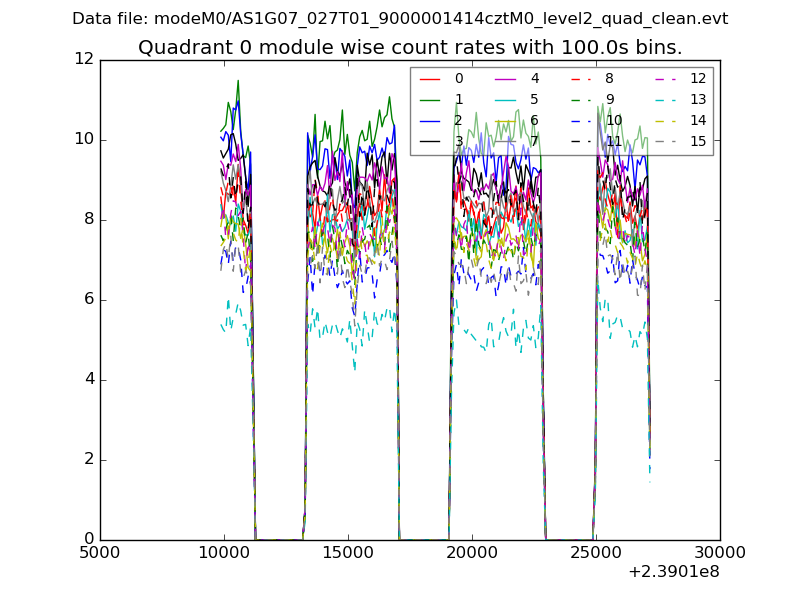 |
 |
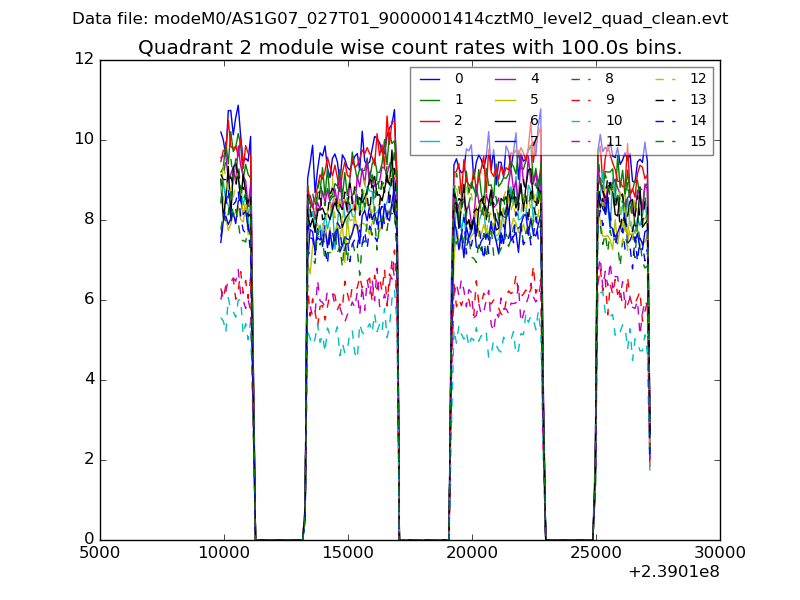
| Module-wise count rates for Quadrant B Data is divided into 100 sec bins |
 |
 |
| Module-wise count rates for Quadrant C Data is divided into 100 sec bins |
 |
 |
| Module-wise count rates for Quadrant D Data is divided into 100 sec bins |
 |
 |
| Parameter | Plot |
|---|---|
| CZT HV Monitor | 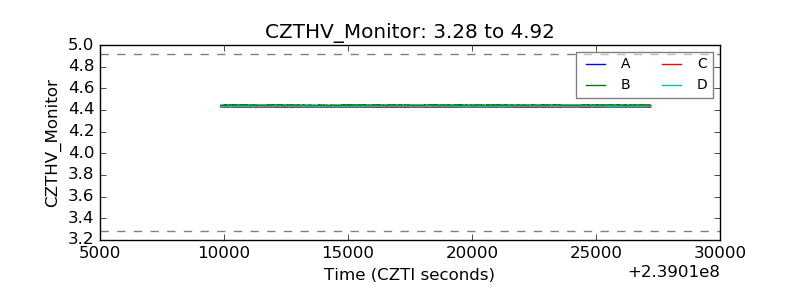 |
| D_VDD | 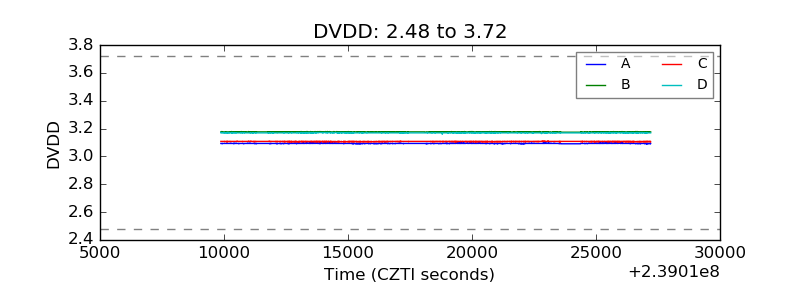 |
| Temperature 1 | 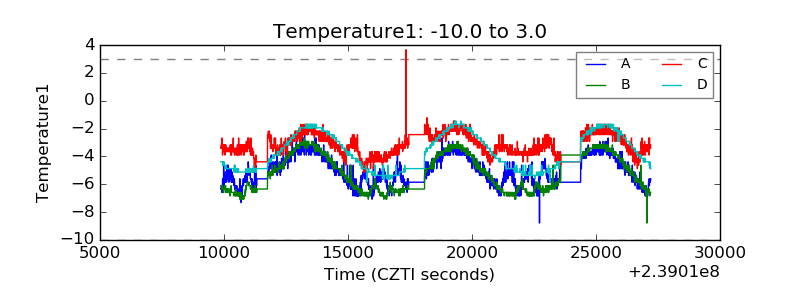 |
| Veto HV Monitor | 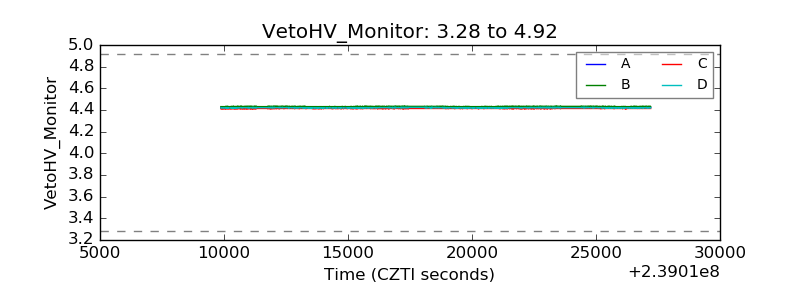 |
| Veto LLD | 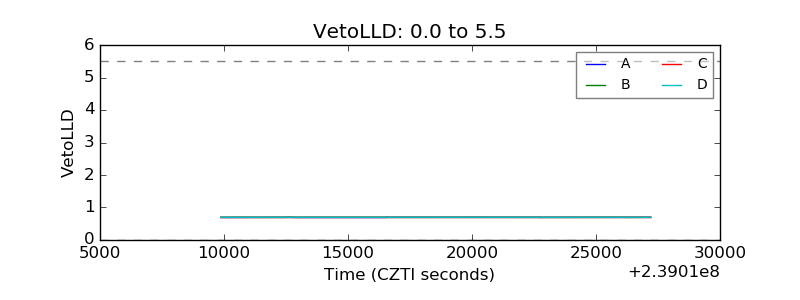 |
| Alpha Counter | 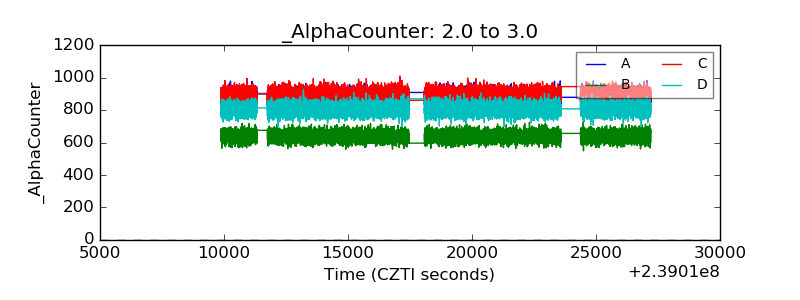 |
| _CPM_Rate | 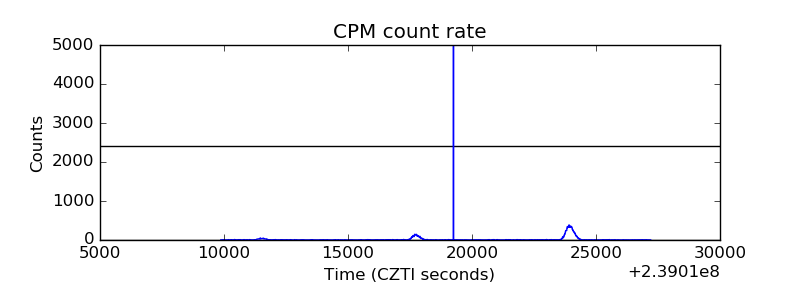 |
| CZT Counter | 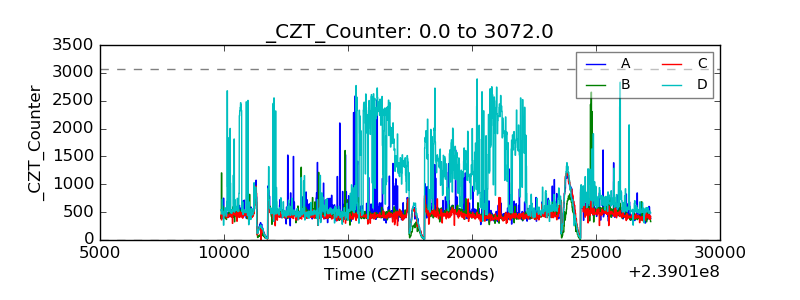 |
| +2.5 Volts monitor | 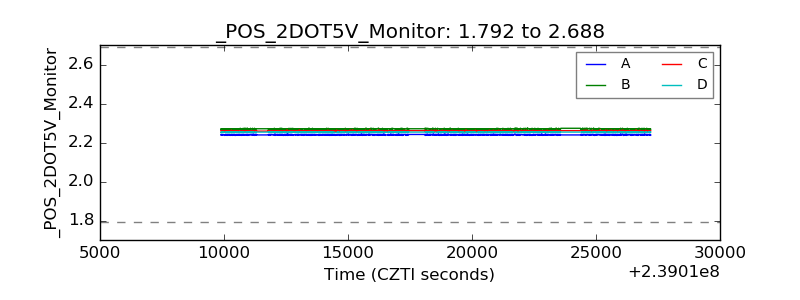 |
| +5 Volts monitor | 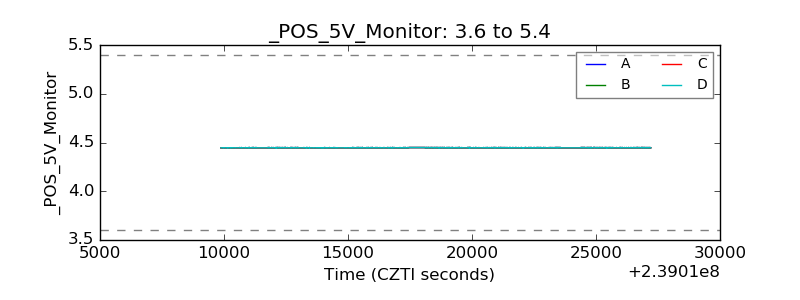 |
| _ROLL_ROT | 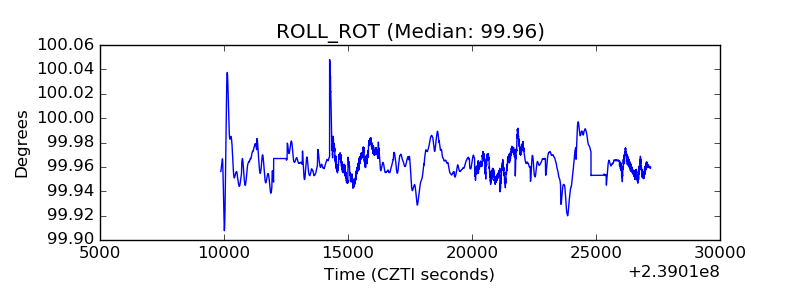 |
| _Roll_DEC | 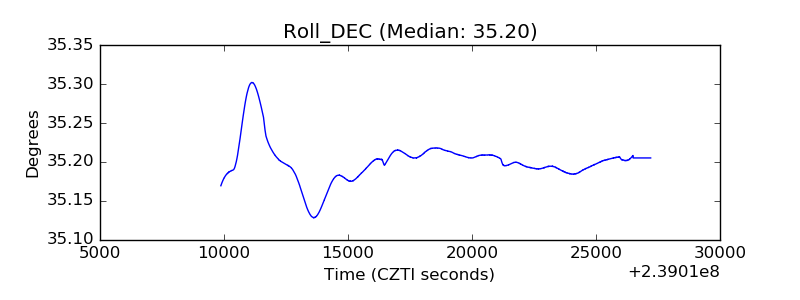 |
| _Roll_RA | 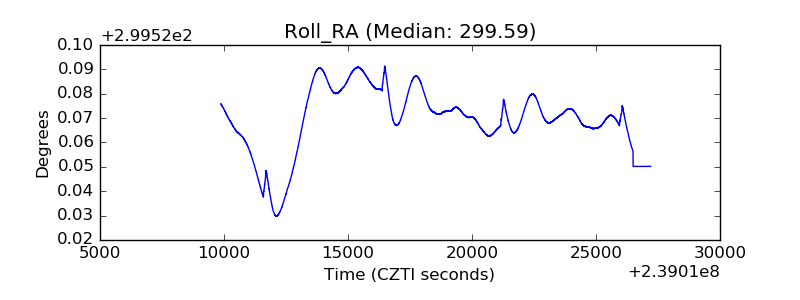 |
| Veto Counter | 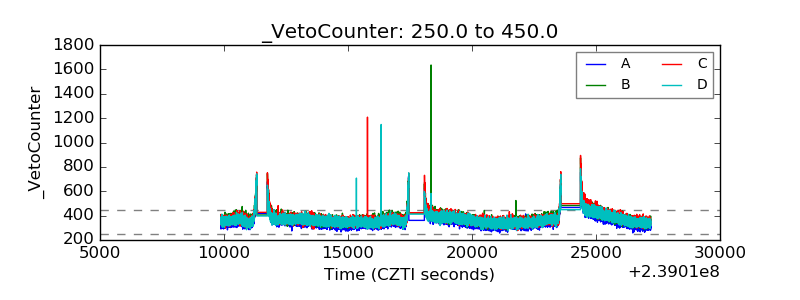 |