| Param | Original file | Final file |
|---|---|---|
| Filename | modeM0/AS1G07_027T01_9000001414_09923cztM0_level2.evt | modeM0/AS1G07_027T01_9000001414_09923cztM0_level2_quad_clean.evt |
| Size (bytes) | 610,718,400 | 88,626,240 |
| Size | 582.4 MB | 84.5 MB |
| Events in quadrant A | 3,734,726 | 566,956 |
| Events in quadrant B | 3,399,440 | 574,804 |
| Events in quadrant C | 3,168,538 | 562,118 |
| Events in quadrant D | 7,728,935 | 502,169 |
| Mode M0 | |||
|---|---|---|---|
| Quadrant | BADHDUFLAG | Total packets | Discarded packets |
| A | 0 | 15695 | 171 |
| B | 0 | 14634 | 144 |
| C | 0 | 14082 | 106 |
| D | 0 | 28380 | 700 |
| Mode SS | |||
|---|---|---|---|
| Quadrant | BADHDUFLAG | Total packets | Discarded packets |
| A | 0 | 142 | 0 |
| B | 0 | 142 | 0 |
| C | 0 | 142 | 0 |
| D | 0 | 142 | 2 |
| Mode M9 | |||
|---|---|---|---|
| Quadrant | BADHDUFLAG | Total packets | Discarded packets |
| A | 0 | 11 | 0 |
| B | 0 | 11 | 0 |
| C | 0 | 11 | 0 |
| D | 0 | 12 | 0 |
| Quadrant | Total seconds | Saturated seconds | Saturation percentage |
|---|---|---|---|
| A | 6857 | 129 | 1.881289% |
| B | 6858 | 111 | 1.618548% |
| C | 6873 | 70 | 1.018478% |
| D | 6798 | 724 | 10.650191% |
Noise dominated data is calculated using 1-second bins in cleaned event files. If a bin has >2000 counts, and if more than 50% of those come from <1% of pixels, then it is considered to be noise-dominated and hence unusable.
| Quadrant | # 1 sec bins | Bins with >0 counts | Bins with >2000 counts | High rate bins dominated by noise | Noise dominated (total time) | Noise dominated (detector-on time) | Marked lightcurve |
|---|---|---|---|---|---|---|---|
| A | 7717 | 6916 | 22 | 22 | 0.29% | 0.32% | 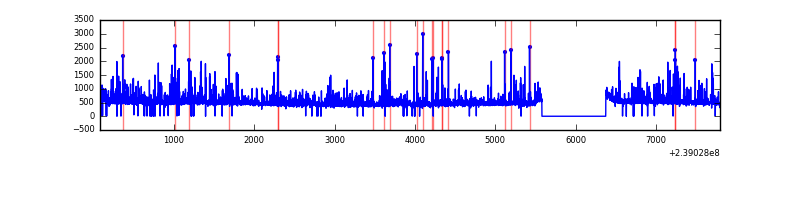 |
| B | 7716 | 6918 | 22 | 22 | 0.29% | 0.32% | 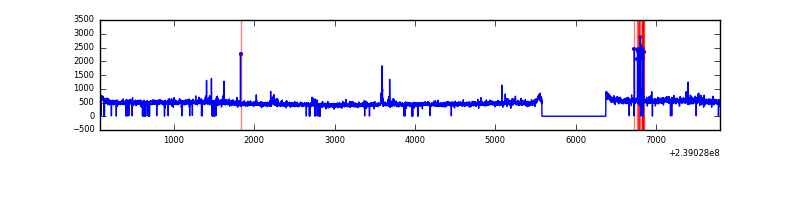 |
| C | 7717 | 6921 | 0 | 0 | 0.00% | 0.00% | 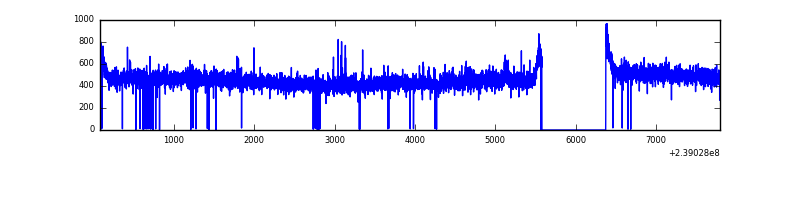 |
| D | 7717 | 6883 | 756 | 756 | 9.80% | 10.98% | 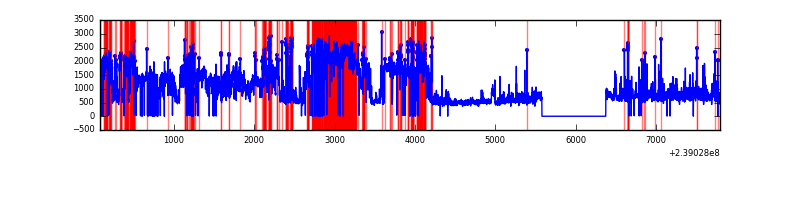 |
Top three noisy pixels from each quadrant. If the there are fewer than three noisy pixels in the level2.evt file, extra rows are filled as -1
| Pixel properties | Quadrant properties | ||||||
|---|---|---|---|---|---|---|---|
| Quadrant | DetID | PixID | Counts | Sigma | Mean | Median | Sigma |
| A | 15 | 239 | 515775 | 3055.67 | 826 | 808 | 168.5 |
| A | 15 | 174 | 28668 | 165.31 | 826 | 808 | 168.5 |
| A | 13 | 251 | 10637 | 58.32 | 826 | 808 | 168.5 |
| B | 0 | 85 | 52126 | 322.66 | 827 | 809 | 159.0 |
| B | 4 | 81 | 33846 | 207.72 | 827 | 809 | 159.0 |
| B | 0 | 214 | 32380 | 198.51 | 827 | 809 | 159.0 |
| C | 14 | 67 | 17482 | 89.11 | 806 | 811 | 187.1 |
| C | 13 | 61 | 6234 | 28.99 | 806 | 811 | 187.1 |
| C | 14 | 234 | 4868 | 21.68 | 806 | 811 | 187.1 |
| D | 1 | 52 | 3534772 | 18407.16 | 771 | 750 | 192.0 |
| D | 8 | 195 | 614267 | 3195.54 | 771 | 750 | 192.0 |
| D | 2 | 16 | 464558 | 2415.77 | 771 | 750 | 192.0 |
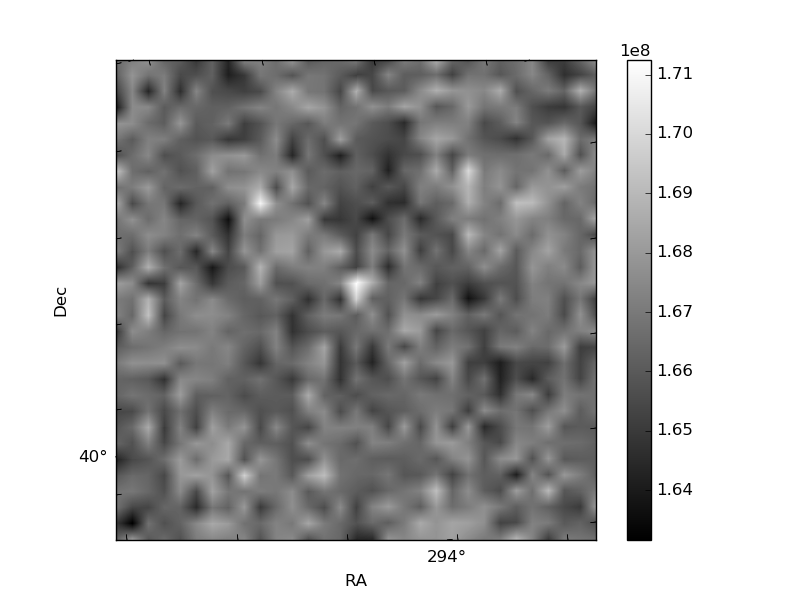
Histogram calculated using DETX and DETY for each event in the final _common_clean file
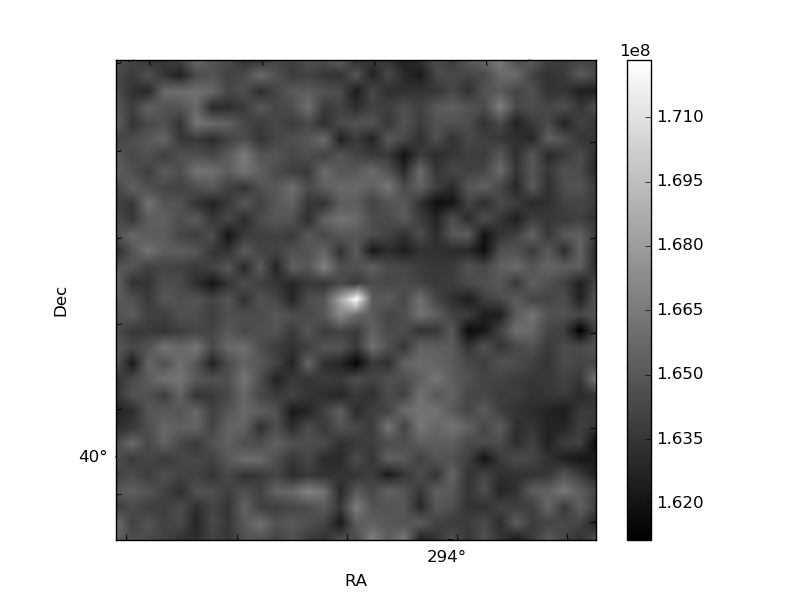
| Quadrant A | 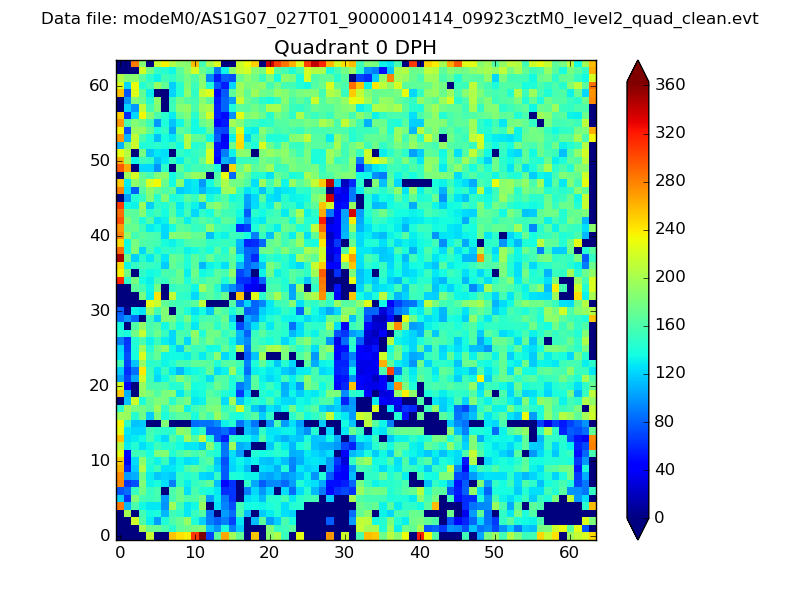 |
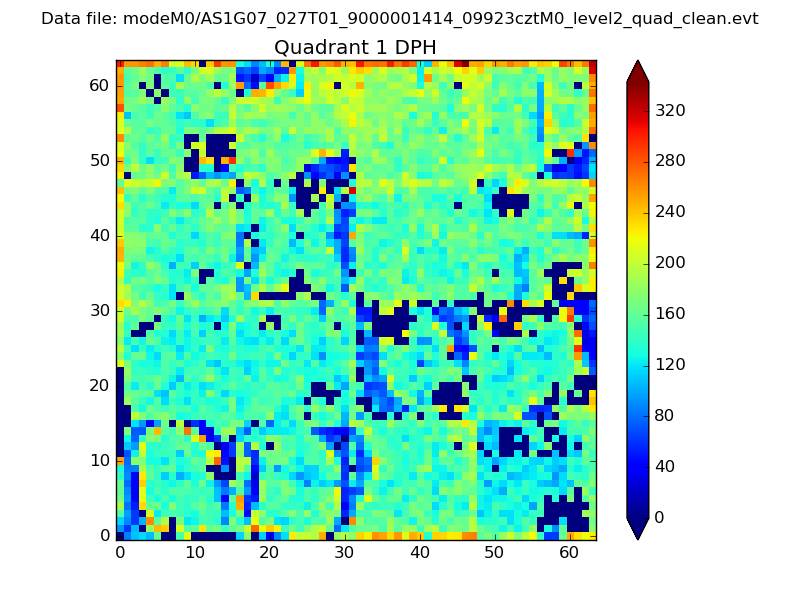 |
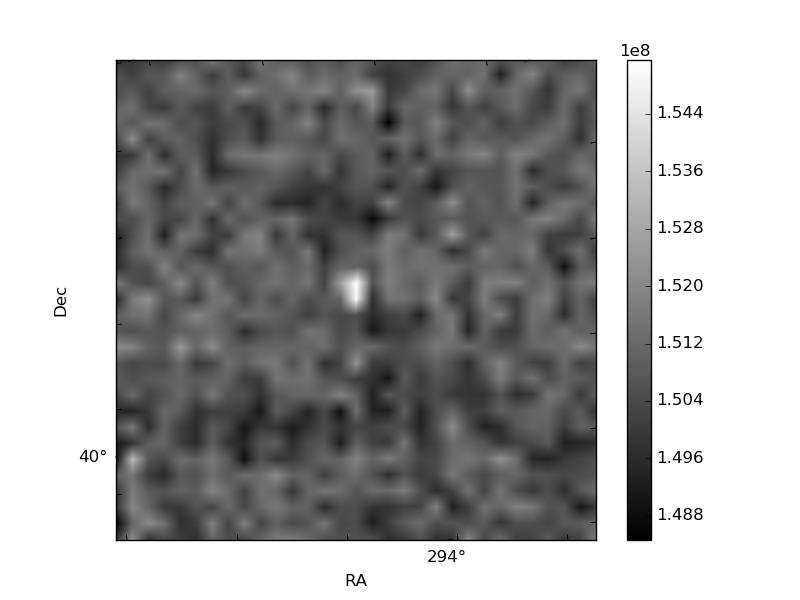
Quadrant B |
|---|---|---|---|
| Quadrant D | 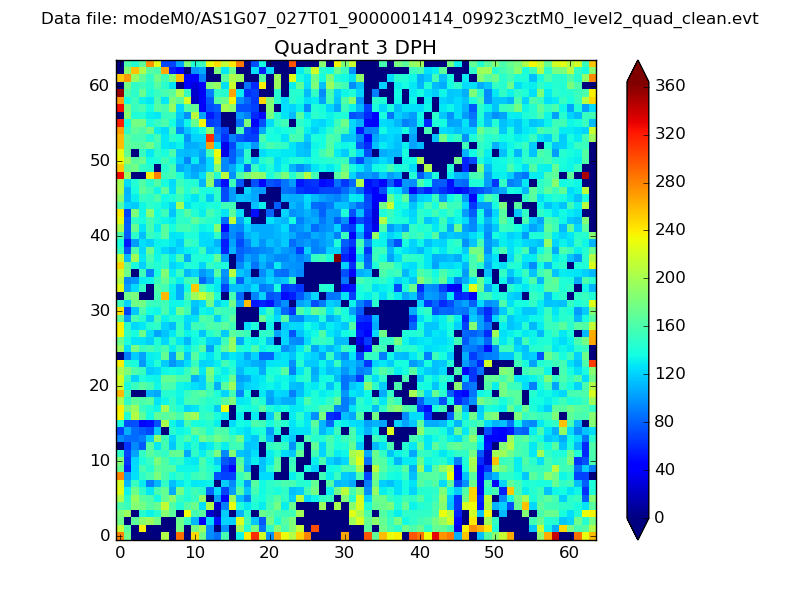 |
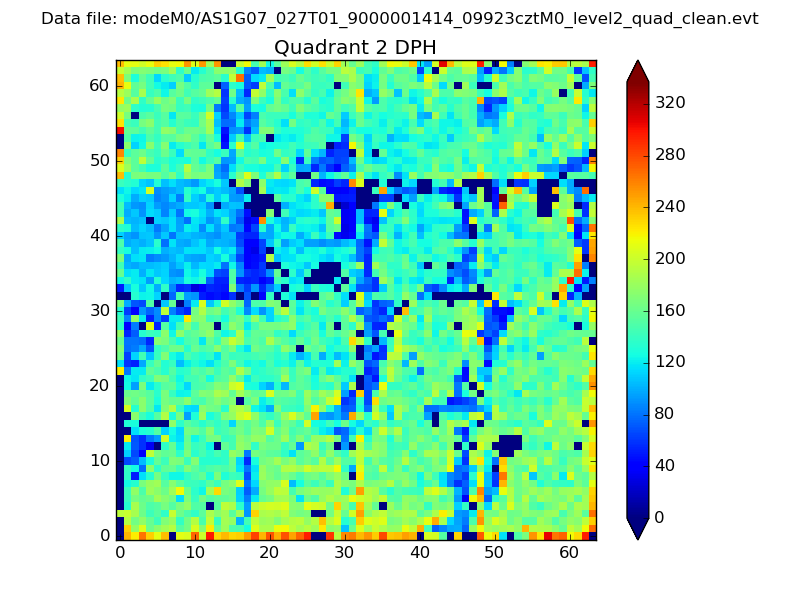 |
Quadrant C |
| Plot type | Count rate plots | Images |
|---|---|---|
| Comparison with Poisson distribution Blue bars denote a histogram of data divided into 1 sec bins. Red curve is a Poisson curve with rate = median count rate of data. |
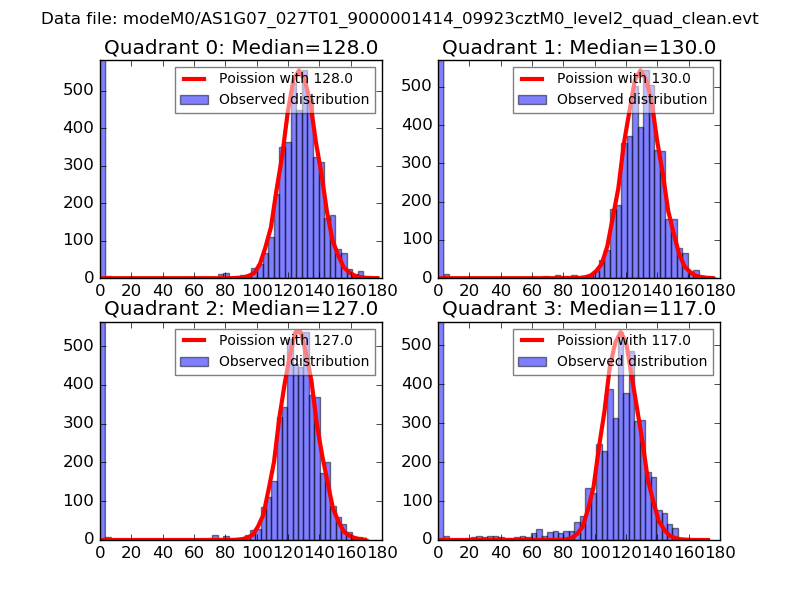 |
 |
| Quadrant-wise count rates Data is divided into 100 sec bins |
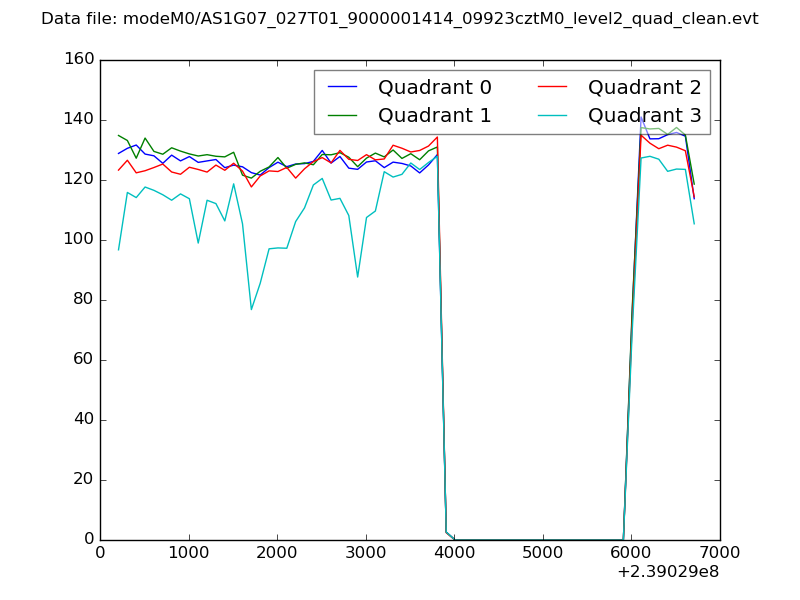 |
|
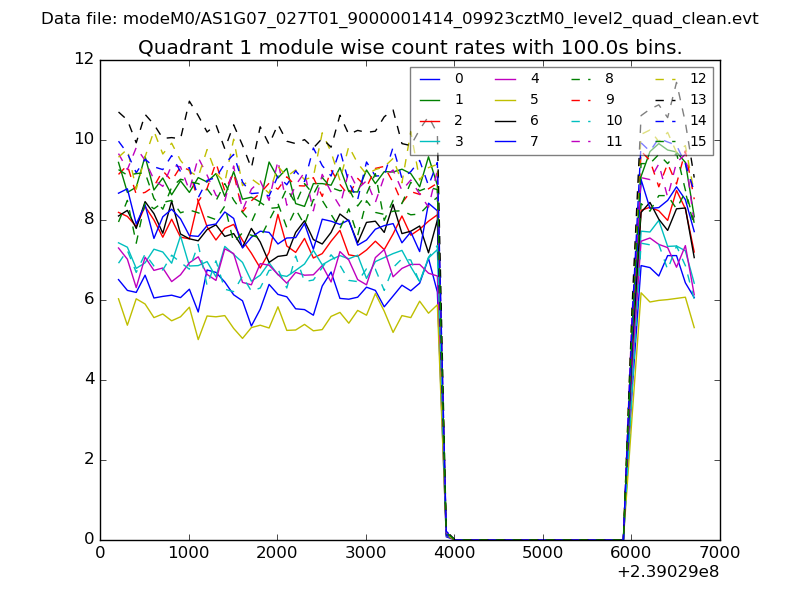
| Module-wise count rates for Quadrant A Data is divided into 100 sec bins |
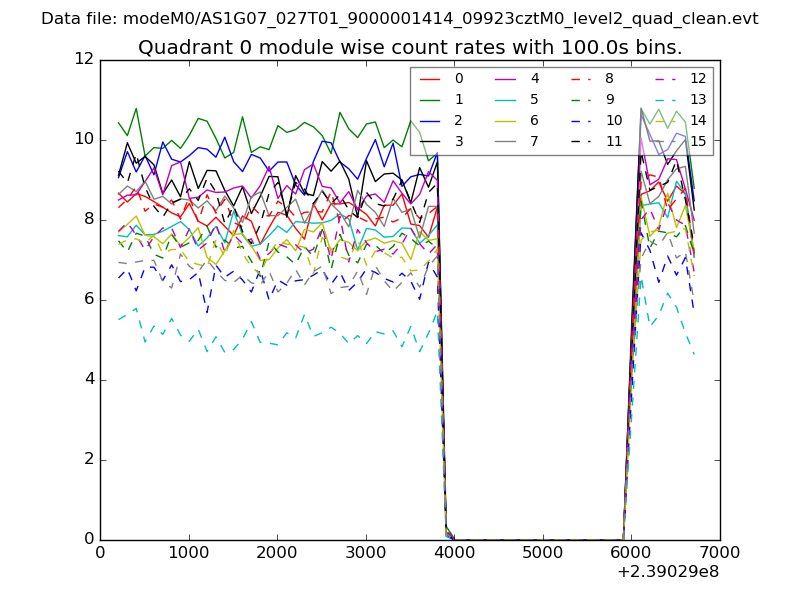 |
 |
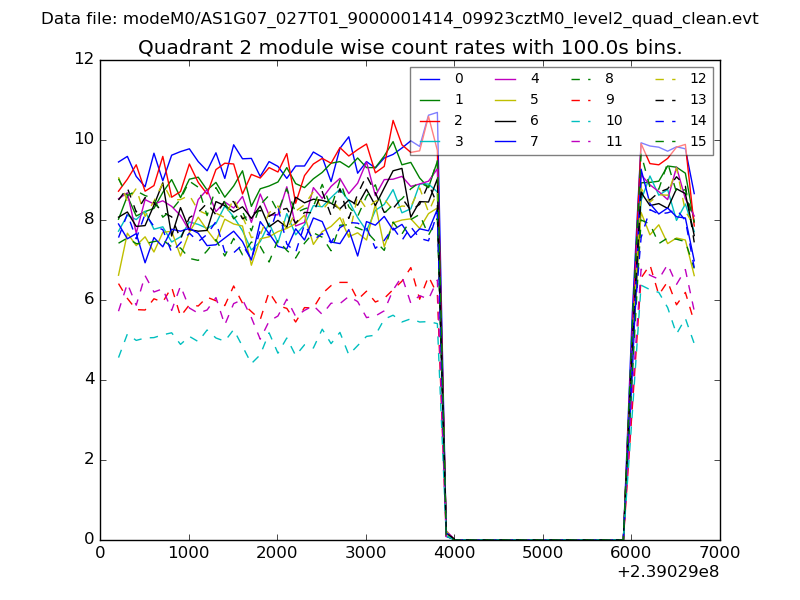
| Module-wise count rates for Quadrant B Data is divided into 100 sec bins |
 |
 |
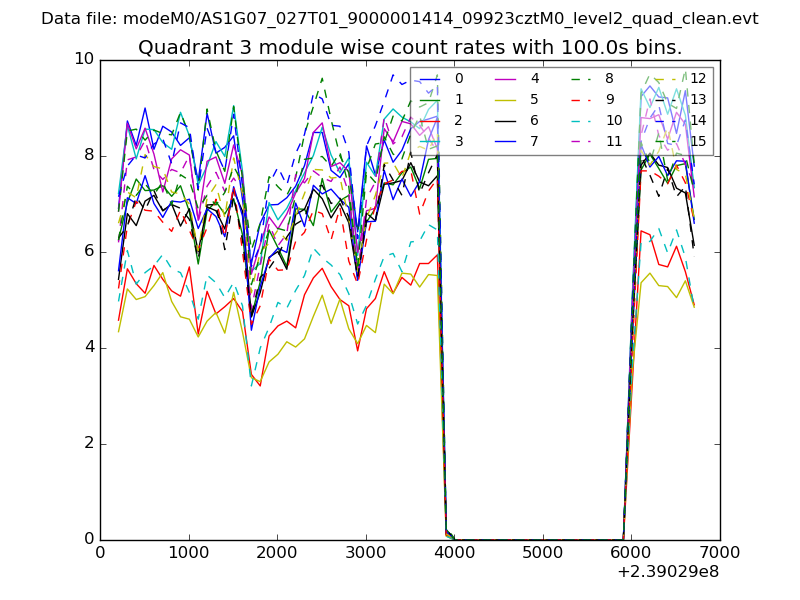
| Module-wise count rates for Quadrant C Data is divided into 100 sec bins |
 |
 |
| Module-wise count rates for Quadrant D Data is divided into 100 sec bins |
 |
 |
| Parameter | Plot |
|---|---|
| CZT HV Monitor | 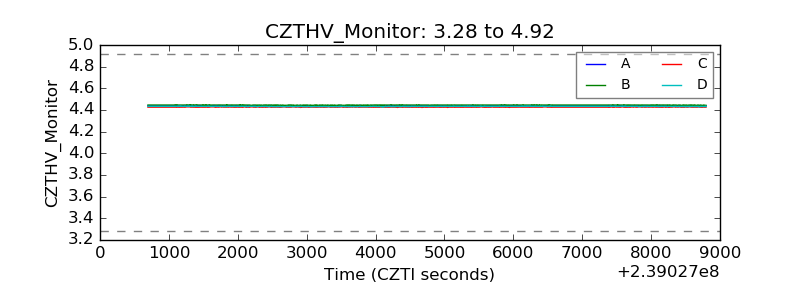 |
| D_VDD |  |
| Temperature 1 | 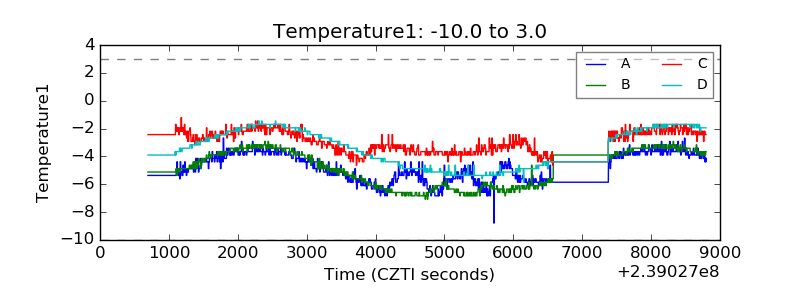 |
| Veto HV Monitor |  |
| Veto LLD | 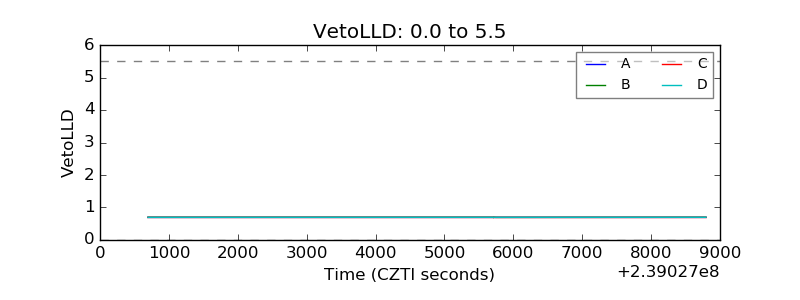 |
| Alpha Counter | 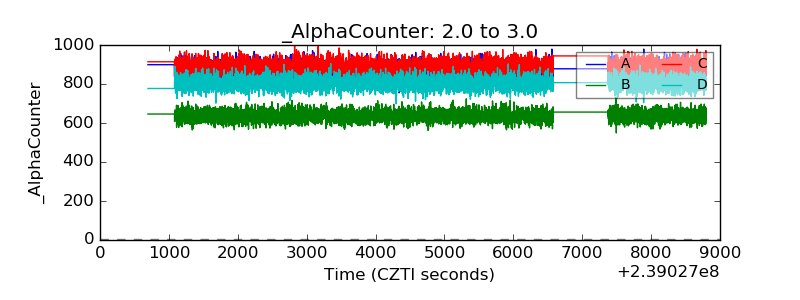 |
| _CPM_Rate | 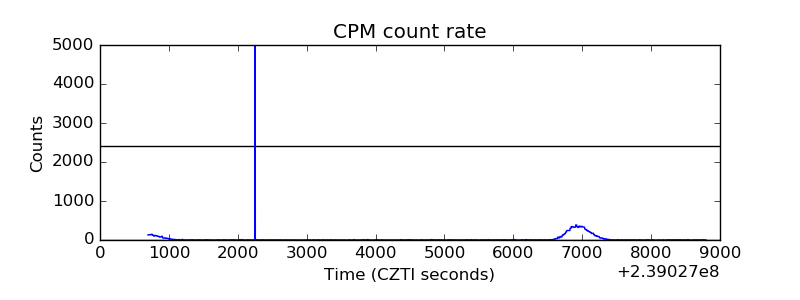 |
| CZT Counter | 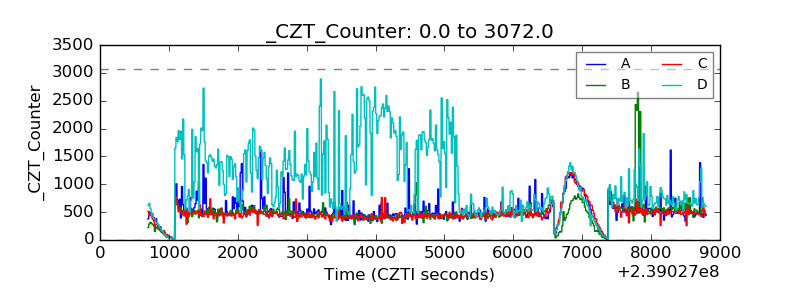 |
| +2.5 Volts monitor |  |
| +5 Volts monitor |  |
| _ROLL_ROT | 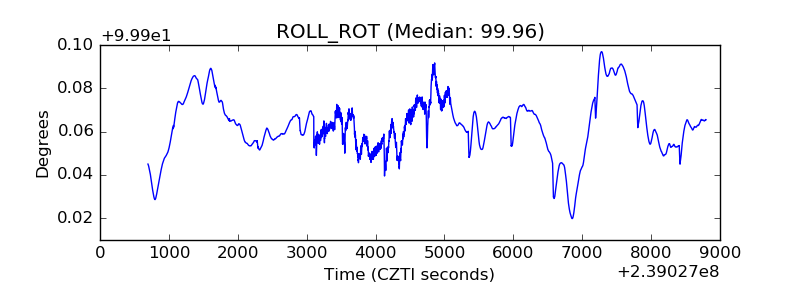 |
| _Roll_DEC | 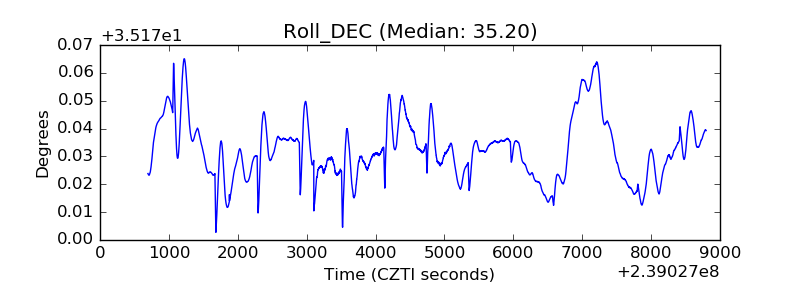 |
| _Roll_RA |  |
| Veto Counter | 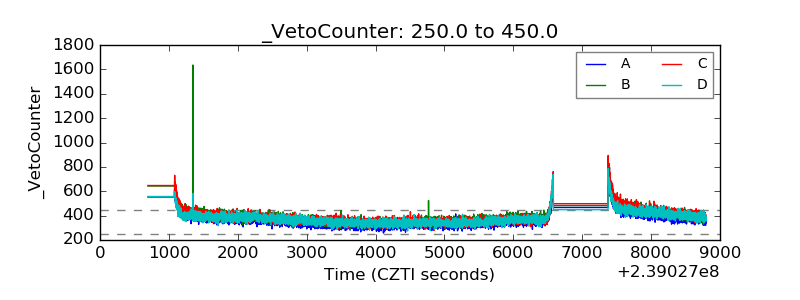 |