| Param | Original file | Final file |
|---|---|---|
| Filename | modeM0/AS1A03_107T01_9000001418cztM0_level2.fits | modeM0/AS1A03_107T01_9000001418cztM0_level2_quad_clean.evt |
| Size (bytes) | 26,835,840 | 36,509,760 |
| Size | 25.6 MB | 34.8 MB |
| Events in quadrant A | 160,896 | 233,346 |
| Events in quadrant B | 152,306 | 230,608 |
| Events in quadrant C | 158,304 | 230,968 |
| Events in quadrant D | 134,994 | 203,554 |
| Mode M0 | |||
|---|---|---|---|
| Quadrant | BADHDUFLAG | Total packets | Discarded packets |
| A | 0 | 6634 | 0 |
| B | 0 | 8909 | 0 |
| C | 0 | 5841 | 0 |
| D | 0 | 9357 | 0 |
| Mode SS | |||
|---|---|---|---|
| Quadrant | BADHDUFLAG | Total packets | Discarded packets |
| A | 0 | 58 | 0 |
| B | 0 | 58 | 0 |
| C | 0 | 58 | 0 |
| D | 0 | 58 | 0 |
| Mode M9 | |||
|---|---|---|---|
| Quadrant | BADHDUFLAG | Total packets | Discarded packets |
| A | 0 | 30 | 0 |
| B | 0 | 30 | 0 |
| C | 0 | 30 | 0 |
| D | 0 | 30 | 0 |
| Quadrant | Total seconds | Saturated seconds | Saturation percentage |
|---|---|---|---|
| A | 2891 | 47 | 1.625735% |
| B | 2891 | 115 | 3.977862% |
| C | 2891 | 2 | 0.069180% |
| D | 2891 | 119 | 4.116223% |
Noise dominated data is calculated using 1-second bins in cleaned event files. If a bin has >2000 counts, and if more than 50% of those come from <1% of pixels, then it is considered to be noise-dominated and hence unusable.
| Quadrant | # 1 sec bins | Bins with >0 counts | Bins with >2000 counts | High rate bins dominated by noise | Noise dominated (total time) | Noise dominated (detector-on time) | Marked lightcurve |
|---|---|---|---|---|---|---|---|
| A | 2891 | 2890 | 0 | 0 | 0.00% | 0.00% |  |
| B | 2891 | 2891 | 0 | 0 | 0.00% | 0.00% |  |
| C | 2891 | 2891 | 0 | 0 | 0.00% | 0.00% | 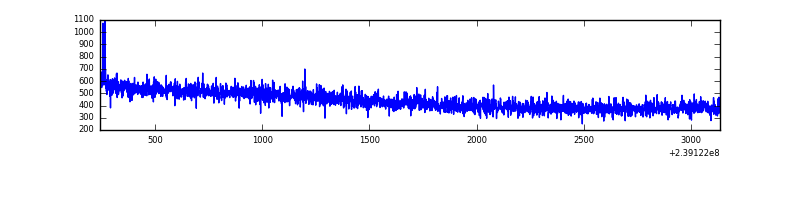 |
| D | 2891 | 2891 | 0 | 0 | 0.00% | 0.00% |  |
Top three noisy pixels from each quadrant. If the there are fewer than three noisy pixels in the level2.evt file, extra rows are filled as -1
| Pixel properties | Quadrant properties | ||||||
|---|---|---|---|---|---|---|---|
| Quadrant | DetID | PixID | Counts | Sigma | Mean | Median | Sigma |
| A | 0 | 29 | 157 | 9.5 | 41 | 39 | 12.4 |
| A | 7 | 110 | 146 | 8.61 | 41 | 39 | 12.4 |
| A | 9 | 19 | 139 | 8.05 | 41 | 39 | 12.4 |
| B | 3 | 80 | 118 | 7.79 | 40 | 38 | 10.3 |
| B | 3 | 17 | 112 | 7.21 | 40 | 38 | 10.3 |
| B | 14 | 254 | 111 | 7.11 | 40 | 38 | 10.3 |
| C | 12 | 224 | 112 | 5.75 | 41 | 38 | 12.9 |
| C | 4 | 254 | 112 | 5.75 | 41 | 38 | 12.9 |
| C | 3 | 158 | 112 | 5.75 | 41 | 38 | 12.9 |
| D | 4 | 246 | 115 | 6.72 | 38 | 35 | 11.9 |
| D | 6 | 231 | 108 | 6.13 | 38 | 35 | 11.9 |
| D | 4 | 160 | 106 | 5.96 | 38 | 35 | 11.9 |
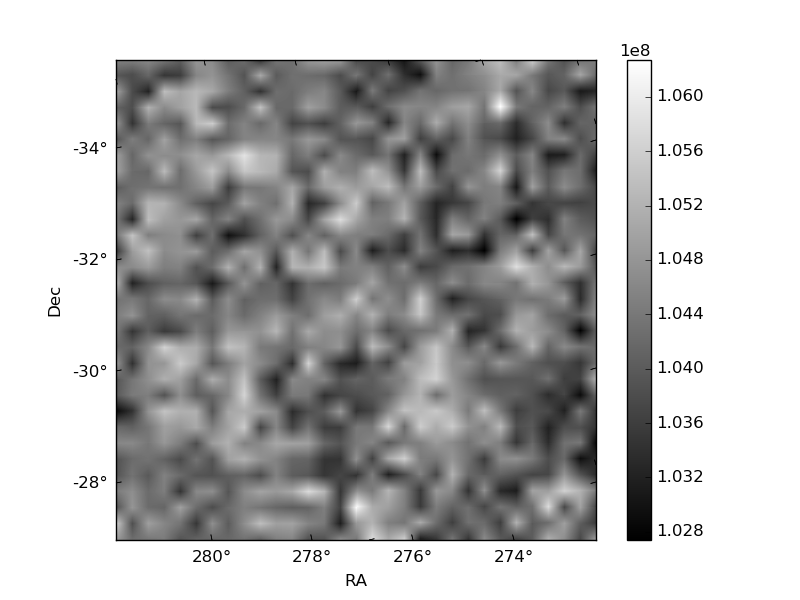
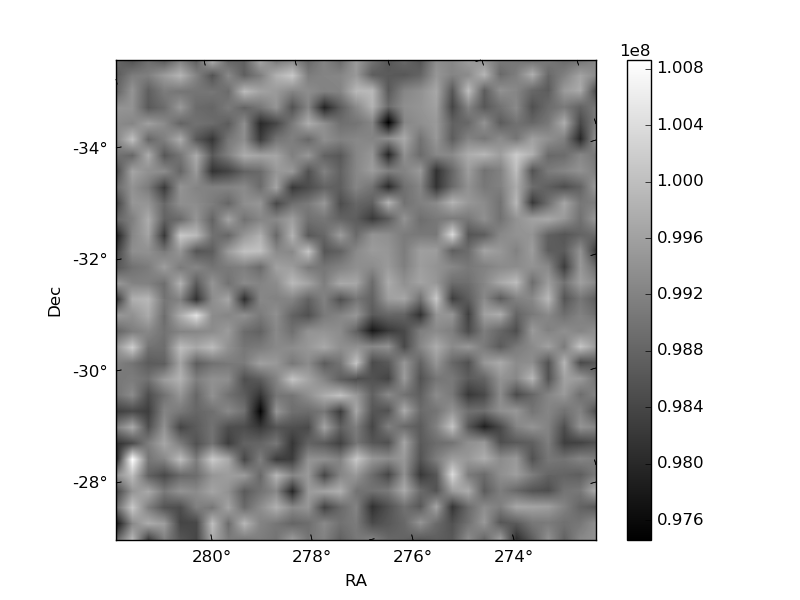
Histogram calculated using DETX and DETY for each event in the final _common_clean file
| Quadrant A | 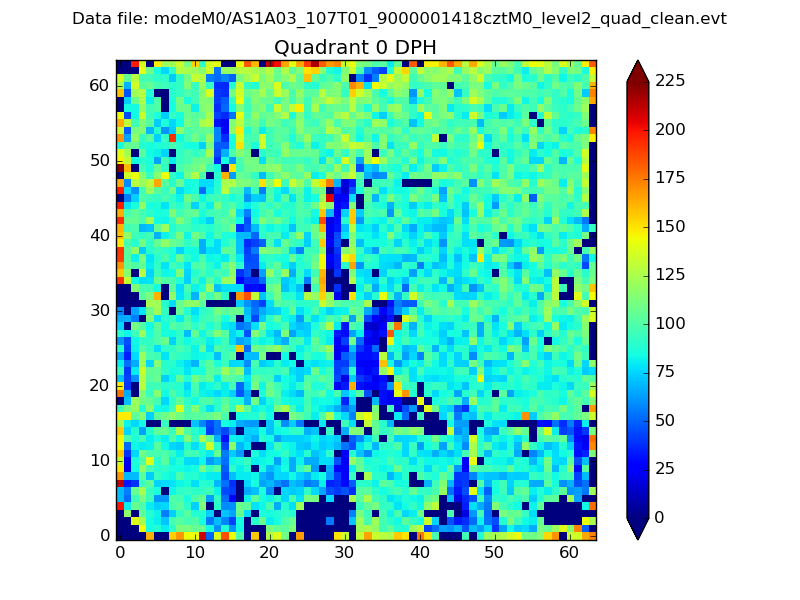 |
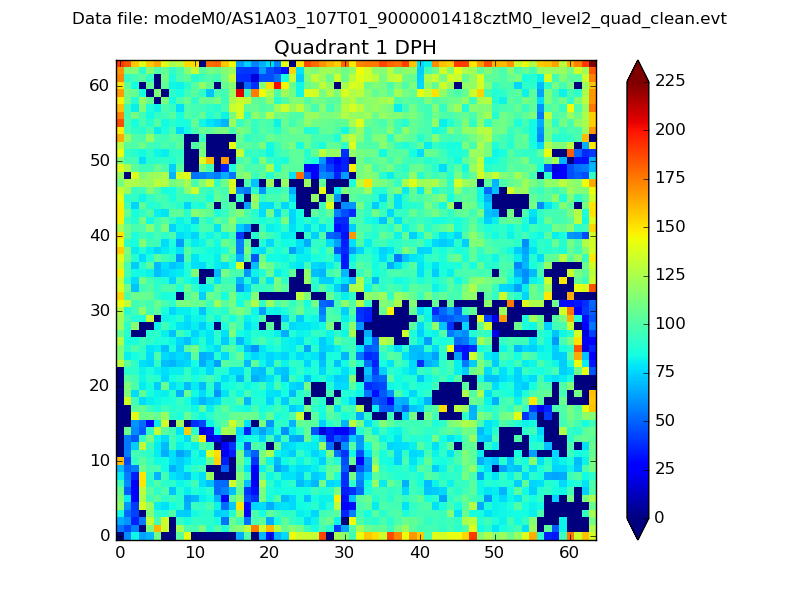 |
Quadrant B |
|---|---|---|---|
| Quadrant D | 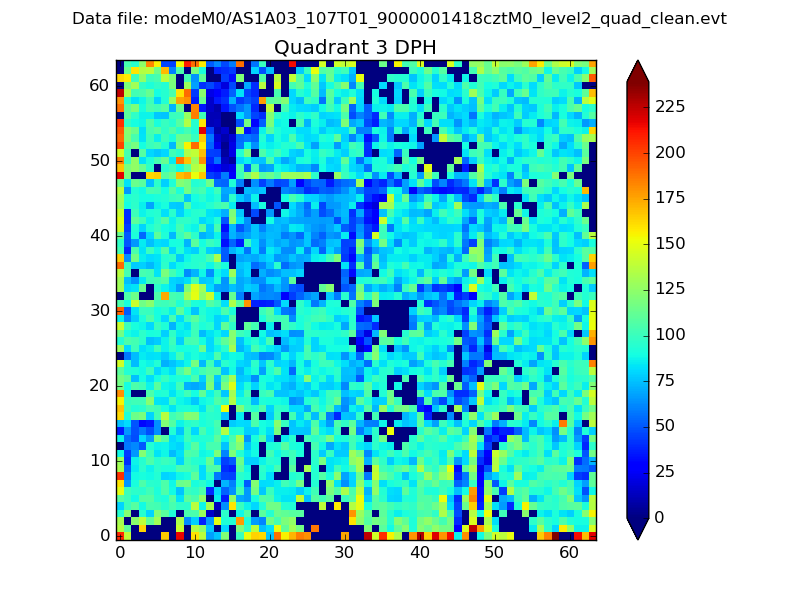 |
 |
Quadrant C |
| Plot type | Count rate plots | Images |
|---|---|---|
| Comparison with Poisson distribution Blue bars denote a histogram of data divided into 1 sec bins. Red curve is a Poisson curve with rate = median count rate of data. |
 |
 |
| Quadrant-wise count rates Data is divided into 100 sec bins |
 |
|
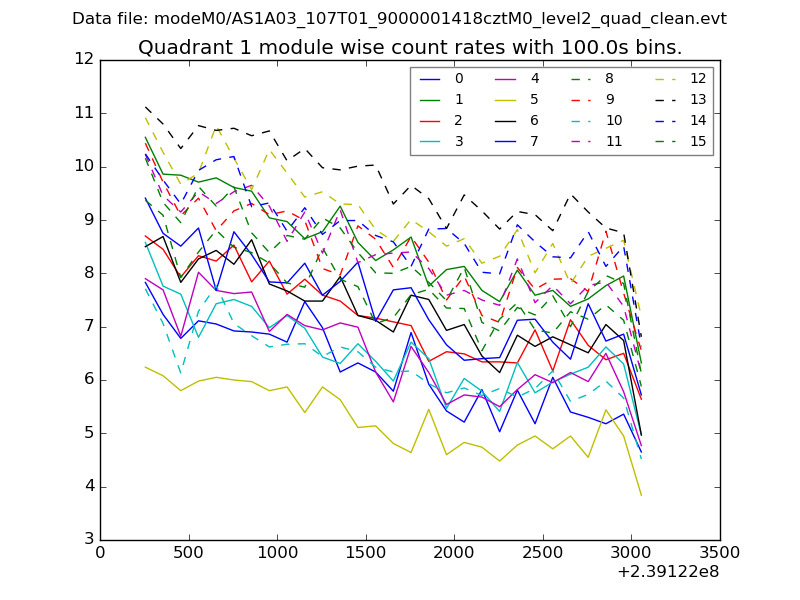
| Module-wise count rates for Quadrant A Data is divided into 100 sec bins |
 |
 |
| Module-wise count rates for Quadrant B Data is divided into 100 sec bins |
 |
 |
| Module-wise count rates for Quadrant C Data is divided into 100 sec bins |
 |
 |
| Module-wise count rates for Quadrant D Data is divided into 100 sec bins |
 |
 |
| Parameter | Plot |
|---|---|
| CZT HV Monitor |  |
| D_VDD | 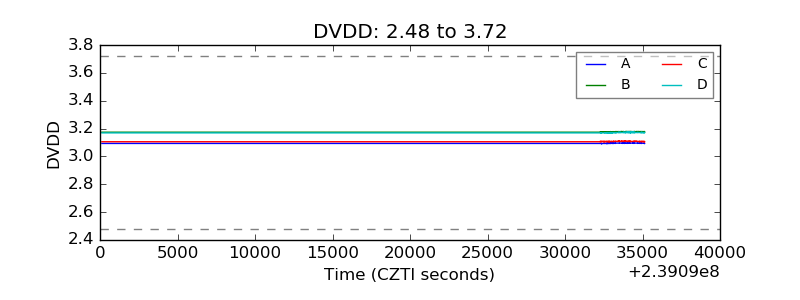 |
| Temperature 1 |  |
| Veto HV Monitor |  |
| Veto LLD |  |
| Alpha Counter | 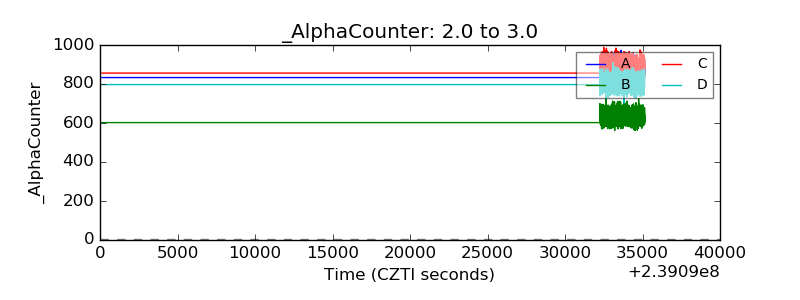 |
| _CPM_Rate |  |
| CZT Counter |  |
| +2.5 Volts monitor |  |
| +5 Volts monitor |  |
| _ROLL_ROT |  |
| _Roll_DEC |  |
| _Roll_RA |  |
| Veto Counter |  |