| Param | Original file | Final file |
|---|---|---|
| Filename | modeM0/AS1A03_107T01_9000001418_09935cztM0_level2.evt | modeM0/AS1A03_107T01_9000001418_09935cztM0_level2_quad_clean.evt |
| Size (bytes) | 634,556,160 | 87,641,280 |
| Size | 605.2 MB | 83.6 MB |
| Events in quadrant A | 5,403,367 | 510,349 |
| Events in quadrant B | 4,152,595 | 533,502 |
| Events in quadrant C | 3,829,296 | 535,560 |
| Events in quadrant D | 5,271,052 | 499,369 |
| Mode M0 | |||
|---|---|---|---|
| Quadrant | BADHDUFLAG | Total packets | Discarded packets |
| A | 0 | 21863 | 165 |
| B | 0 | 17803 | 69 |
| C | 0 | 17289 | 35 |
| D | 0 | 21144 | 93 |
| Mode SS | |||
|---|---|---|---|
| Quadrant | BADHDUFLAG | Total packets | Discarded packets |
| A | 0 | 170 | 0 |
| B | 0 | 170 | 4 |
| C | 0 | 170 | 0 |
| D | 0 | 170 | 0 |
| Mode M9 | |||
|---|---|---|---|
| Quadrant | BADHDUFLAG | Total packets | Discarded packets |
| A | 0 | 5 | 0 |
| B | 0 | 5 | 0 |
| C | 0 | 5 | 0 |
| D | 0 | 5 | 0 |
| Quadrant | Total seconds | Saturated seconds | Saturation percentage |
|---|---|---|---|
| A | 8262 | 497 | 6.015493% |
| B | 8279 | 275 | 3.321657% |
| C | 8293 | 182 | 2.194622% |
| D | 8274 | 432 | 5.221175% |
Noise dominated data is calculated using 1-second bins in cleaned event files. If a bin has >2000 counts, and if more than 50% of those come from <1% of pixels, then it is considered to be noise-dominated and hence unusable.
| Quadrant | # 1 sec bins | Bins with >0 counts | Bins with >2000 counts | High rate bins dominated by noise | Noise dominated (total time) | Noise dominated (detector-on time) | Marked lightcurve |
|---|---|---|---|---|---|---|---|
| A | 8819 | 8305 | 212 | 212 | 2.40% | 2.55% | 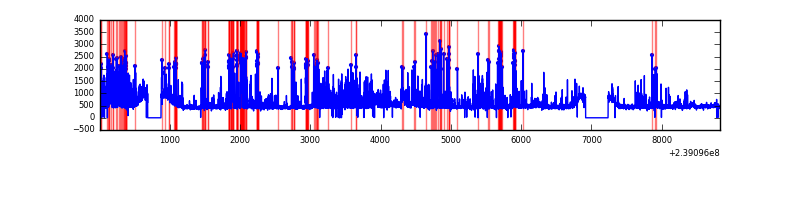 |
| B | 8820 | 8309 | 14 | 14 | 0.16% | 0.17% | 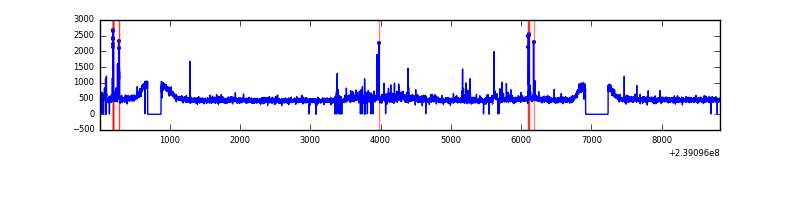 |
| C | 8820 | 8311 | 0 | 0 | 0.00% | 0.00% | 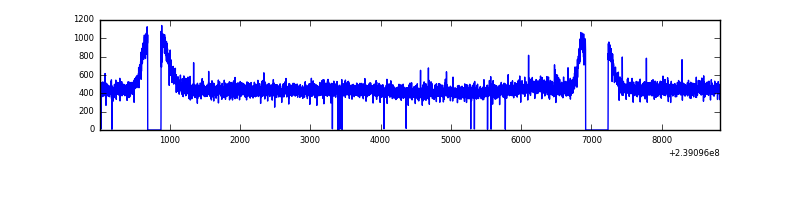 |
| D | 8820 | 8309 | 212 | 212 | 2.40% | 2.55% | 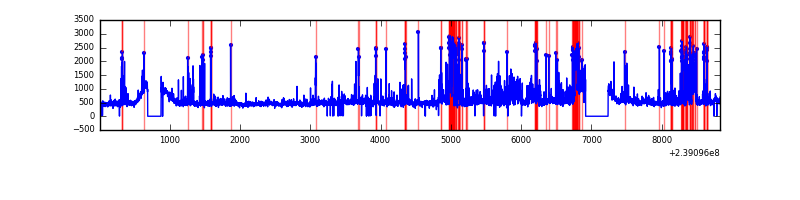 |
Top three noisy pixels from each quadrant. If the there are fewer than three noisy pixels in the level2.evt file, extra rows are filled as -1
| Pixel properties | Quadrant properties | ||||||
|---|---|---|---|---|---|---|---|
| Quadrant | DetID | PixID | Counts | Sigma | Mean | Median | Sigma |
| A | 15 | 239 | 1586029 | 7867.41 | 976 | 953 | 201.5 |
| A | 14 | 111 | 43278 | 210.07 | 976 | 953 | 201.5 |
| A | 15 | 174 | 13239 | 60.98 | 976 | 953 | 201.5 |
| B | 0 | 214 | 76504 | 389.44 | 999 | 973 | 193.9 |
| B | 0 | 219 | 42459 | 213.9 | 999 | 973 | 193.9 |
| B | 0 | 230 | 41682 | 209.9 | 999 | 973 | 193.9 |
| C | 8 | 128 | 12170 | 48.34 | 975 | 979 | 231.5 |
| C | 13 | 61 | 7346 | 27.5 | 975 | 979 | 231.5 |
| C | 8 | 112 | 6791 | 25.1 | 975 | 979 | 231.5 |
| D | 1 | 52 | 942314 | 3985.15 | 945 | 919 | 236.2 |
| D | 8 | 195 | 288909 | 1219.13 | 945 | 919 | 236.2 |
| D | 12 | 233 | 154874 | 651.73 | 945 | 919 | 236.2 |
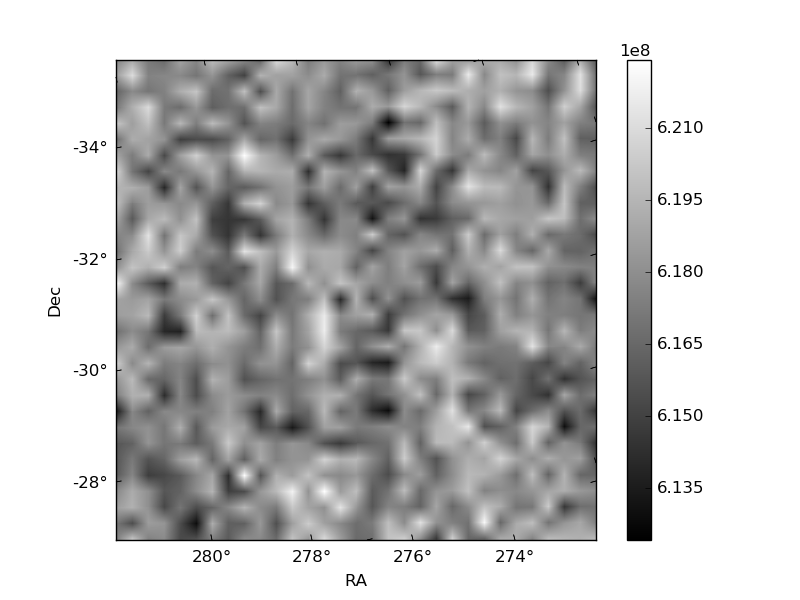
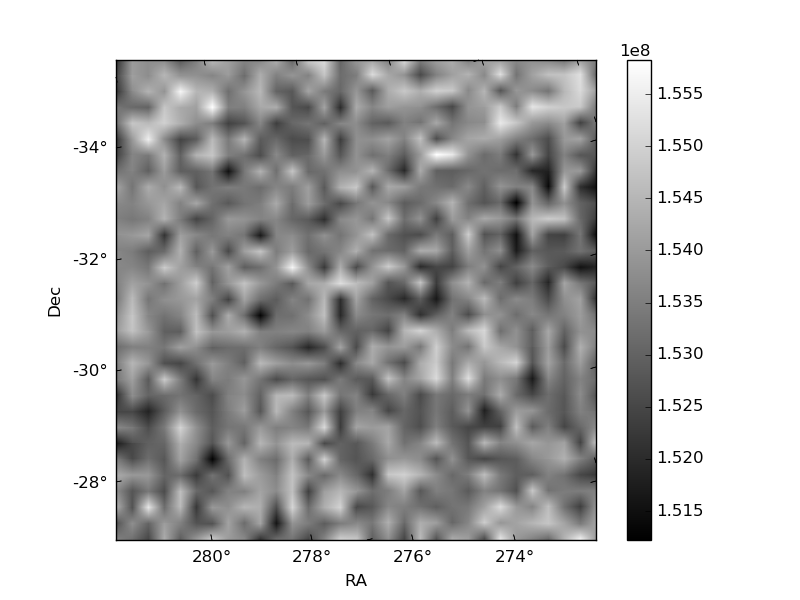
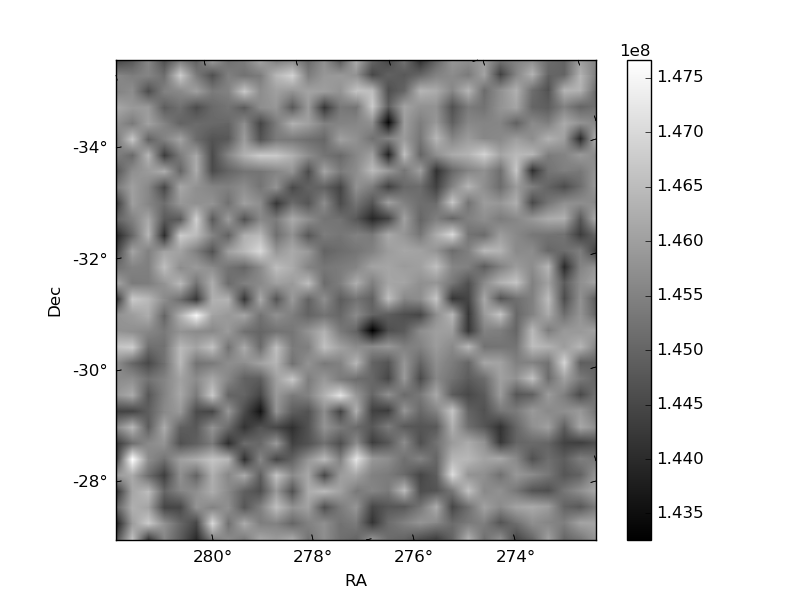
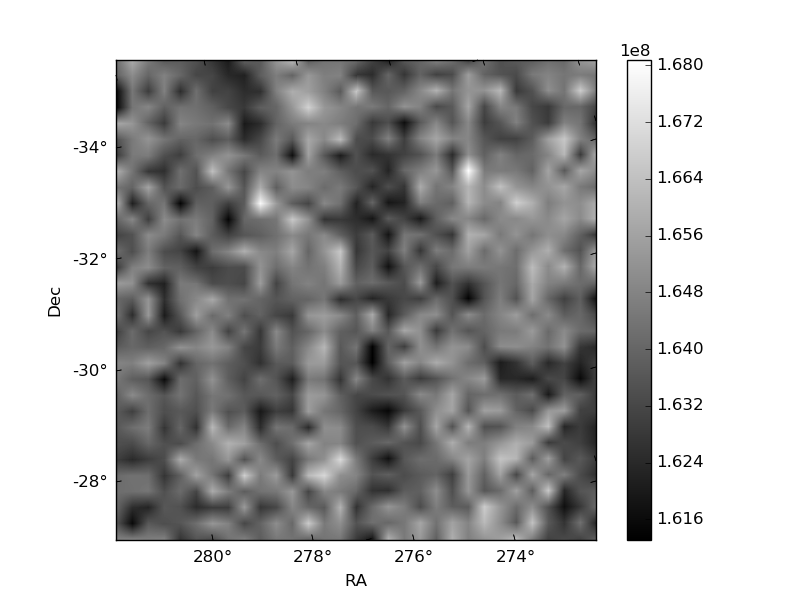
Histogram calculated using DETX and DETY for each event in the final _common_clean file
| Quadrant A | 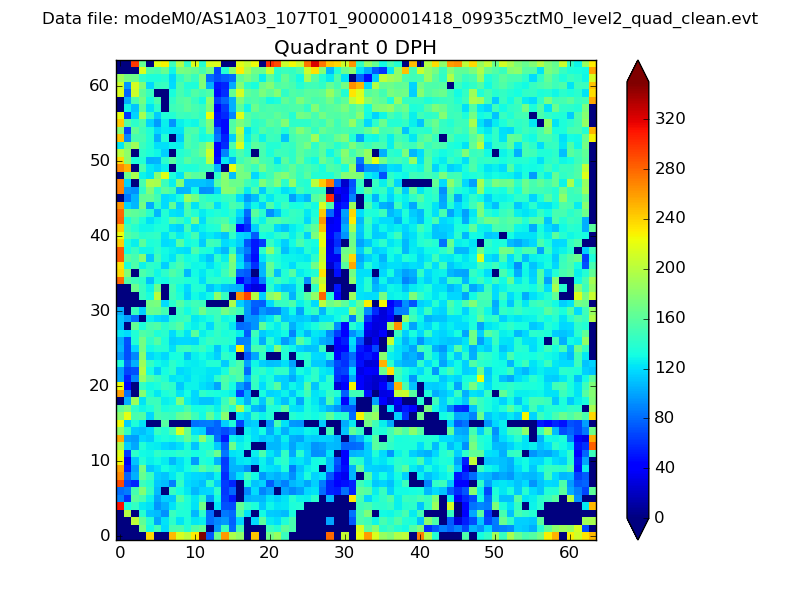 |
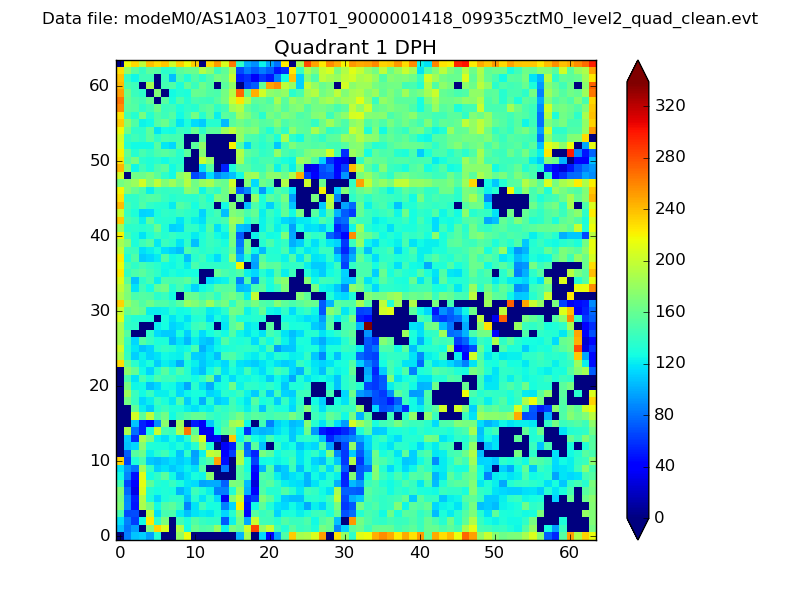 |
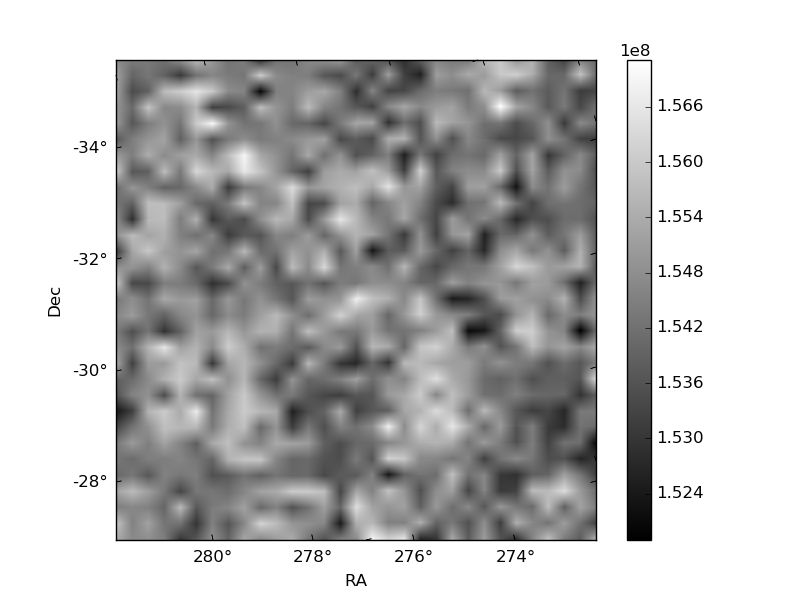
Quadrant B |
|---|---|---|---|
| Quadrant D | 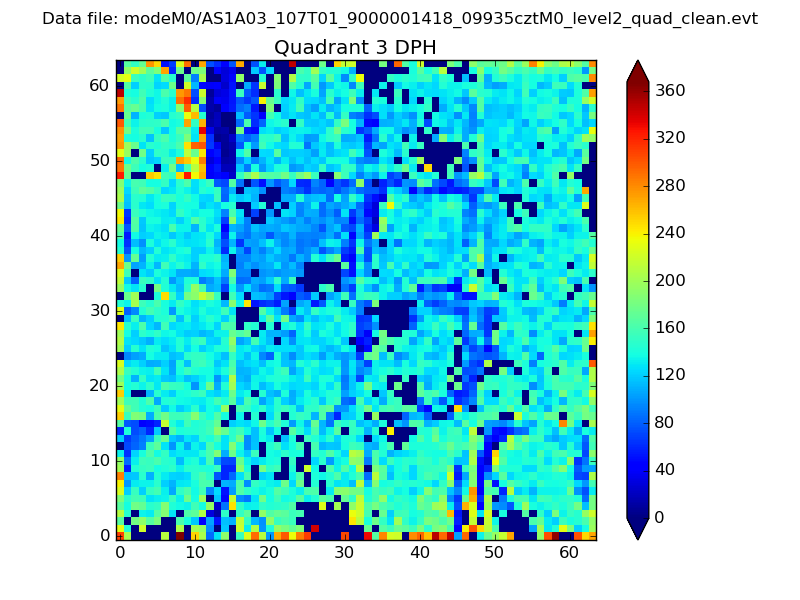 |
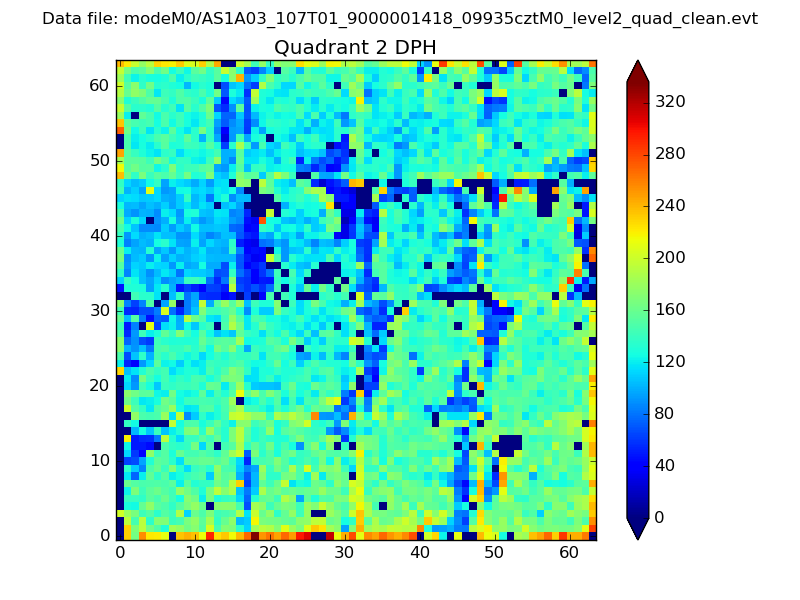 |
Quadrant C |
| Plot type | Count rate plots | Images |
|---|---|---|
| Comparison with Poisson distribution Blue bars denote a histogram of data divided into 1 sec bins. Red curve is a Poisson curve with rate = median count rate of data. |
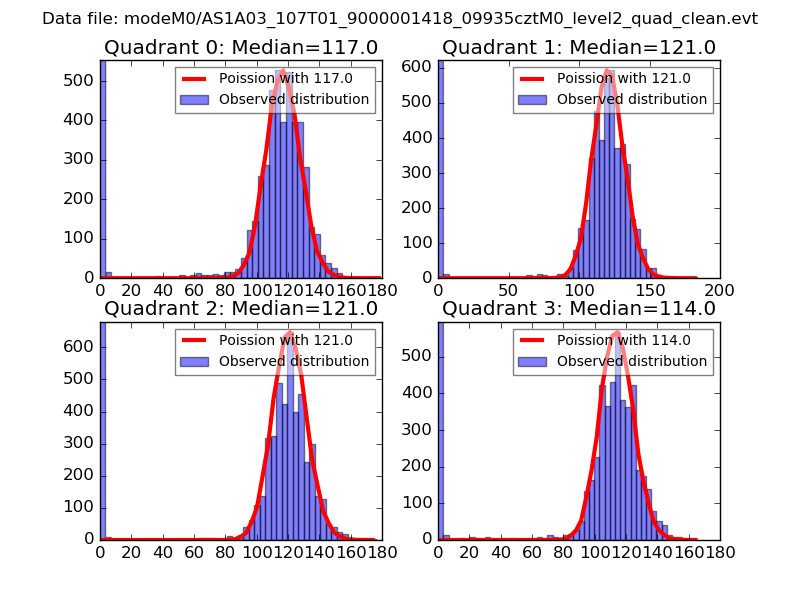 |
 |
| Quadrant-wise count rates Data is divided into 100 sec bins |
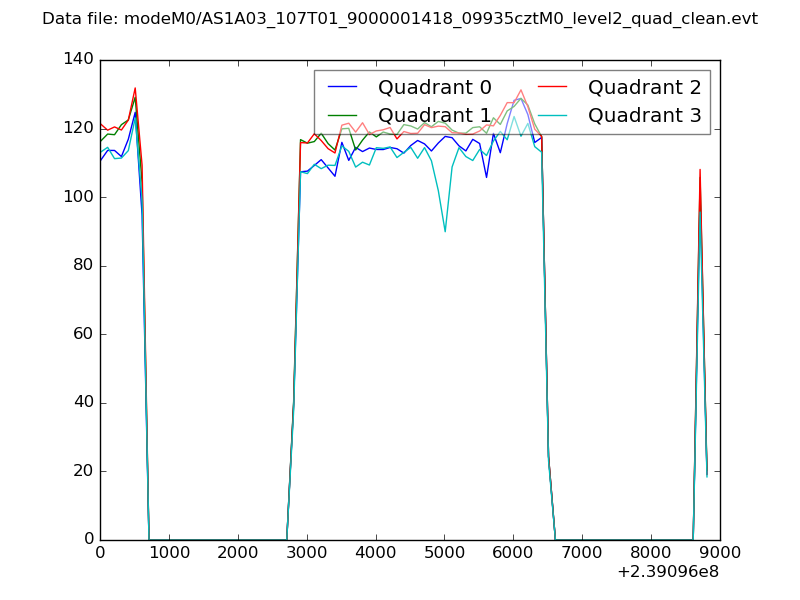 |
|
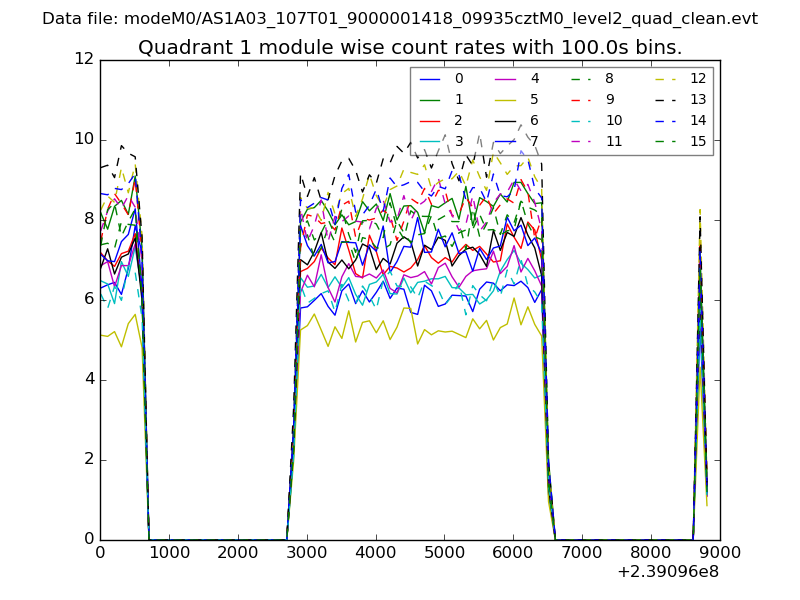
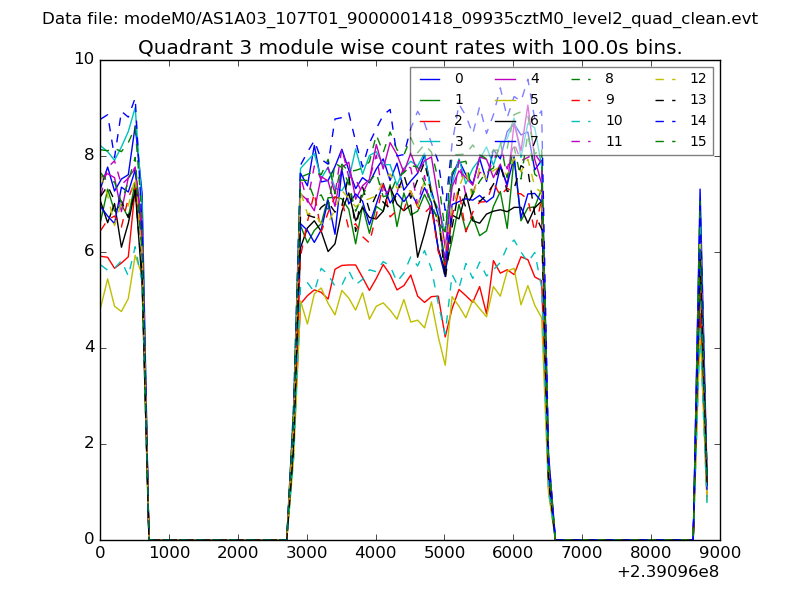
| Module-wise count rates for Quadrant A Data is divided into 100 sec bins |
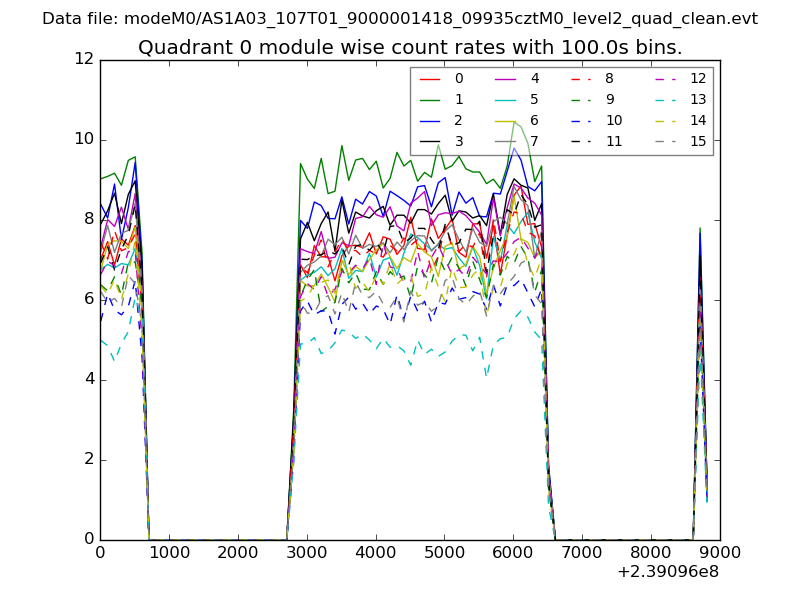 |
 |
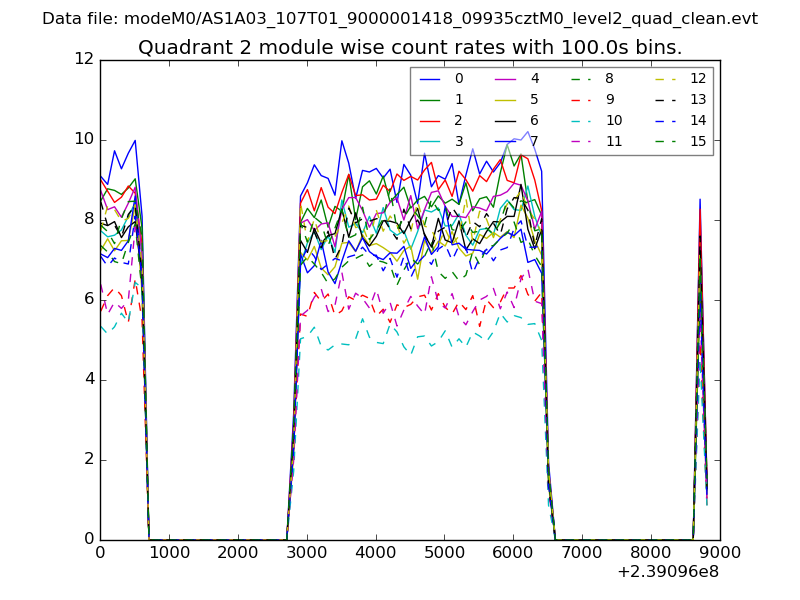
| Module-wise count rates for Quadrant B Data is divided into 100 sec bins |
 |
 |
| Module-wise count rates for Quadrant C Data is divided into 100 sec bins |
 |
 |
| Module-wise count rates for Quadrant D Data is divided into 100 sec bins |
 |
 |
| Parameter | Plot |
|---|---|
| CZT HV Monitor | 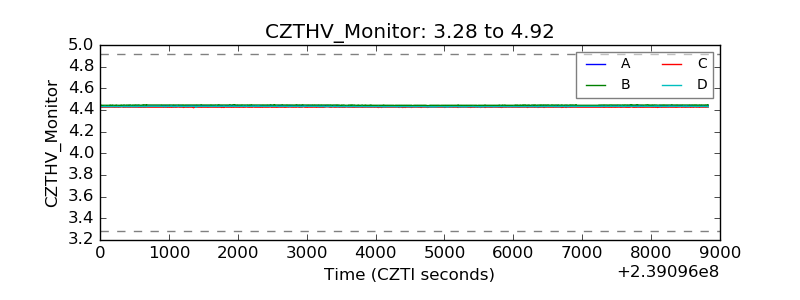 |
| D_VDD | 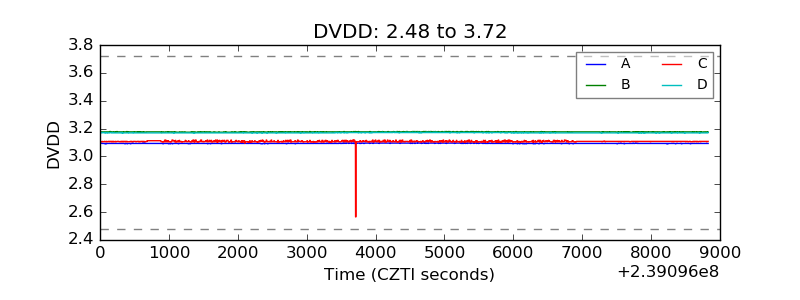 |
| Temperature 1 | 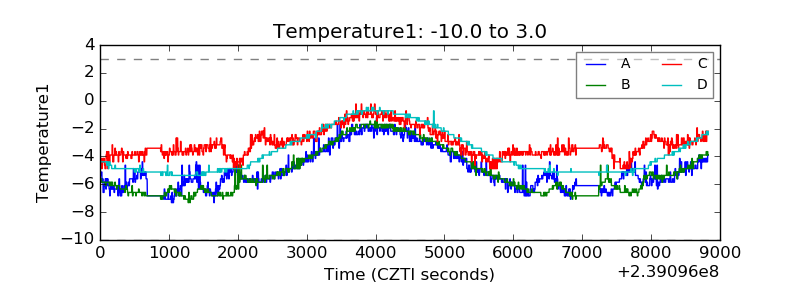 |
| Veto HV Monitor | 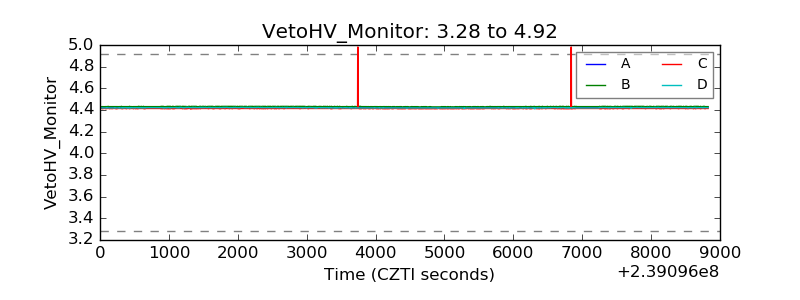 |
| Veto LLD | 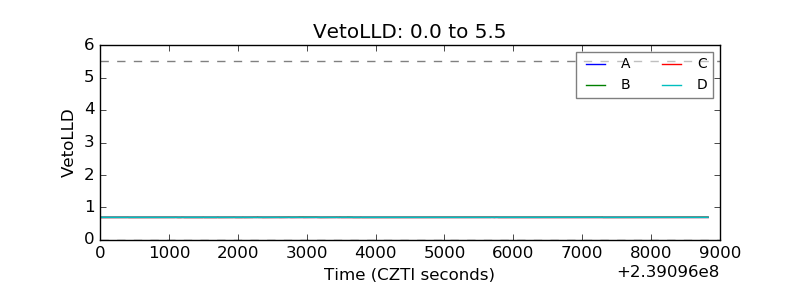 |
| Alpha Counter | 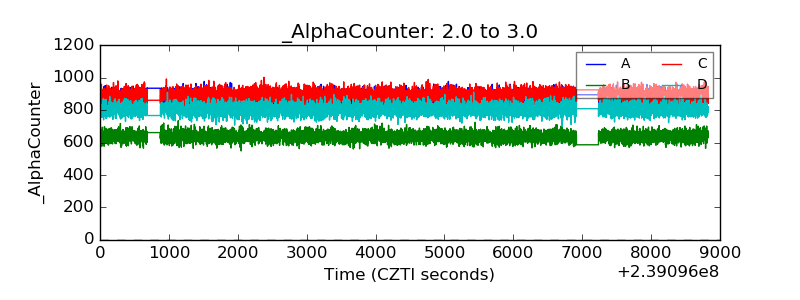 |
| _CPM_Rate | 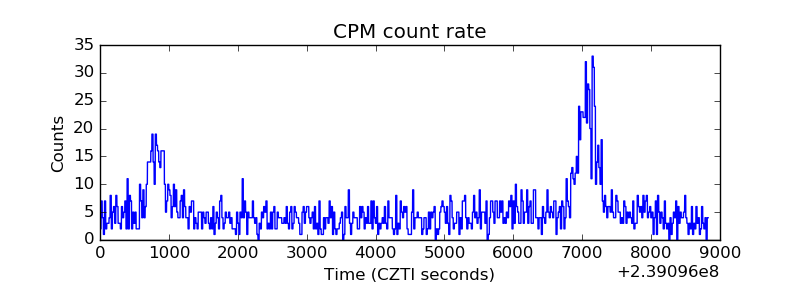 |
| CZT Counter | 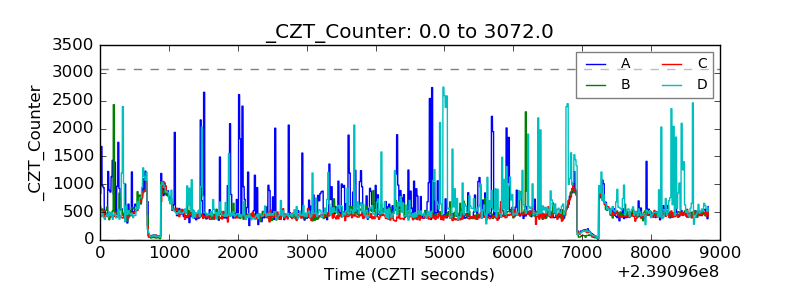 |
| +2.5 Volts monitor |  |
| +5 Volts monitor |  |
| _ROLL_ROT | 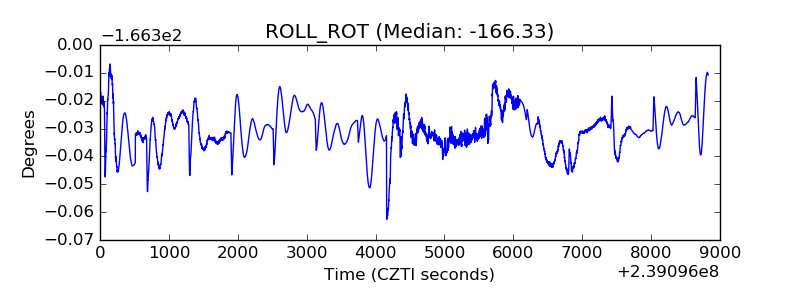 |
| _Roll_DEC | 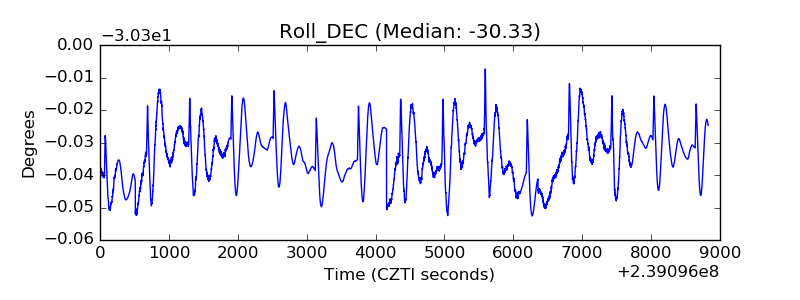 |
| _Roll_RA | 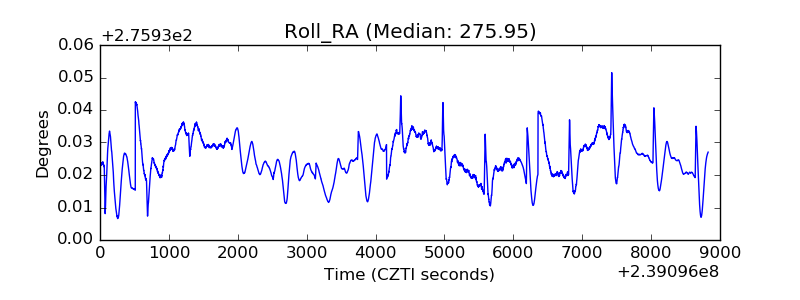 |
| Veto Counter | 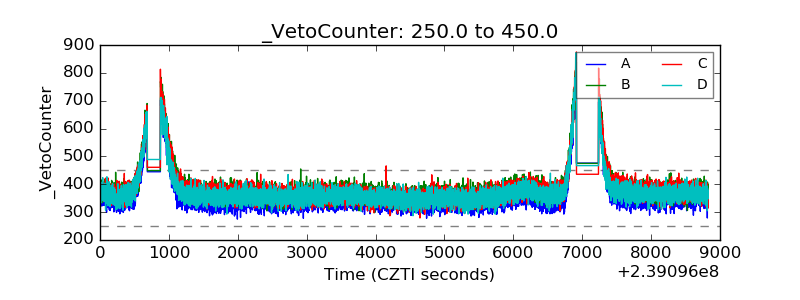 |