| Param | Original file | Final file |
|---|---|---|
| Filename | modeM0/AS1A03_107T01_9000001418_09937cztM0_level2.evt | modeM0/AS1A03_107T01_9000001418_09937cztM0_level2_quad_clean.evt |
| Size (bytes) | 1,027,543,680 | 155,183,040 |
| Size | 979.9 MB | 148.0 MB |
| Events in quadrant A | 7,526,193 | 947,465 |
| Events in quadrant B | 6,463,691 | 983,077 |
| Events in quadrant C | 5,795,869 | 978,055 |
| Events in quadrant D | 10,465,201 | 903,328 |
| Mode M0 | |||
|---|---|---|---|
| Quadrant | BADHDUFLAG | Total packets | Discarded packets |
| A | 0 | 30910 | 165 |
| B | 0 | 27548 | 129 |
| C | 0 | 26423 | 134 |
| D | 0 | 40115 | 401 |
| Mode SS | |||
|---|---|---|---|
| Quadrant | BADHDUFLAG | Total packets | Discarded packets |
| A | 0 | 262 | 0 |
| B | 0 | 262 | 0 |
| C | 0 | 262 | 0 |
| D | 0 | 262 | 2 |
| Mode M9 | |||
|---|---|---|---|
| Quadrant | BADHDUFLAG | Total packets | Discarded packets |
| A | 0 | 17 | 0 |
| B | 0 | 17 | 1 |
| C | 0 | 17 | 0 |
| D | 0 | 17 | 0 |
| Quadrant | Total seconds | Saturated seconds | Saturation percentage |
|---|---|---|---|
| A | 12860 | 427 | 3.320373% |
| B | 12863 | 309 | 2.402239% |
| C | 12858 | 223 | 1.734329% |
| D | 12824 | 881 | 6.869931% |
Noise dominated data is calculated using 1-second bins in cleaned event files. If a bin has >2000 counts, and if more than 50% of those come from <1% of pixels, then it is considered to be noise-dominated and hence unusable.
| Quadrant | # 1 sec bins | Bins with >0 counts | Bins with >2000 counts | High rate bins dominated by noise | Noise dominated (total time) | Noise dominated (detector-on time) | Marked lightcurve |
|---|---|---|---|---|---|---|---|
| A | 14507 | 12920 | 139 | 139 | 0.96% | 1.08% | 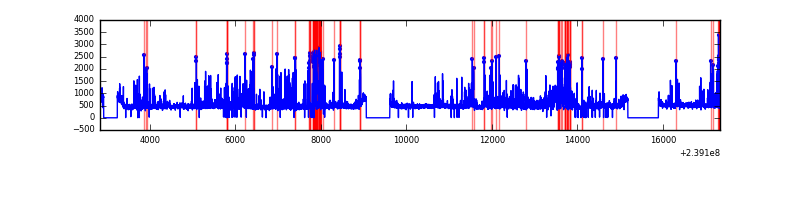 |
| B | 14507 | 12920 | 25 | 25 | 0.17% | 0.19% | 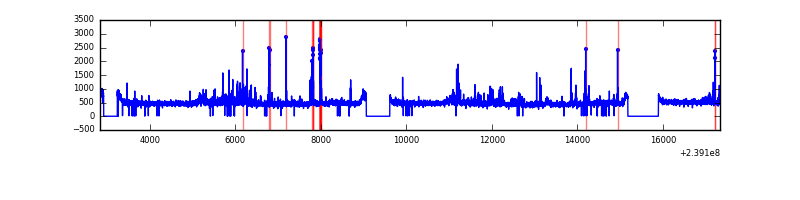 |
| C | 14507 | 12921 | 1 | 1 | 0.01% | 0.01% | 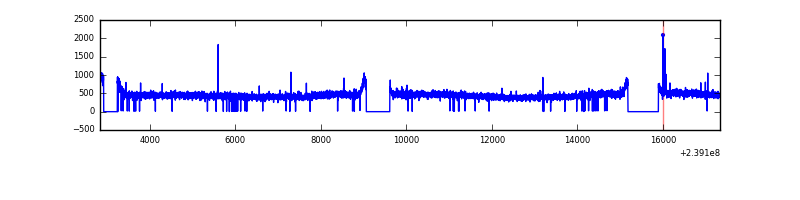 |
| D | 14507 | 12909 | 657 | 657 | 4.53% | 5.09% | 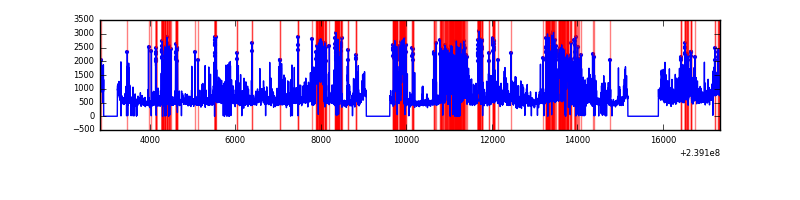 |
Top three noisy pixels from each quadrant. If the there are fewer than three noisy pixels in the level2.evt file, extra rows are filled as -1
| Pixel properties | Quadrant properties | ||||||
|---|---|---|---|---|---|---|---|
| Quadrant | DetID | PixID | Counts | Sigma | Mean | Median | Sigma |
| A | 15 | 239 | 1613591 | 5225.28 | 1508 | 1475 | 308.5 |
| A | 15 | 174 | 90464 | 288.44 | 1508 | 1475 | 308.5 |
| A | 14 | 111 | 16791 | 49.64 | 1508 | 1475 | 308.5 |
| B | 4 | 81 | 135687 | 459.01 | 1522 | 1480 | 292.4 |
| B | 10 | 252 | 127256 | 430.17 | 1522 | 1480 | 292.4 |
| B | 0 | 214 | 94946 | 319.67 | 1522 | 1480 | 292.4 |
| C | 14 | 234 | 12522 | 31.91 | 1479 | 1480 | 346.0 |
| C | 13 | 61 | 11240 | 28.21 | 1479 | 1480 | 346.0 |
| C | 12 | 4 | 8439 | 20.11 | 1479 | 1480 | 346.0 |
| D | 1 | 52 | 2502772 | 6981.03 | 1439 | 1396 | 358.3 |
| D | 2 | 16 | 1043134 | 2907.36 | 1439 | 1396 | 358.3 |
| D | 12 | 233 | 523411 | 1456.88 | 1439 | 1396 | 358.3 |
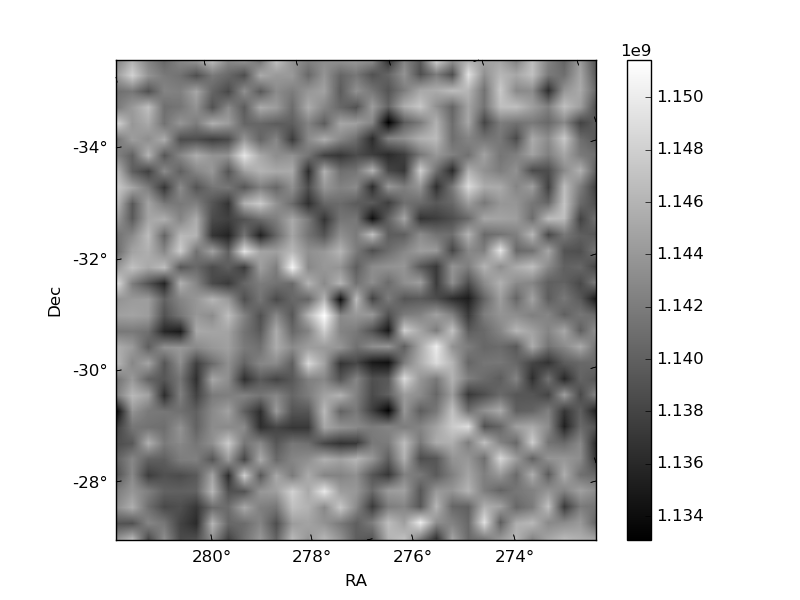
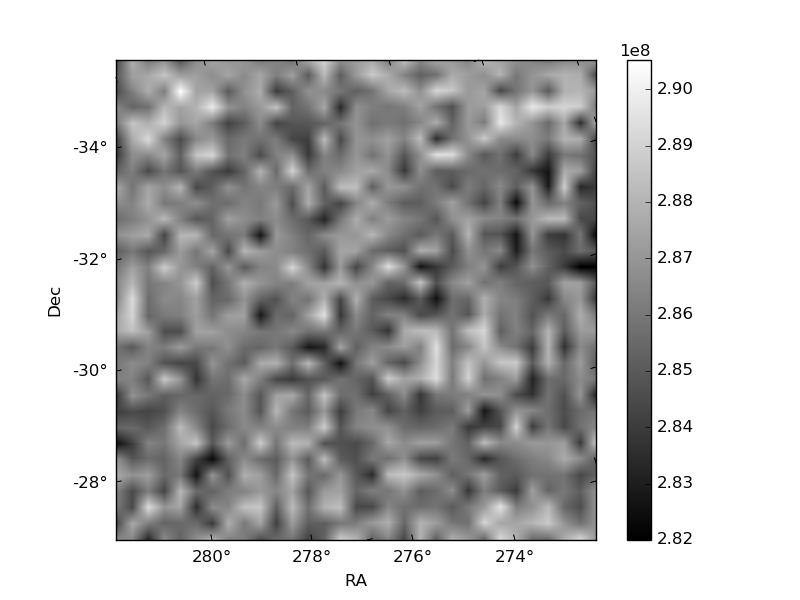
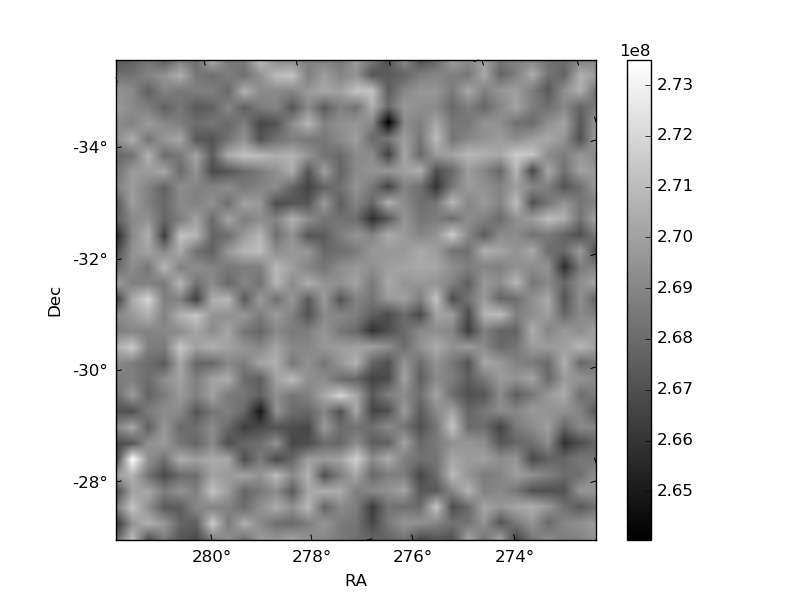
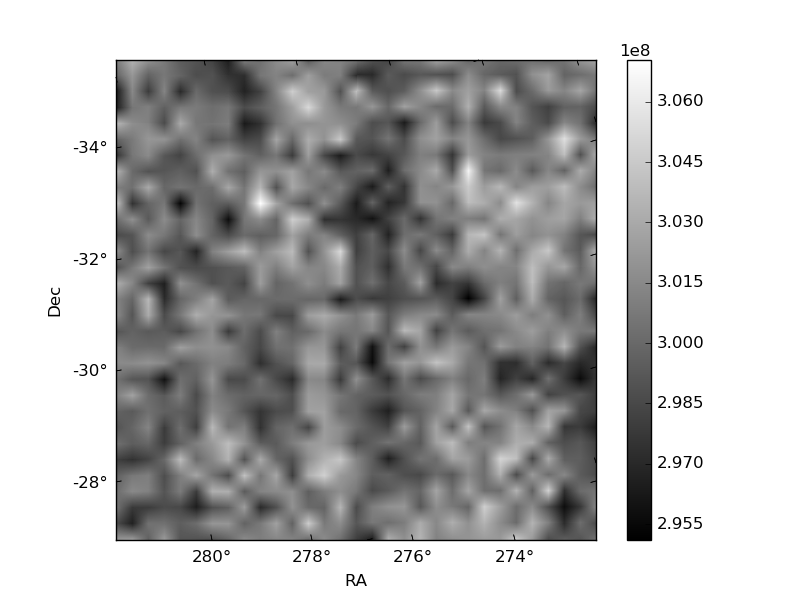
Histogram calculated using DETX and DETY for each event in the final _common_clean file
| Quadrant A | 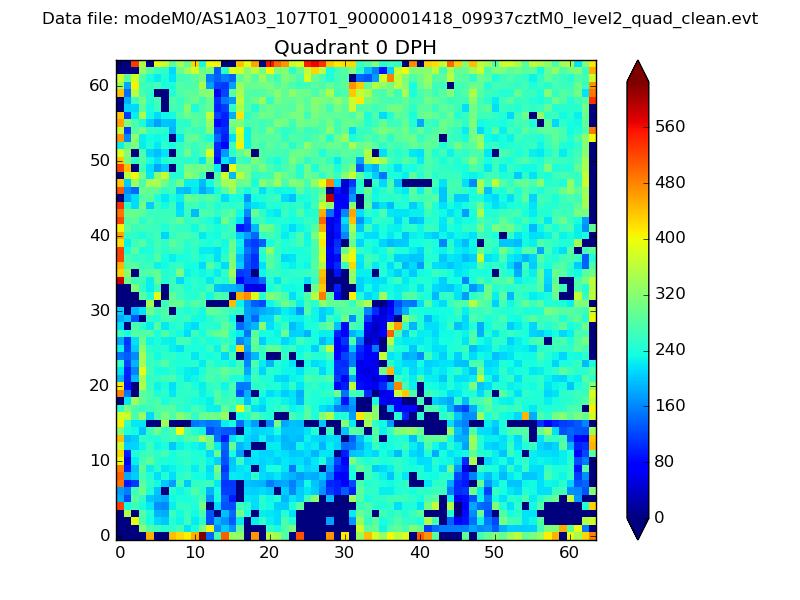 |
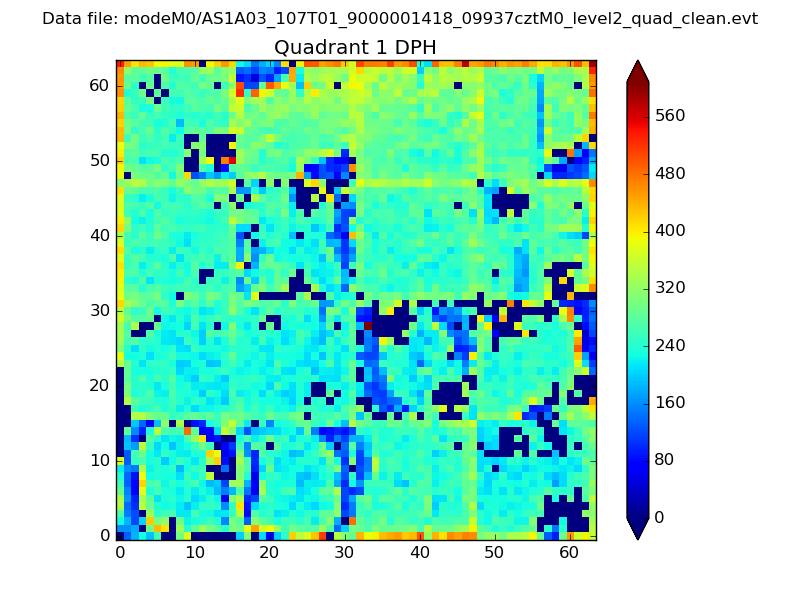 |
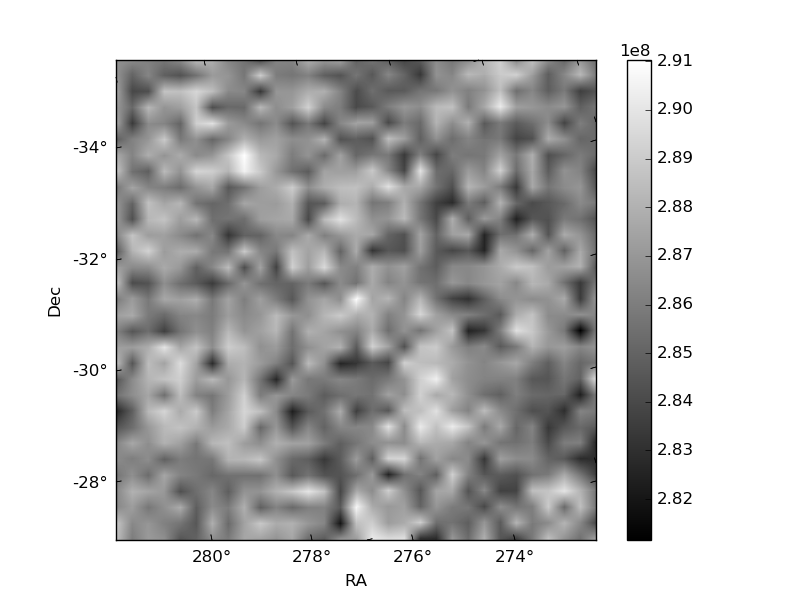
Quadrant B |
|---|---|---|---|
| Quadrant D | 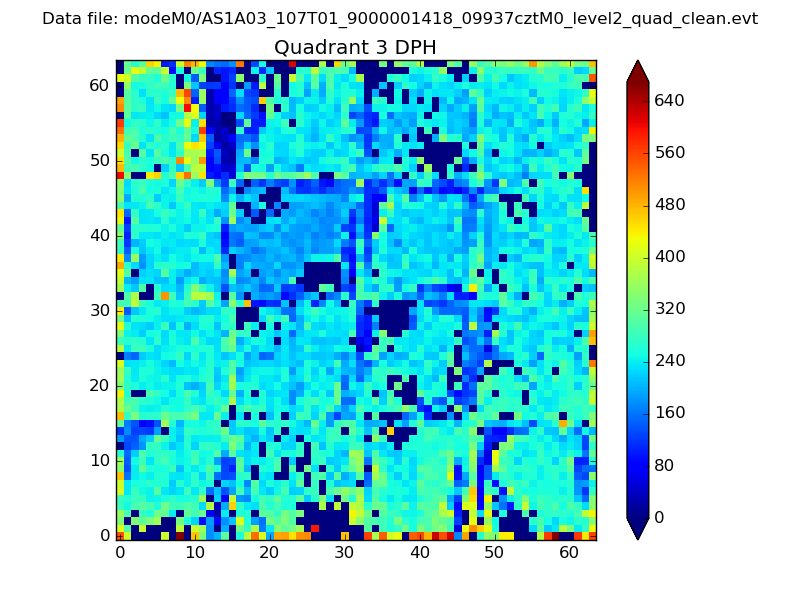 |
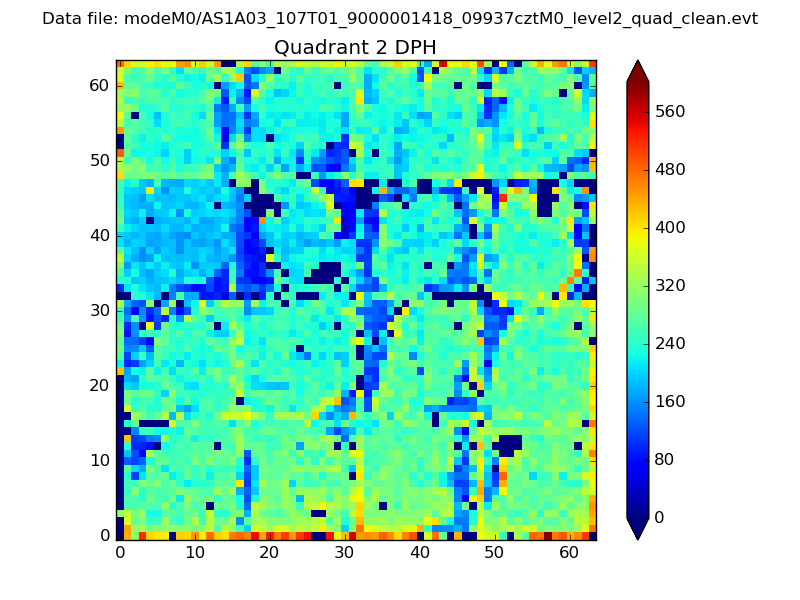 |
Quadrant C |
| Plot type | Count rate plots | Images |
|---|---|---|
| Comparison with Poisson distribution Blue bars denote a histogram of data divided into 1 sec bins. Red curve is a Poisson curve with rate = median count rate of data. |
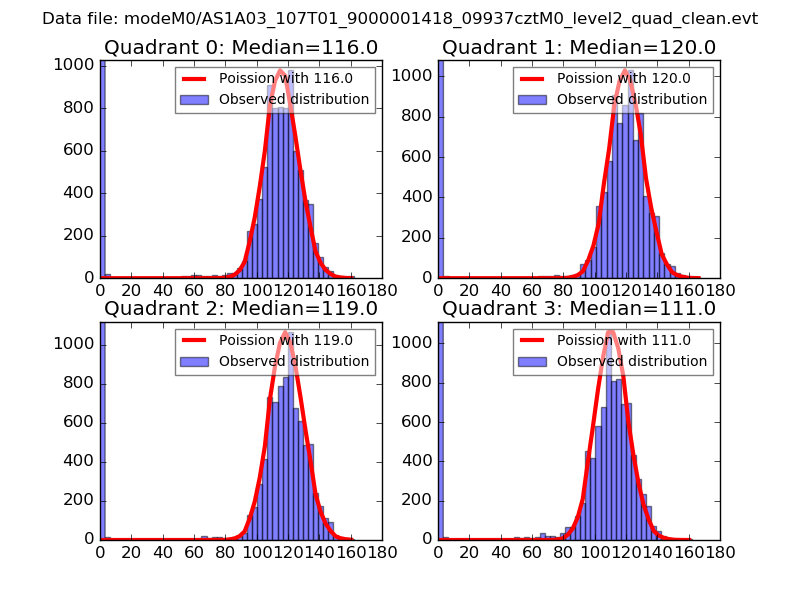 |
 |
| Quadrant-wise count rates Data is divided into 100 sec bins |
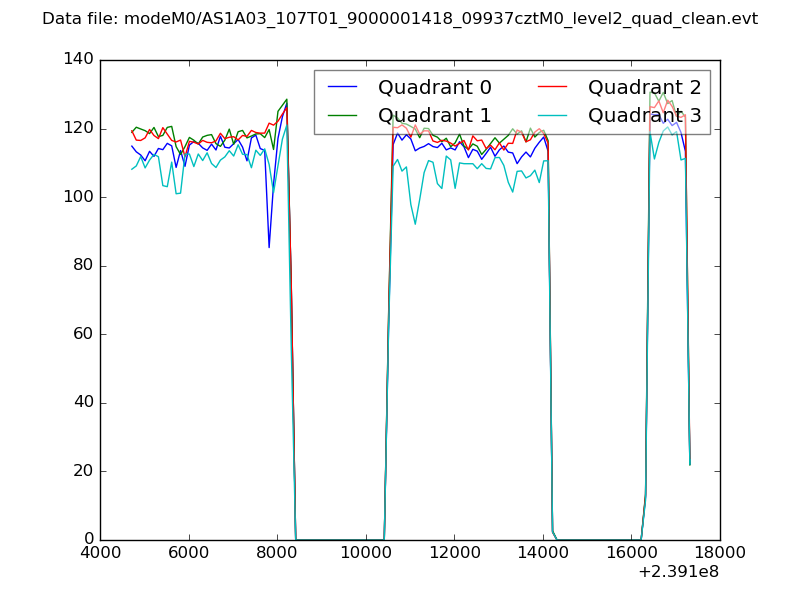 |
|
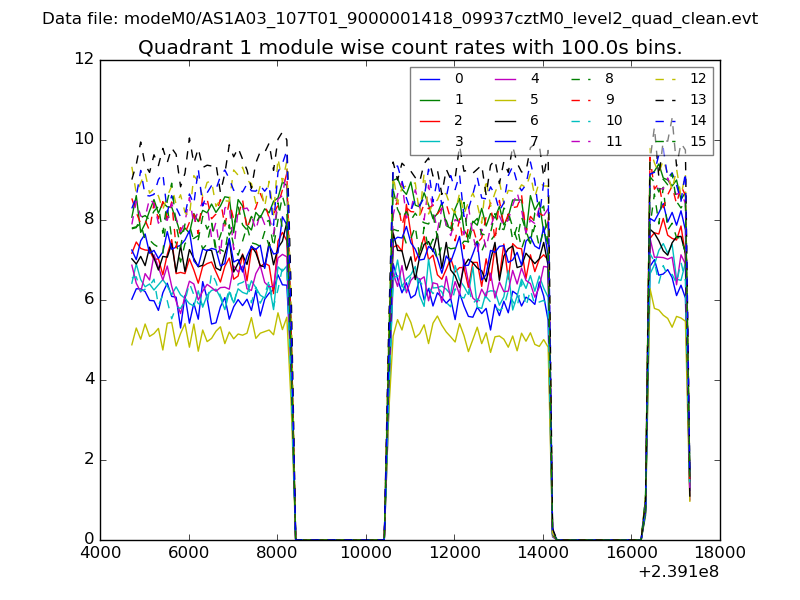
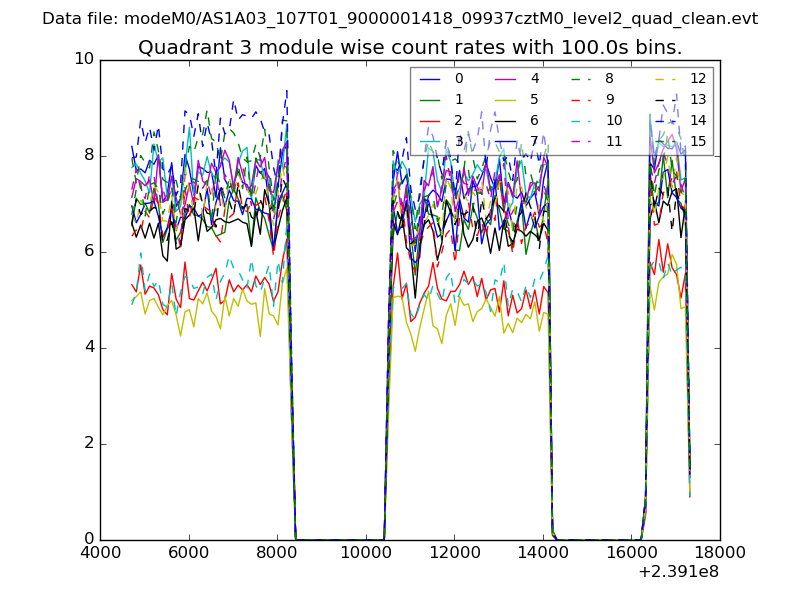
| Module-wise count rates for Quadrant A Data is divided into 100 sec bins |
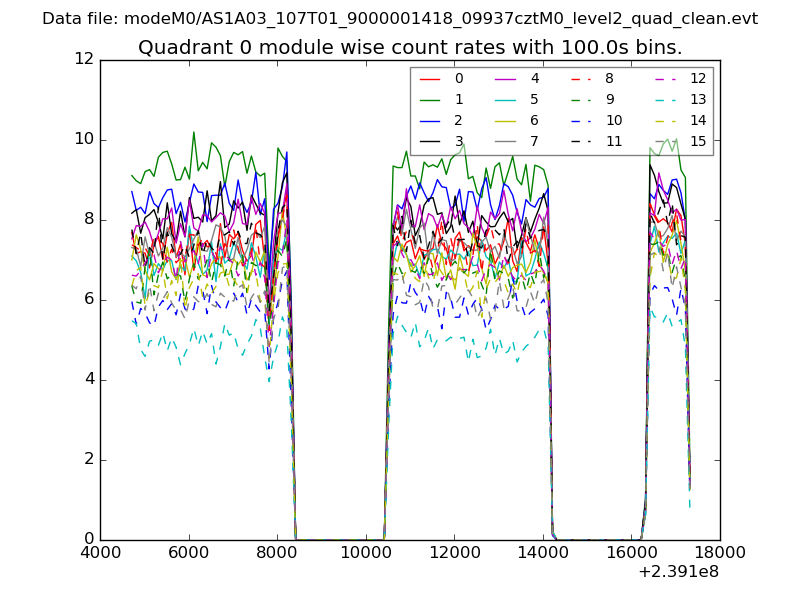 |
 |
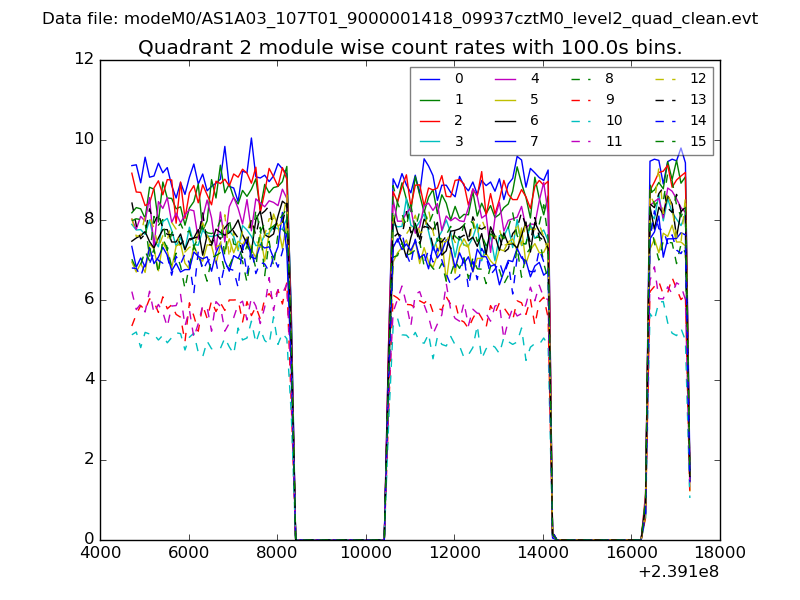
| Module-wise count rates for Quadrant B Data is divided into 100 sec bins |
 |
 |
| Module-wise count rates for Quadrant C Data is divided into 100 sec bins |
 |
 |
| Module-wise count rates for Quadrant D Data is divided into 100 sec bins |
 |
 |
| Parameter | Plot |
|---|---|
| CZT HV Monitor | 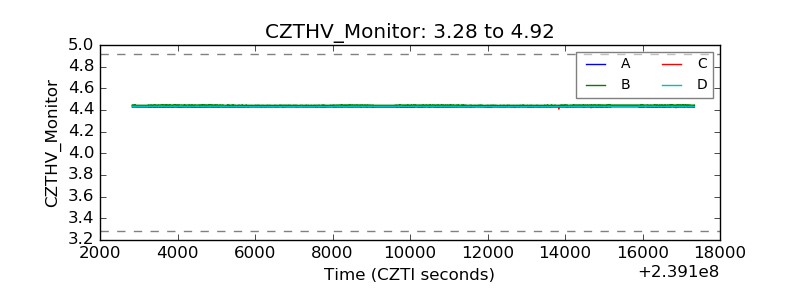 |
| D_VDD | 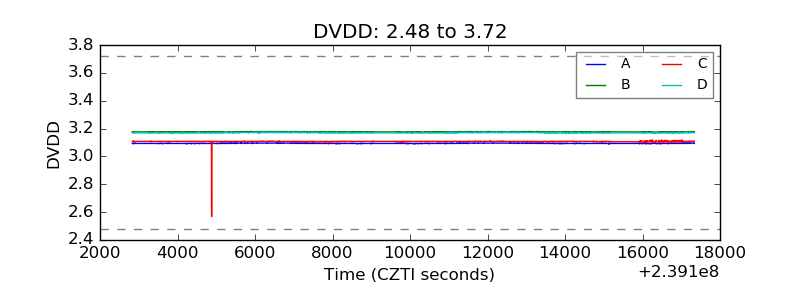 |
| Temperature 1 | 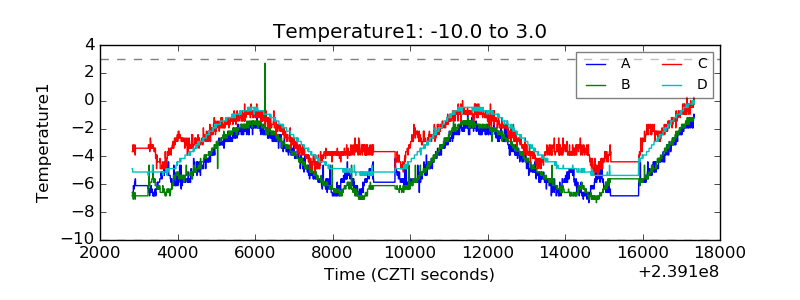 |
| Veto HV Monitor | 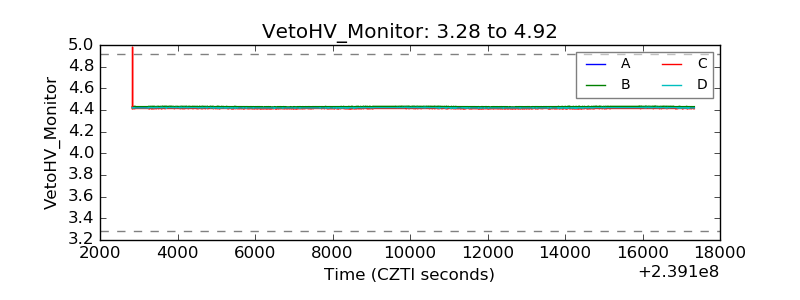 |
| Veto LLD | 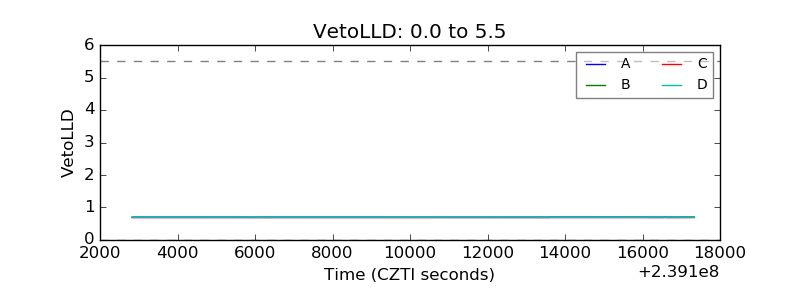 |
| Alpha Counter | 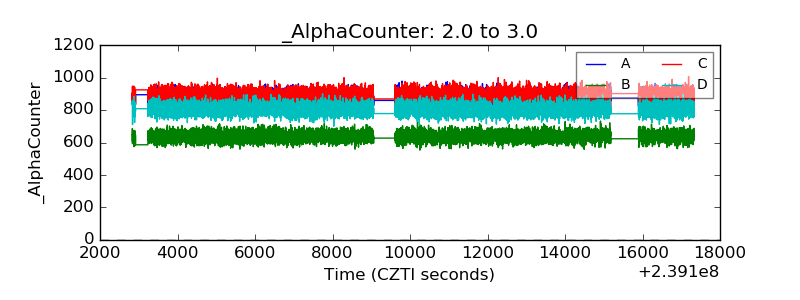 |
| _CPM_Rate | 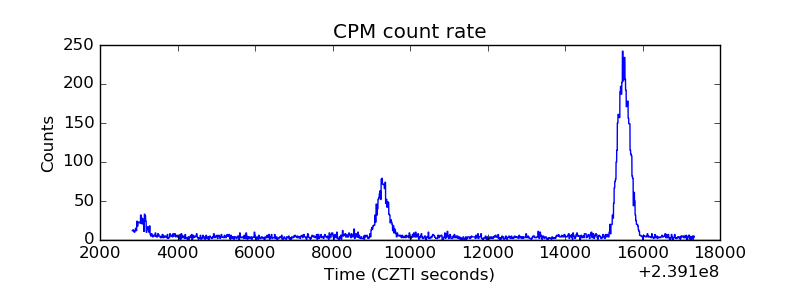 |
| CZT Counter |  |
| +2.5 Volts monitor |  |
| +5 Volts monitor |  |
| _ROLL_ROT | 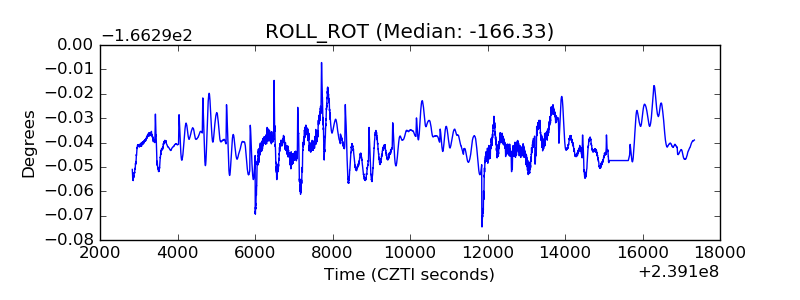 |
| _Roll_DEC | 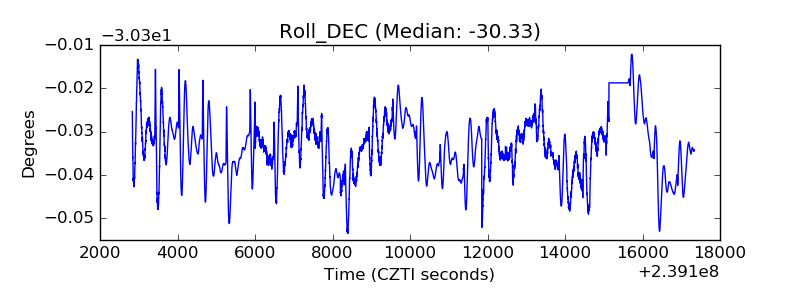 |
| _Roll_RA | 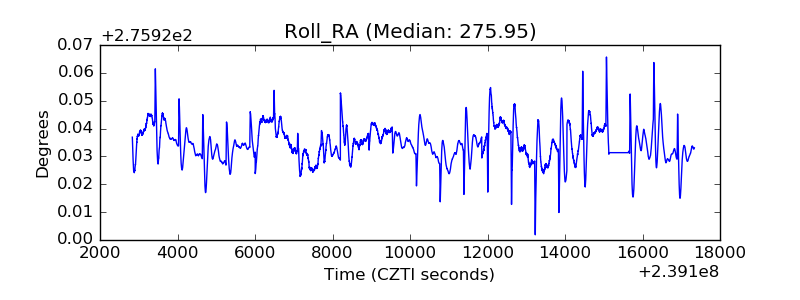 |
| Veto Counter | 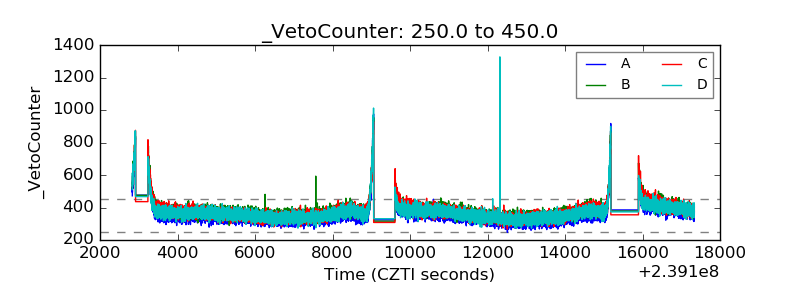 |