| Param | Original file | Final file |
|---|---|---|
| Filename | modeM0/AS1A03_107T01_9000001418_09939cztM0_level2.evt | modeM0/AS1A03_107T01_9000001418_09939cztM0_level2_quad_clean.evt |
| Size (bytes) | 258,609,600 | 52,997,760 |
| Size | 246.6 MB | 50.5 MB |
| Events in quadrant A | 1,587,117 | 352,293 |
| Events in quadrant B | 2,322,111 | 352,654 |
| Events in quadrant C | 1,272,484 | 358,004 |
| Events in quadrant D | 2,452,581 | 335,307 |
| Mode M0 | |||
|---|---|---|---|
| Quadrant | BADHDUFLAG | Total packets | Discarded packets |
| A | 0 | 6635 | 1 |
| B | 0 | 8910 | 1 |
| C | 0 | 5842 | 1 |
| D | 0 | 9358 | 1 |
| Mode SS | |||
|---|---|---|---|
| Quadrant | BADHDUFLAG | Total packets | Discarded packets |
| A | 0 | 58 | 0 |
| B | 0 | 58 | 0 |
| C | 0 | 58 | 0 |
| D | 0 | 58 | 0 |
| Quadrant | Total seconds | Saturated seconds | Saturation percentage |
|---|---|---|---|
| A | 2891 | 47 | 1.625735% |
| B | 2891 | 115 | 3.977862% |
| C | 2891 | 2 | 0.069180% |
| D | 2891 | 119 | 4.116223% |
Noise dominated data is calculated using 1-second bins in cleaned event files. If a bin has >2000 counts, and if more than 50% of those come from <1% of pixels, then it is considered to be noise-dominated and hence unusable.
| Quadrant | # 1 sec bins | Bins with >0 counts | Bins with >2000 counts | High rate bins dominated by noise | Noise dominated (total time) | Noise dominated (detector-on time) | Marked lightcurve |
|---|---|---|---|---|---|---|---|
| A | 2891 | 2891 | 36 | 36 | 1.25% | 1.25% | 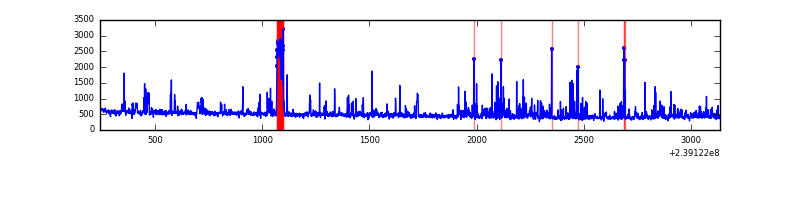 |
| B | 2891 | 2891 | 81 | 81 | 2.80% | 2.80% | 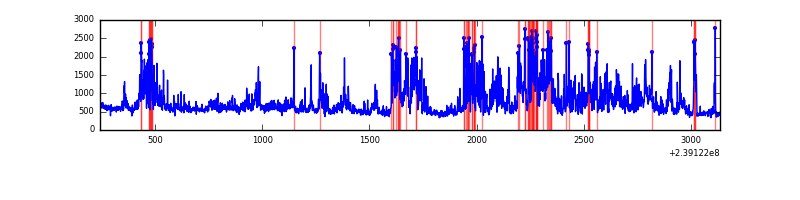 |
| C | 2891 | 2891 | 0 | 0 | 0.00% | 0.00% | 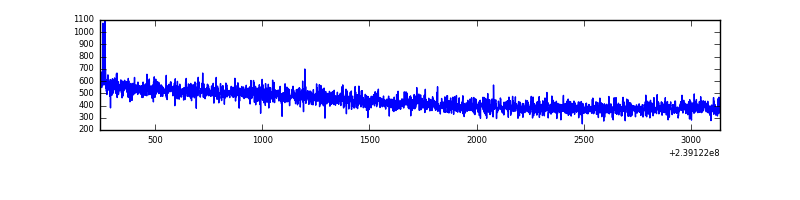 |
| D | 2891 | 2891 | 113 | 113 | 3.91% | 3.91% | 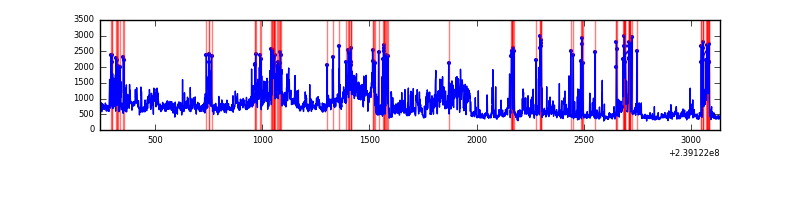 |
Top three noisy pixels from each quadrant. If the there are fewer than three noisy pixels in the level2.evt file, extra rows are filled as -1
| Pixel properties | Quadrant properties | ||||||
|---|---|---|---|---|---|---|---|
| Quadrant | DetID | PixID | Counts | Sigma | Mean | Median | Sigma |
| A | 15 | 239 | 199324 | 2817.09 | 339 | 332 | 70.6 |
| A | 15 | 174 | 78672 | 1109.04 | 339 | 332 | 70.6 |
| A | 8 | 15 | 3355 | 42.8 | 339 | 332 | 70.6 |
| B | 4 | 81 | 735585 | 11129.57 | 336 | 329 | 66.1 |
| B | 4 | 239 | 172231 | 2602.08 | 336 | 329 | 66.1 |
| B | 0 | 214 | 52902 | 795.8 | 336 | 329 | 66.1 |
| C | 13 | 61 | 2420 | 27.12 | 325 | 327 | 77.2 |
| C | 14 | 234 | 1589 | 16.35 | 325 | 327 | 77.2 |
| C | 14 | 67 | 1426 | 14.24 | 325 | 327 | 77.2 |
| D | 2 | 16 | 842328 | 9940.97 | 325 | 317 | 84.7 |
| D | 12 | 233 | 96681 | 1137.7 | 325 | 317 | 84.7 |
| D | 1 | 52 | 88339 | 1039.21 | 325 | 317 | 84.7 |
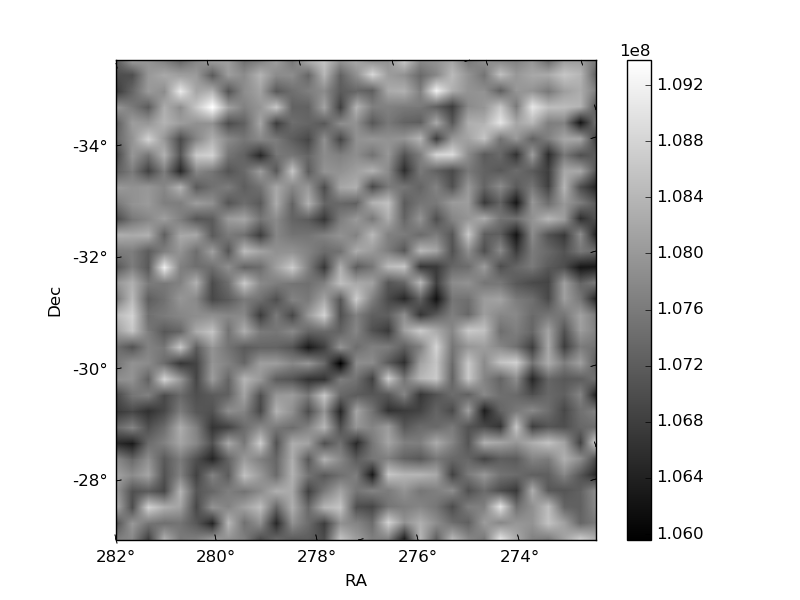
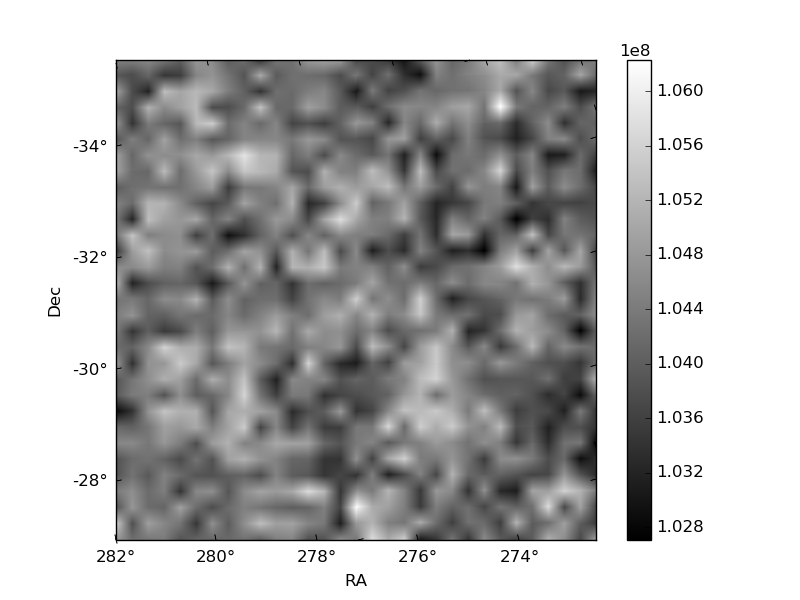
Histogram calculated using DETX and DETY for each event in the final _common_clean file
| Quadrant A |  |
 |
Quadrant B |
|---|---|---|---|
| Quadrant D |  |
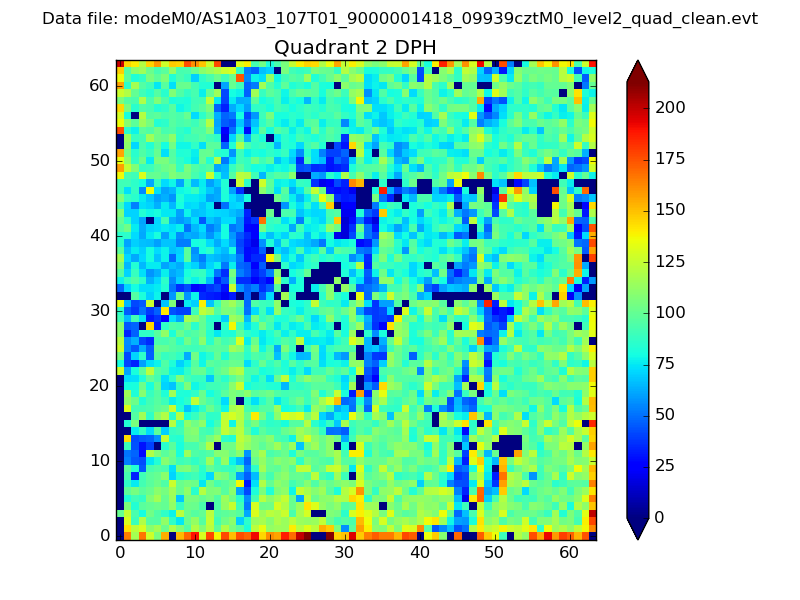 |
Quadrant C |
| Plot type | Count rate plots | Images |
|---|---|---|
| Comparison with Poisson distribution Blue bars denote a histogram of data divided into 1 sec bins. Red curve is a Poisson curve with rate = median count rate of data. |
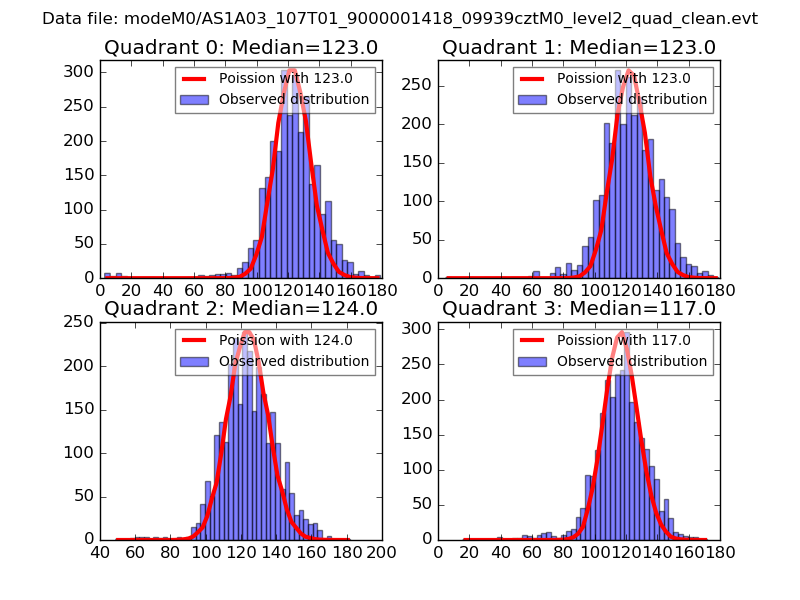 |
 |
| Quadrant-wise count rates Data is divided into 100 sec bins |
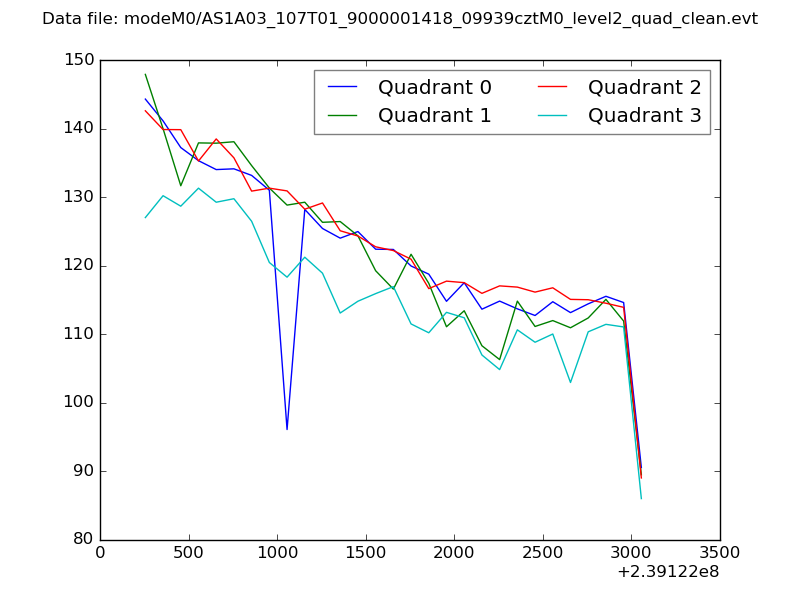 |
|
| Module-wise count rates for Quadrant A Data is divided into 100 sec bins |
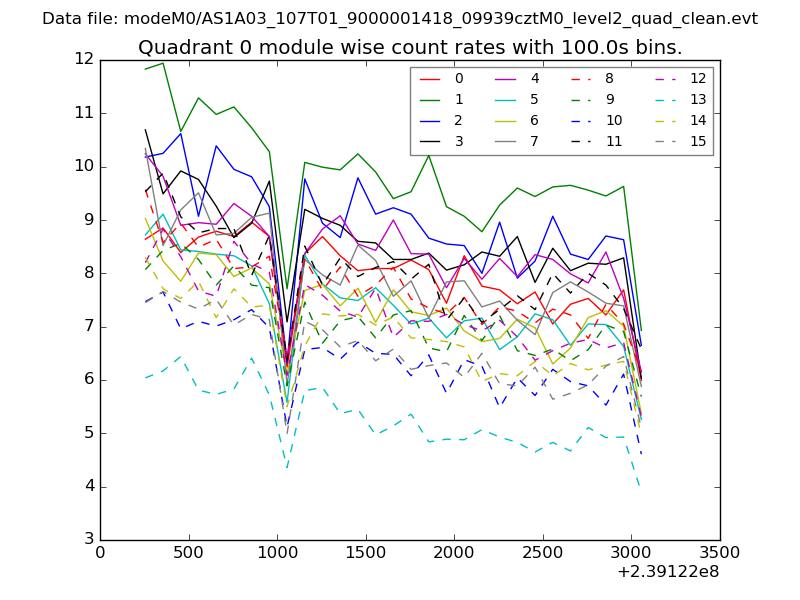 |
 |
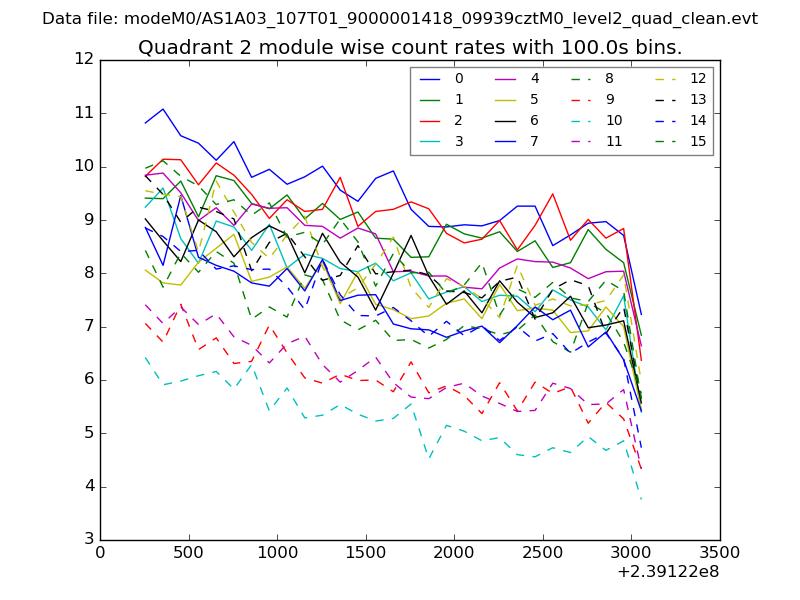
| Module-wise count rates for Quadrant B Data is divided into 100 sec bins |
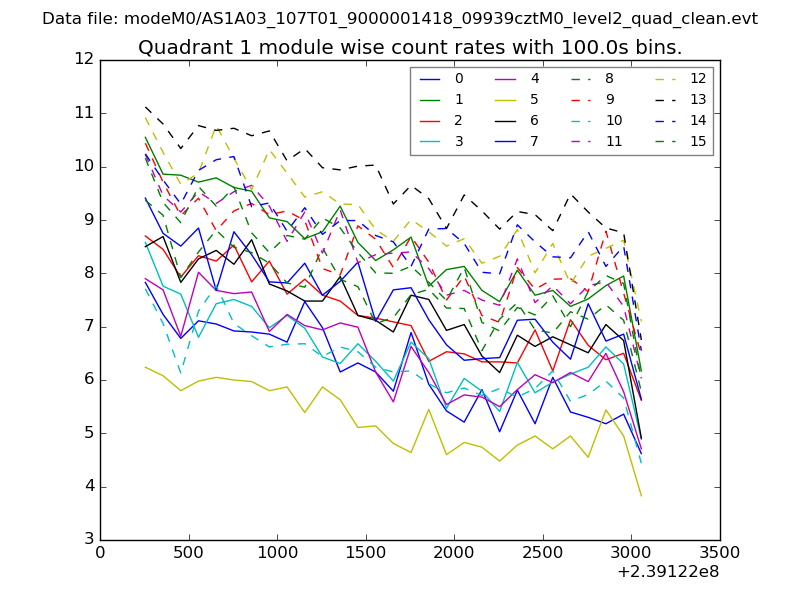 |
 |
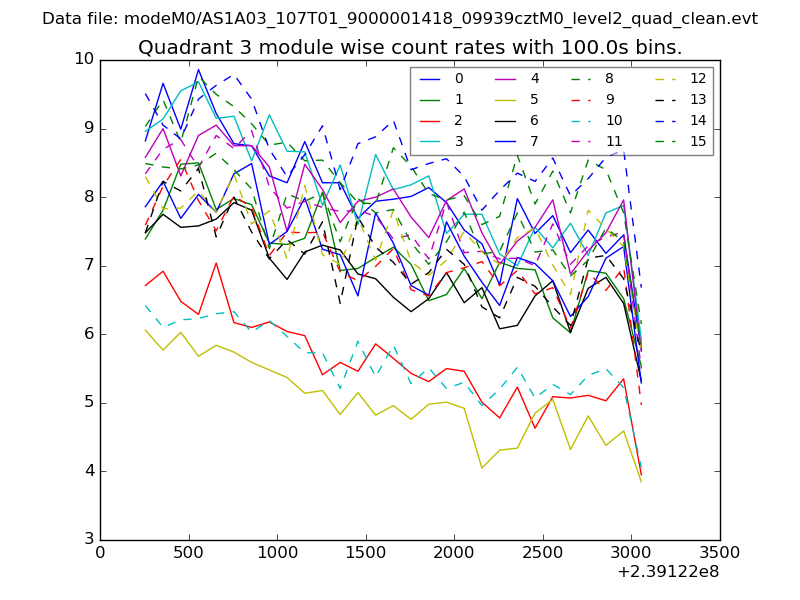
| Module-wise count rates for Quadrant C Data is divided into 100 sec bins |
 |
 |
| Module-wise count rates for Quadrant D Data is divided into 100 sec bins |
 |
 |
| Parameter | Plot |
|---|---|
| CZT HV Monitor | 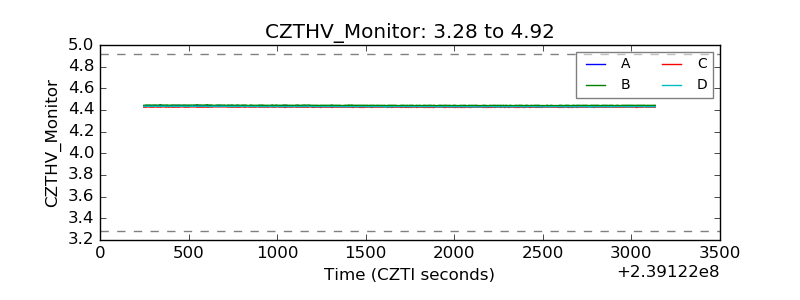 |
| D_VDD | 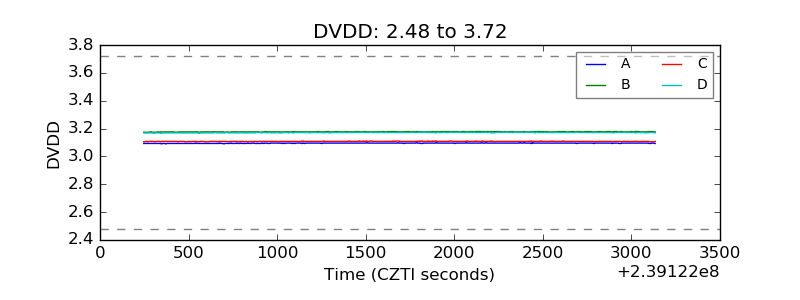 |
| Temperature 1 | 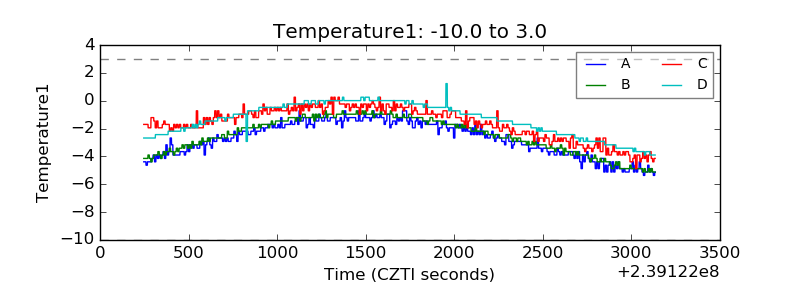 |
| Veto HV Monitor | 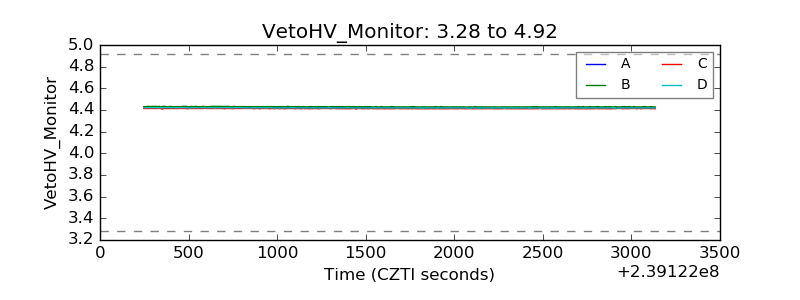 |
| Veto LLD | 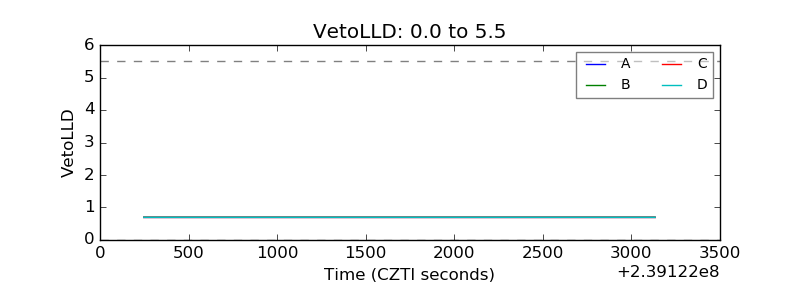 |
| Alpha Counter | 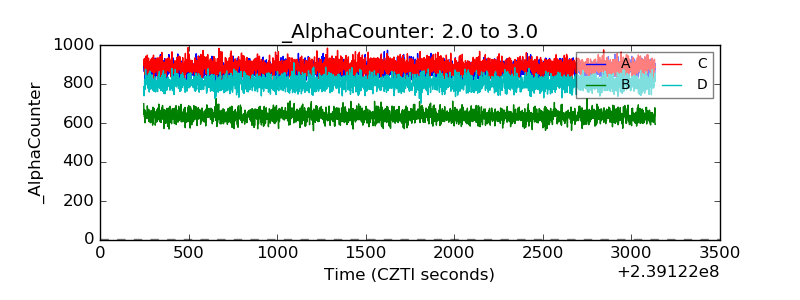 |
| _CPM_Rate | 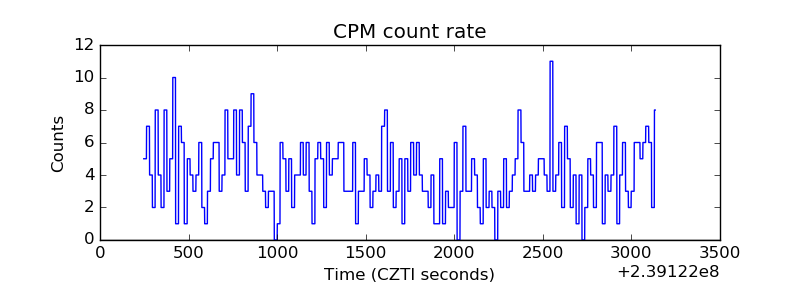 |
| CZT Counter | 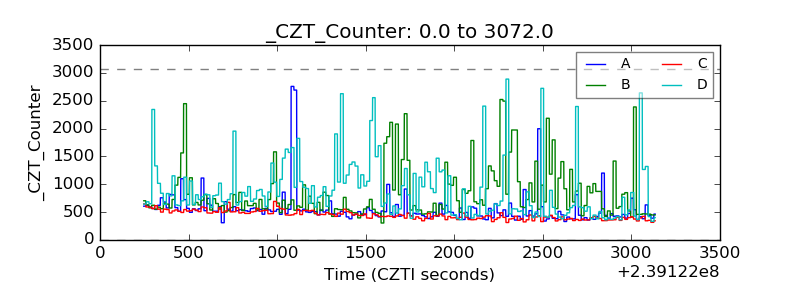 |
| +2.5 Volts monitor |  |
| +5 Volts monitor | 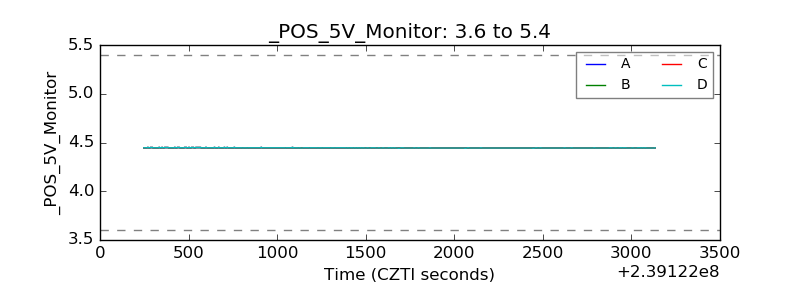 |
| _ROLL_ROT | 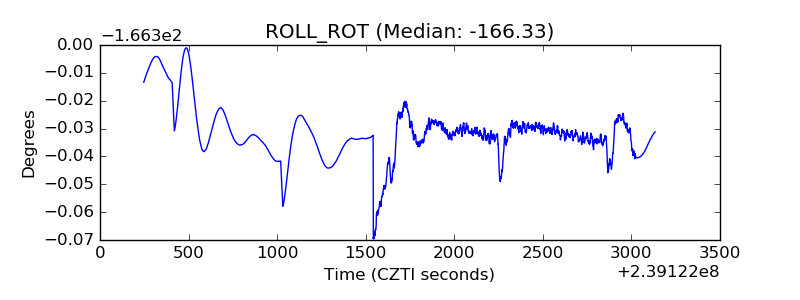 |
| _Roll_DEC | 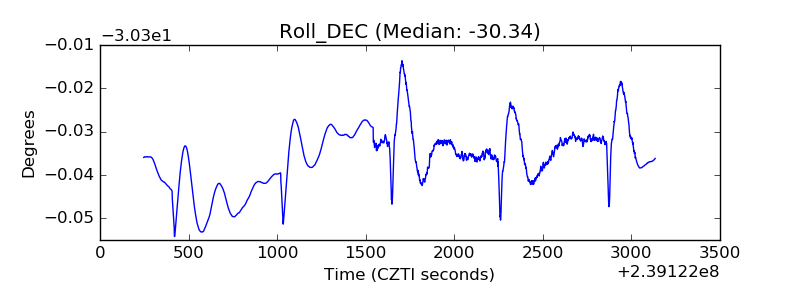 |
| _Roll_RA | 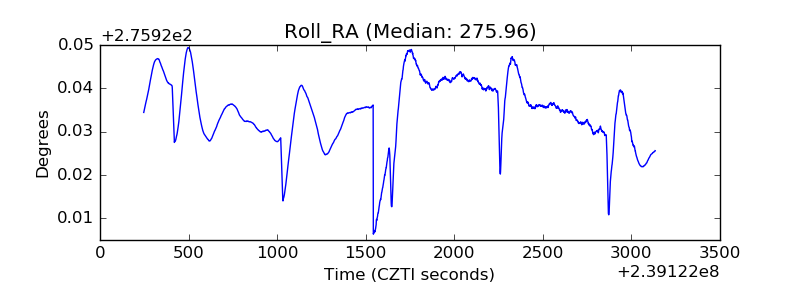 |
| Veto Counter | 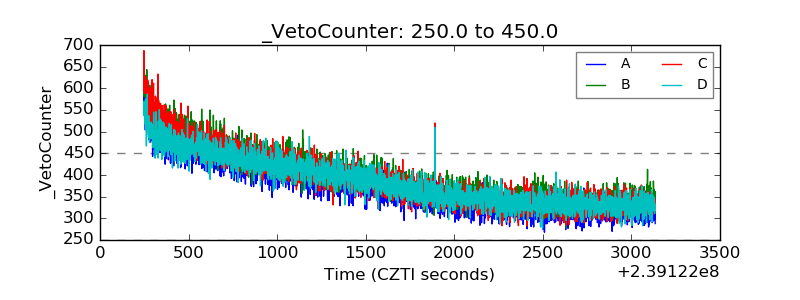 |