| Param | Original file | Final file |
|---|---|---|
| Filename | modeM0/AS1G07_016T01_9000001420cztM0_level2.fits | modeM0/AS1G07_016T01_9000001420cztM0_level2_quad_clean.evt |
| Size (bytes) | 707,454,720 | 663,491,520 |
| Size | 674.7 MB | 632.8 MB |
| Events in quadrant A | 4,264,082 | 3,883,372 |
| Events in quadrant B | 4,109,282 | 3,864,971 |
| Events in quadrant C | 4,241,476 | 3,779,625 |
| Events in quadrant D | 3,535,570 | 3,293,605 |
| Mode SS | |||
|---|---|---|---|
| Quadrant | BADHDUFLAG | Total packets | Discarded packets |
| A | 0 | 1578 | 0 |
| B | 0 | 1592 | 0 |
| C | 0 | 1562 | 0 |
| D | 0 | 1574 | 0 |
| Mode M0 | |||
|---|---|---|---|
| Quadrant | BADHDUFLAG | Total packets | Discarded packets |
| A | 0 | 162842 | 0 |
| B | 0 | 169514 | 0 |
| C | 0 | 157692 | 0 |
| D | 0 | 215401 | 0 |
| Mode M9 | |||
|---|---|---|---|
| Quadrant | BADHDUFLAG | Total packets | Discarded packets |
| A | 0 | 133 | 0 |
| B | 0 | 131 | 0 |
| C | 0 | 132 | 0 |
| D | 0 | 131 | 0 |
| Quadrant | Total seconds | Saturated seconds | Saturation percentage |
|---|---|---|---|
| A | 76906 | 1104 | 1.435519% |
| B | 76841 | 1452 | 1.889616% |
| C | 76985 | 686 | 0.891083% |
| D | 76566 | 3621 | 4.729253% |
Noise dominated data is calculated using 1-second bins in cleaned event files. If a bin has >2000 counts, and if more than 50% of those come from <1% of pixels, then it is considered to be noise-dominated and hence unusable.
| Quadrant | # 1 sec bins | Bins with >0 counts | Bins with >2000 counts | High rate bins dominated by noise | Noise dominated (total time) | Noise dominated (detector-on time) | Marked lightcurve |
|---|---|---|---|---|---|---|---|
| A | 92448 | 78122 | 0 | 0 | 0.00% | 0.00% |  |
| B | 92449 | 78008 | 0 | 0 | 0.00% | 0.00% |  |
| C | 92449 | 78141 | 0 | 0 | 0.00% | 0.00% |  |
| D | 92449 | 77752 | 0 | 0 | 0.00% | 0.00% |  |
Top three noisy pixels from each quadrant. If the there are fewer than three noisy pixels in the level2.evt file, extra rows are filled as -1
| Pixel properties | Quadrant properties | ||||||
|---|---|---|---|---|---|---|---|
| Quadrant | DetID | PixID | Counts | Sigma | Mean | Median | Sigma |
| A | 0 | 29 | 4200 | 11.25 | 1110 | 1037 | 281.3 |
| A | 7 | 110 | 3470 | 8.65 | 1110 | 1037 | 281.3 |
| A | 0 | 30 | 3276 | 7.96 | 1110 | 1037 | 281.3 |
| B | 2 | 9 | 3608 | 12.02 | 1087 | 1035 | 214.1 |
| B | 14 | 254 | 2779 | 8.15 | 1087 | 1035 | 214.1 |
| B | 3 | 17 | 2772 | 8.11 | 1087 | 1035 | 214.1 |
| C | 1 | 80 | 3113 | 7.06 | 1120 | 1036 | 294.2 |
| C | 1 | 81 | 3109 | 7.05 | 1120 | 1036 | 294.2 |
| C | 12 | 241 | 3010 | 6.71 | 1120 | 1036 | 294.2 |
| D | 3 | 14 | 2655 | 6.45 | 1007 | 913 | 270.1 |
| D | 10 | 189 | 2609 | 6.28 | 1007 | 913 | 270.1 |
| D | 6 | 231 | 2564 | 6.11 | 1007 | 913 | 270.1 |
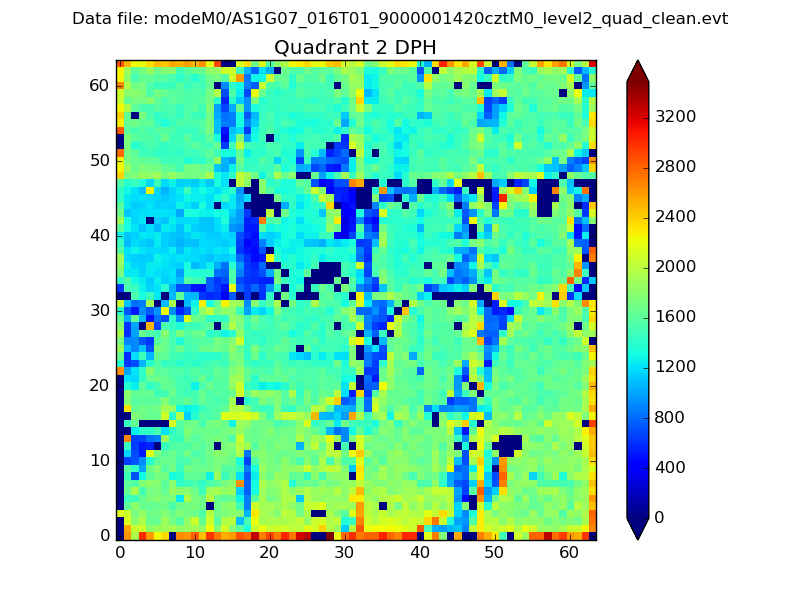
Histogram calculated using DETX and DETY for each event in the final _common_clean file
| Quadrant A |  |
 |
Quadrant B |
|---|---|---|---|
| Quadrant D | 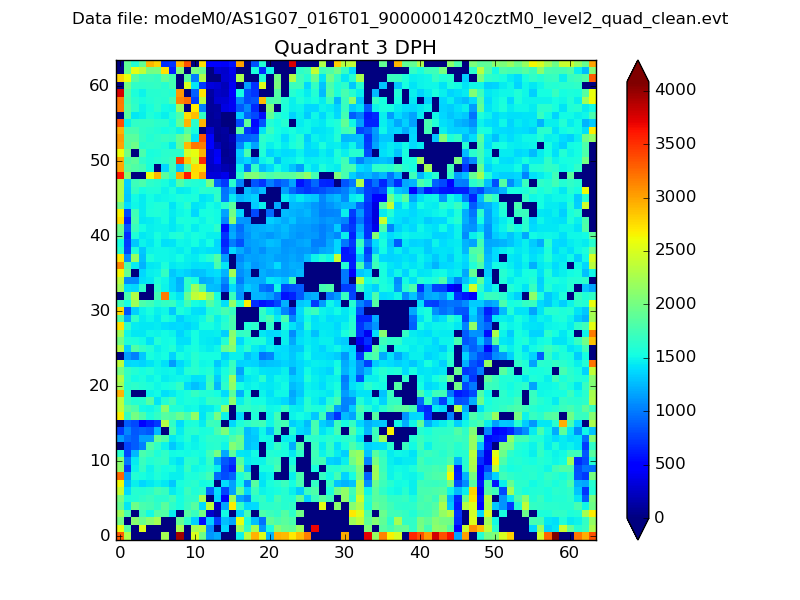 |
 |
Quadrant C |
| Plot type | Count rate plots | Images |
|---|---|---|
| Comparison with Poisson distribution Blue bars denote a histogram of data divided into 1 sec bins. Red curve is a Poisson curve with rate = median count rate of data. |
 |
 |
| Quadrant-wise count rates Data is divided into 100 sec bins |
 |
|
| Module-wise count rates for Quadrant A Data is divided into 100 sec bins |
 |
 |
| Module-wise count rates for Quadrant B Data is divided into 100 sec bins |
 |
 |
| Module-wise count rates for Quadrant C Data is divided into 100 sec bins |
 |
 |
| Module-wise count rates for Quadrant D Data is divided into 100 sec bins |
 |
 |
| Parameter | Plot |
|---|---|
| CZT HV Monitor |  |
| D_VDD |  |
| Temperature 1 |  |
| Veto HV Monitor | 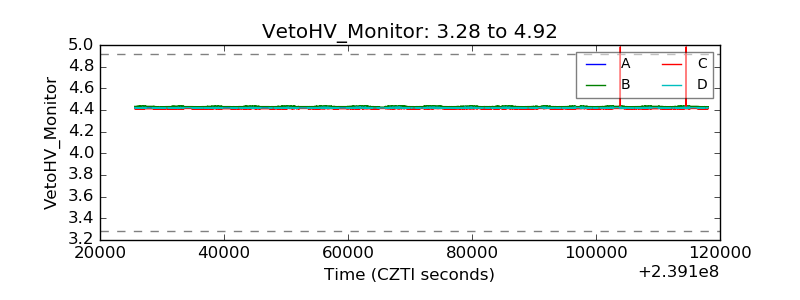 |
| Veto LLD |  |
| Alpha Counter |  |
| _CPM_Rate |  |
| CZT Counter |  |
| +2.5 Volts monitor |  |
| +5 Volts monitor |  |
| _ROLL_ROT |  |
| _Roll_DEC |  |
| _Roll_RA |  |
| Veto Counter |  |