| Param | Original file | Final file |
|---|---|---|
| Filename | modeM0/AS1G07_016T01_9000001420_09941cztM0_level2.evt | modeM0/AS1G07_016T01_9000001420_09941cztM0_level2_quad_clean.evt |
| Size (bytes) | 466,300,800 | 82,560,960 |
| Size | 444.7 MB | 78.7 MB |
| Events in quadrant A | 3,324,541 | 529,009 |
| Events in quadrant B | 3,304,439 | 531,051 |
| Events in quadrant C | 2,709,339 | 524,425 |
| Events in quadrant D | 4,371,853 | 492,169 |
| Mode SS | |||
|---|---|---|---|
| Quadrant | BADHDUFLAG | Total packets | Discarded packets |
| A | 0 | 124 | 0 |
| B | 0 | 124 | 0 |
| C | 0 | 124 | 0 |
| D | 0 | 124 | 0 |
| Mode M0 | |||
|---|---|---|---|
| Quadrant | BADHDUFLAG | Total packets | Discarded packets |
| A | 0 | 13922 | 2 |
| B | 0 | 13789 | 1 |
| C | 0 | 12363 | 1 |
| D | 0 | 17003 | 1 |
| Mode M9 | |||
|---|---|---|---|
| Quadrant | BADHDUFLAG | Total packets | Discarded packets |
| A | 0 | 11 | 0 |
| B | 0 | 11 | 0 |
| C | 0 | 11 | 0 |
| D | 0 | 11 | 0 |
| Quadrant | Total seconds | Saturated seconds | Saturation percentage |
|---|---|---|---|
| A | 6061 | 104 | 1.715888% |
| B | 6061 | 135 | 2.227355% |
| C | 6061 | 28 | 0.461970% |
| D | 6061 | 133 | 2.194357% |
Noise dominated data is calculated using 1-second bins in cleaned event files. If a bin has >2000 counts, and if more than 50% of those come from <1% of pixels, then it is considered to be noise-dominated and hence unusable.
| Quadrant | # 1 sec bins | Bins with >0 counts | Bins with >2000 counts | High rate bins dominated by noise | Noise dominated (total time) | Noise dominated (detector-on time) | Marked lightcurve |
|---|---|---|---|---|---|---|---|
| A | 7246 | 6061 | 26 | 26 | 0.36% | 0.43% | 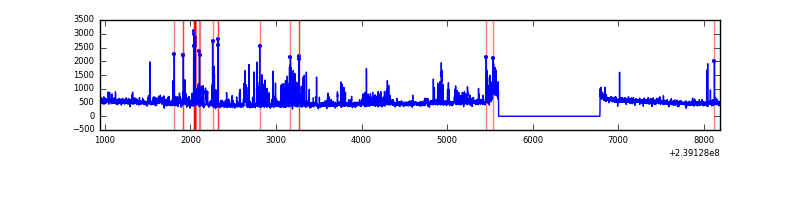 |
| B | 7246 | 6061 | 58 | 58 | 0.80% | 0.96% | 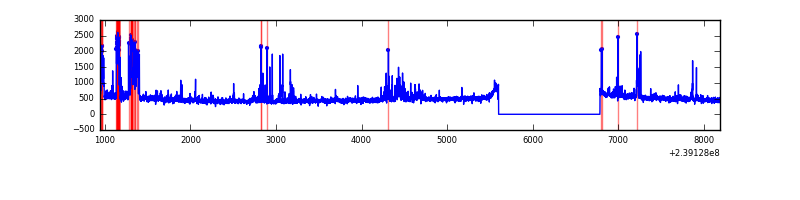 |
| C | 7246 | 6061 | 0 | 0 | 0.00% | 0.00% | 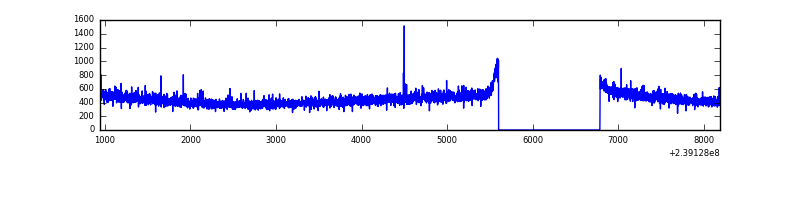 |
| D | 7246 | 6061 | 110 | 110 | 1.52% | 1.81% | 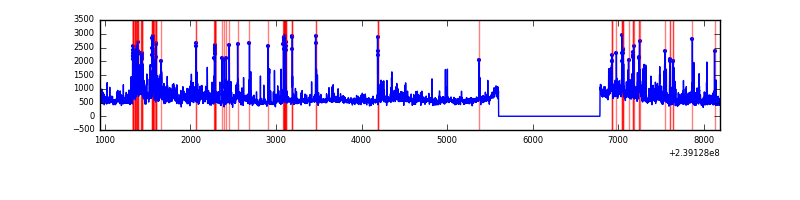 |
Top three noisy pixels from each quadrant. If the there are fewer than three noisy pixels in the level2.evt file, extra rows are filled as -1
| Pixel properties | Quadrant properties | ||||||
|---|---|---|---|---|---|---|---|
| Quadrant | DetID | PixID | Counts | Sigma | Mean | Median | Sigma |
| A | 15 | 239 | 522827 | 3550.46 | 718 | 704 | 147.1 |
| A | 8 | 15 | 18287 | 119.57 | 718 | 704 | 147.1 |
| A | 15 | 174 | 13293 | 85.61 | 718 | 704 | 147.1 |
| B | 4 | 81 | 366013 | 2663.07 | 721 | 705 | 137.2 |
| B | 4 | 239 | 43766 | 313.91 | 721 | 705 | 137.2 |
| B | 0 | 219 | 28511 | 202.7 | 721 | 705 | 137.2 |
| C | 7 | 247 | 6858 | 38.41 | 690 | 693 | 160.5 |
| C | 12 | 4 | 5440 | 29.57 | 690 | 693 | 160.5 |
| C | 13 | 61 | 5294 | 28.66 | 690 | 693 | 160.5 |
| D | 8 | 195 | 541820 | 3009.04 | 678 | 661 | 179.8 |
| D | 2 | 16 | 362142 | 2009.97 | 678 | 661 | 179.8 |
| D | 12 | 233 | 289740 | 1607.38 | 678 | 661 | 179.8 |
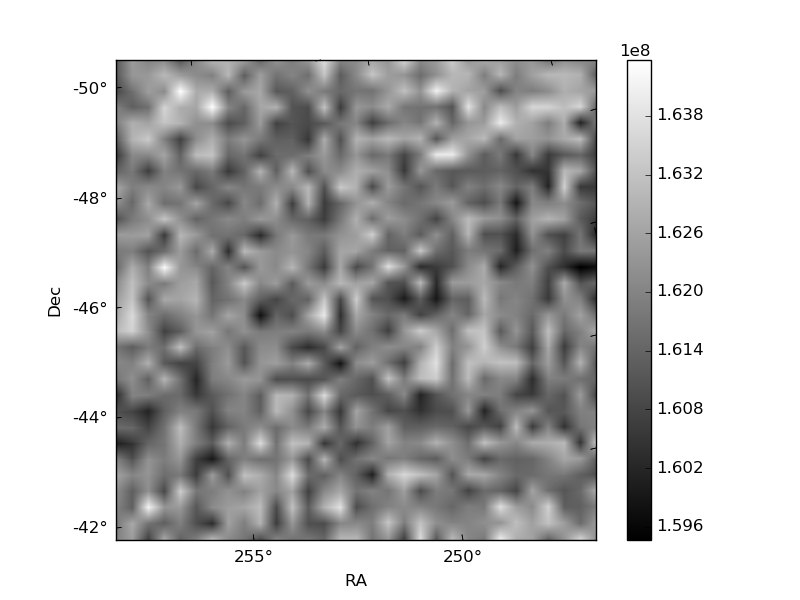
Histogram calculated using DETX and DETY for each event in the final _common_clean file
| Quadrant A | 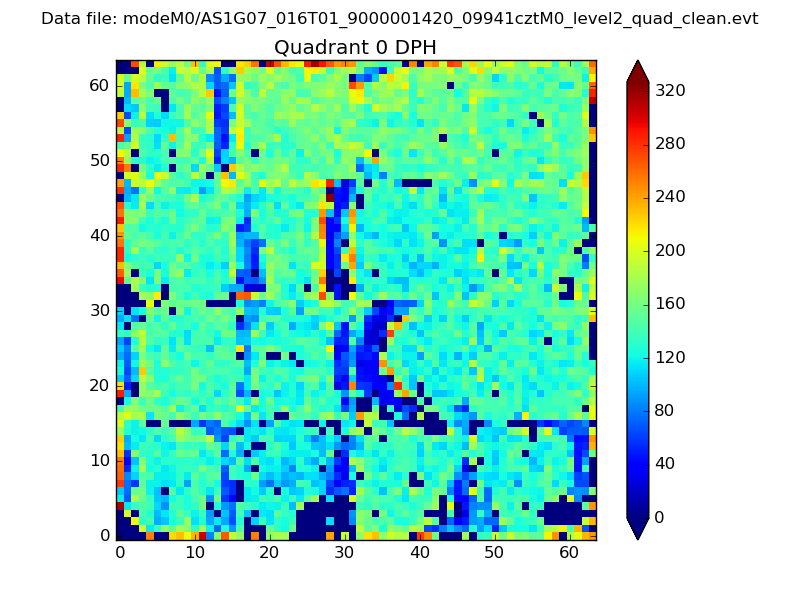 |
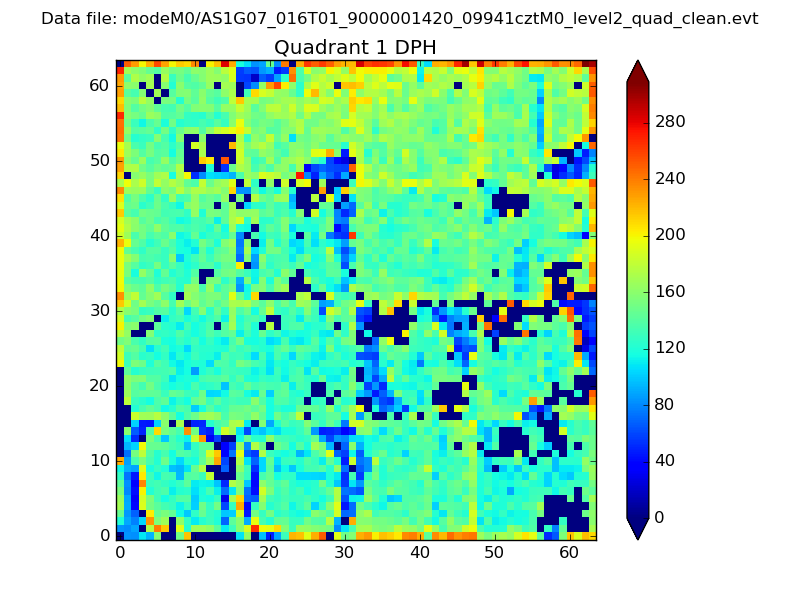 |
Quadrant B |
|---|---|---|---|
| Quadrant D | 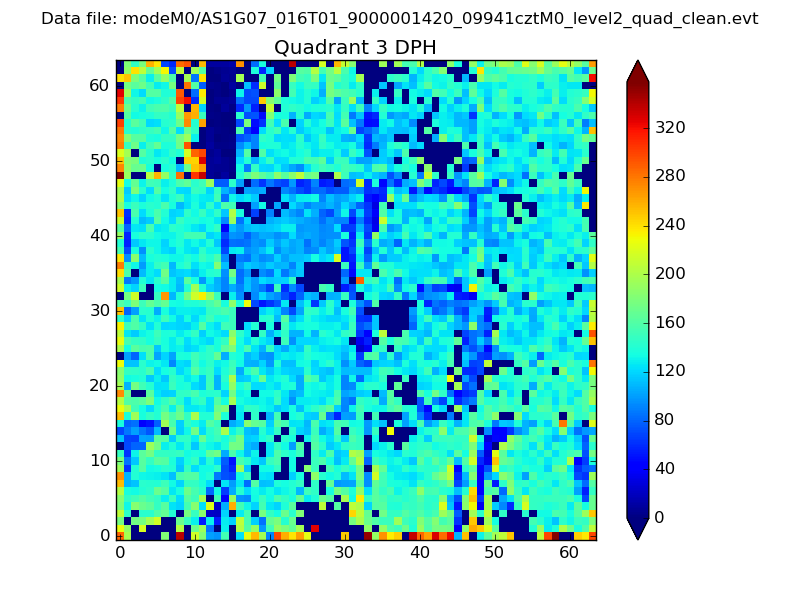 |
 |
Quadrant C |
| Plot type | Count rate plots | Images |
|---|---|---|
| Comparison with Poisson distribution Blue bars denote a histogram of data divided into 1 sec bins. Red curve is a Poisson curve with rate = median count rate of data. |
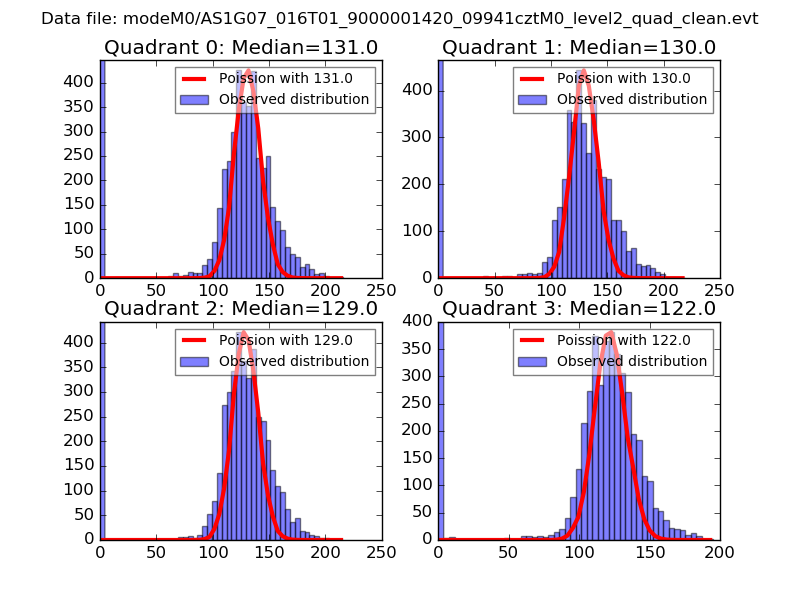 |
 |
| Quadrant-wise count rates Data is divided into 100 sec bins |
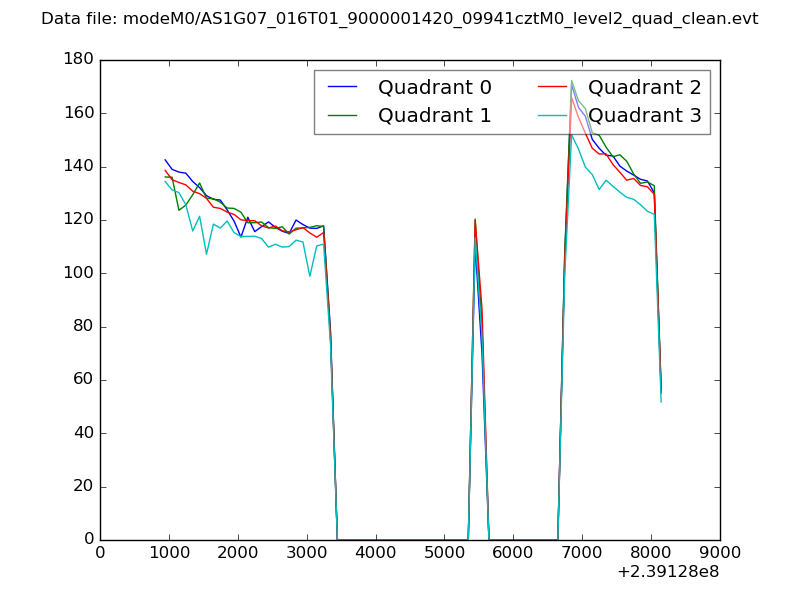 |
|
| Module-wise count rates for Quadrant A Data is divided into 100 sec bins |
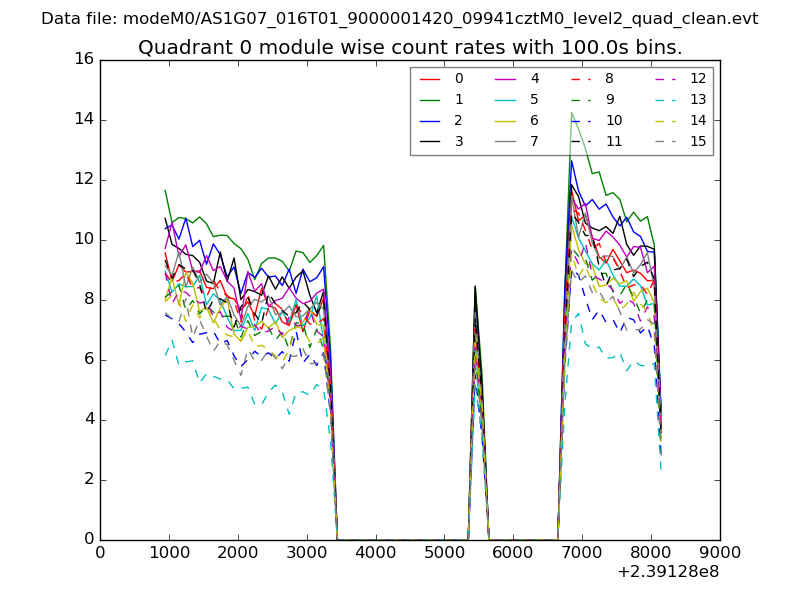 |
 |
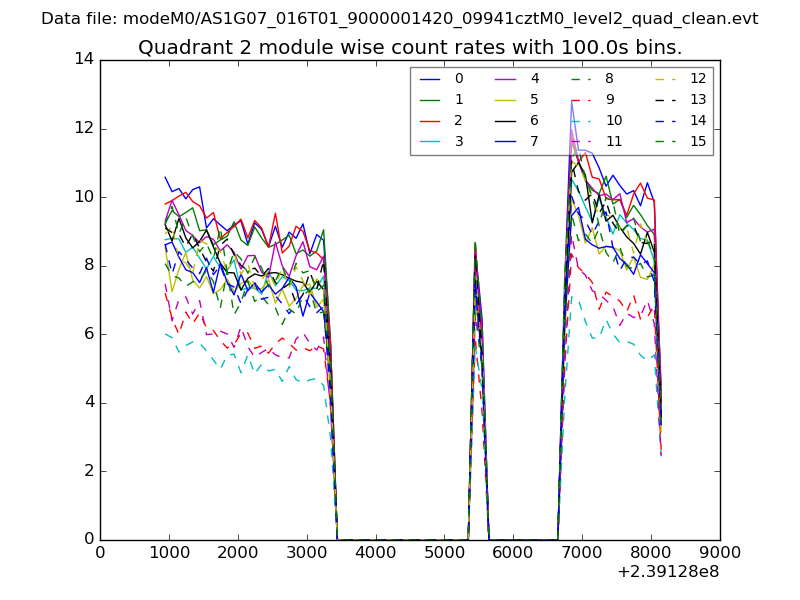
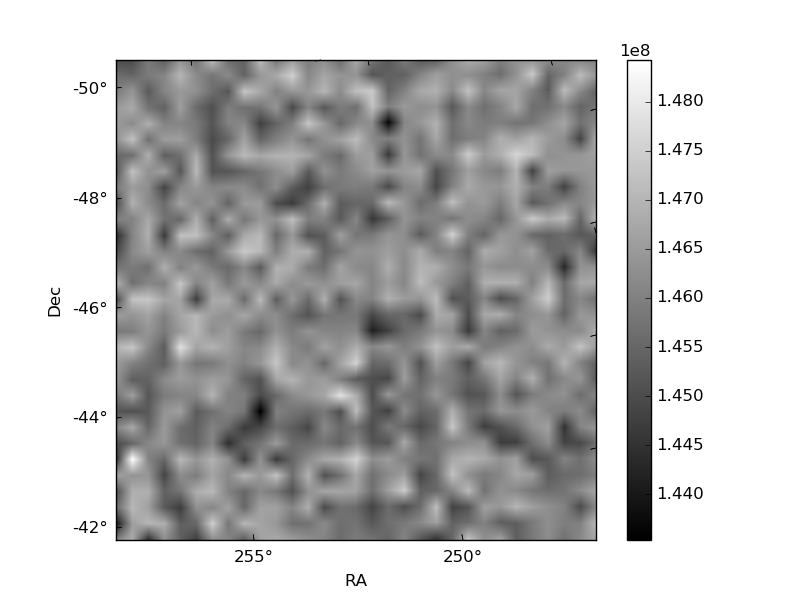
| Module-wise count rates for Quadrant B Data is divided into 100 sec bins |
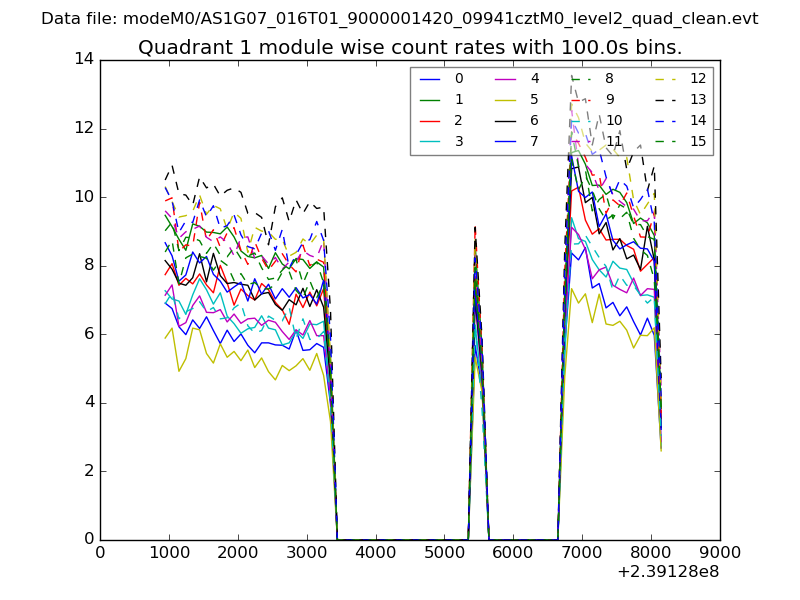 |
 |
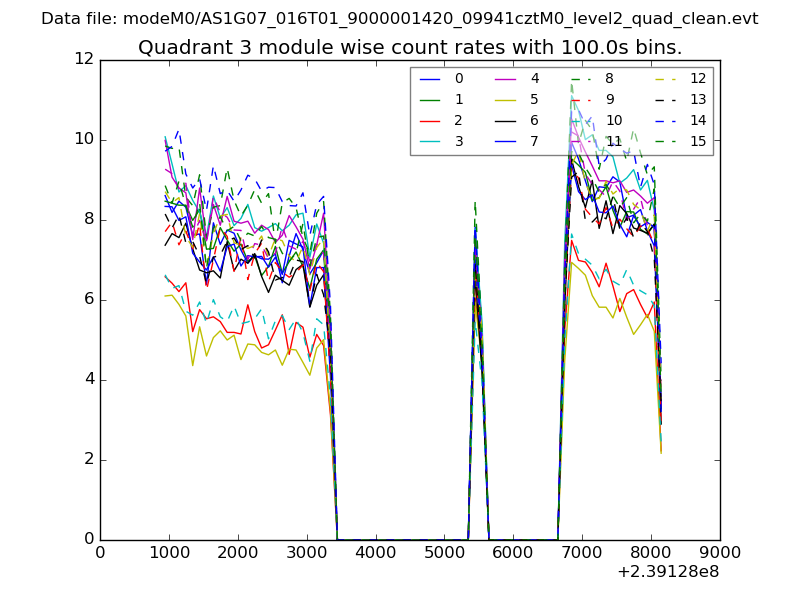
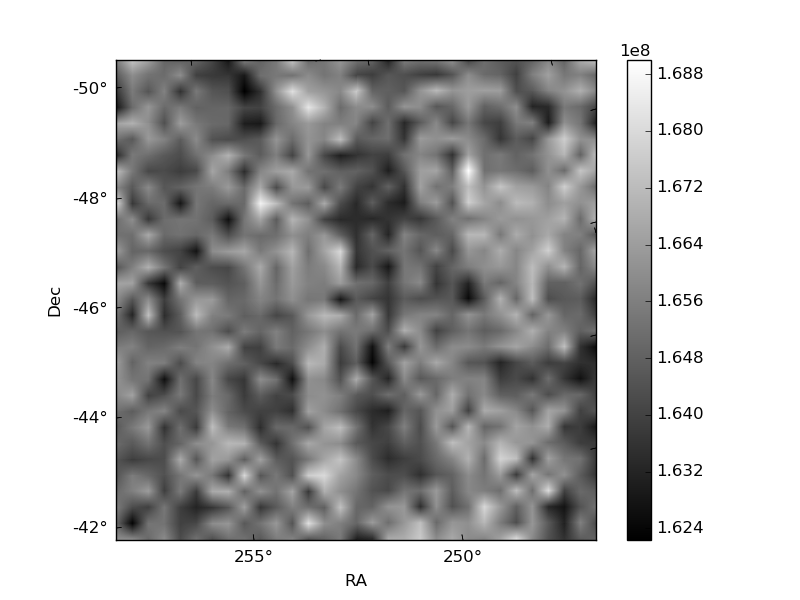
| Module-wise count rates for Quadrant C Data is divided into 100 sec bins |
 |
 |
| Module-wise count rates for Quadrant D Data is divided into 100 sec bins |
 |
 |
| Parameter | Plot |
|---|---|
| CZT HV Monitor | 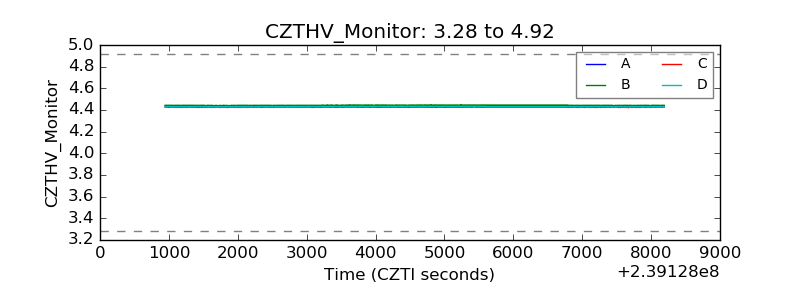 |
| D_VDD | 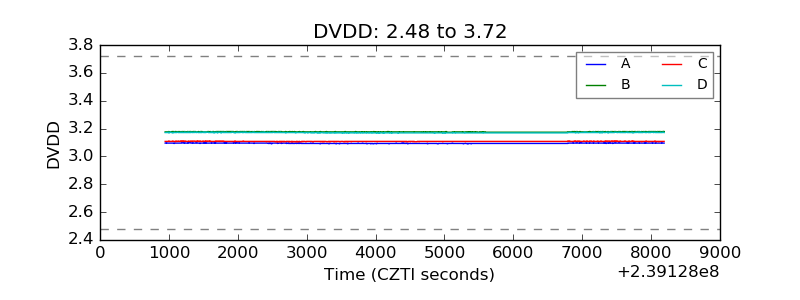 |
| Temperature 1 | 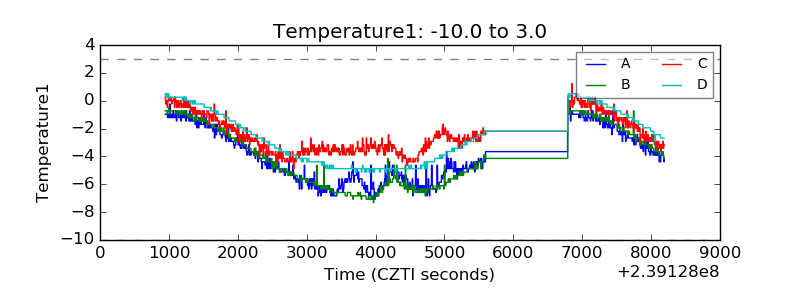 |
| Veto HV Monitor | 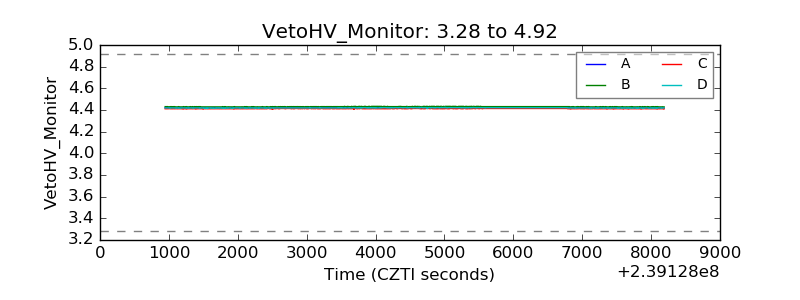 |
| Veto LLD | 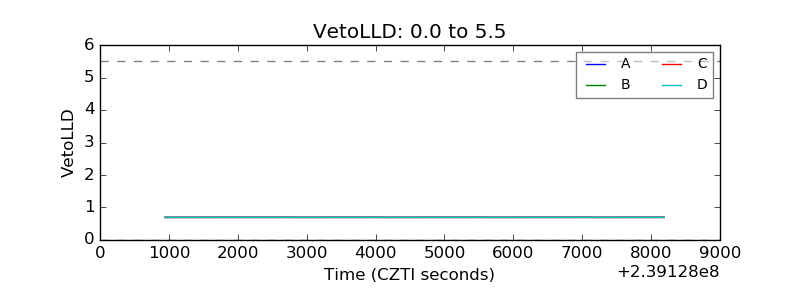 |
| Alpha Counter | 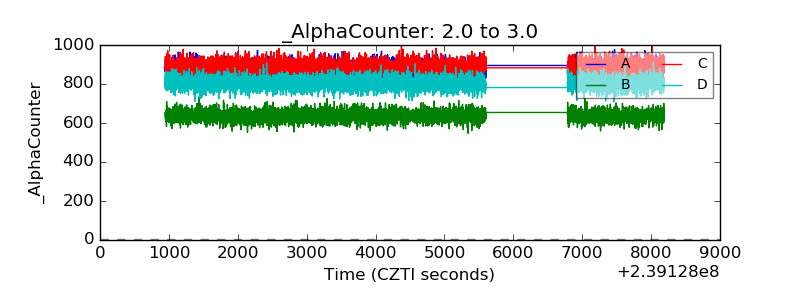 |
| _CPM_Rate | 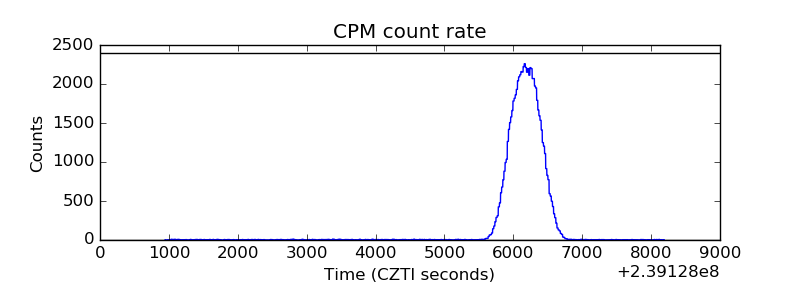 |
| CZT Counter | 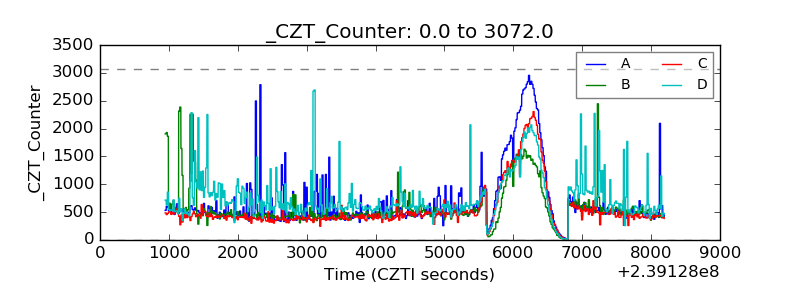 |
| +2.5 Volts monitor |  |
| +5 Volts monitor |  |
| _ROLL_ROT | 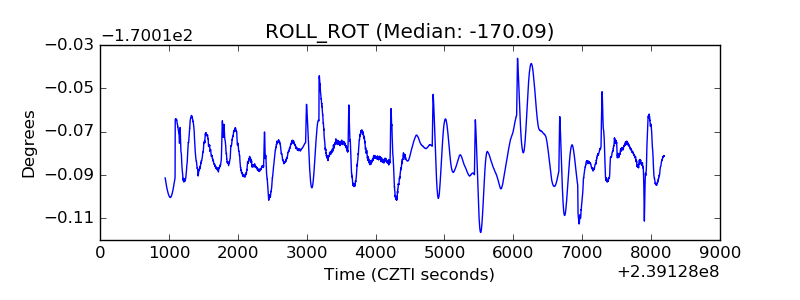 |
| _Roll_DEC | 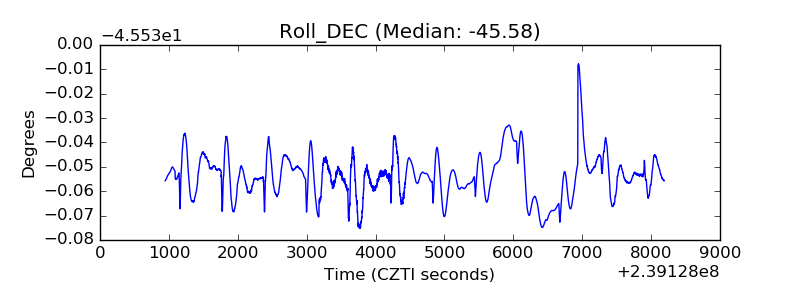 |
| _Roll_RA |  |
| Veto Counter | 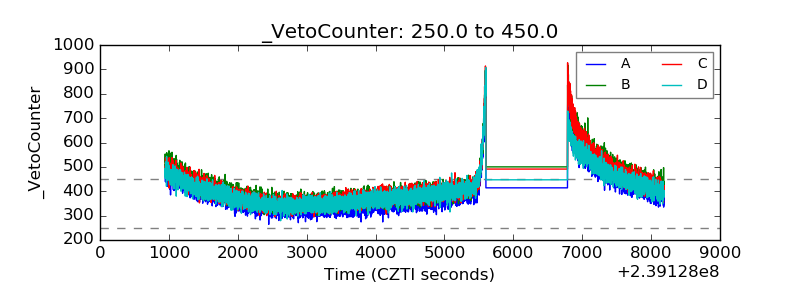 |