| Param | Original file | Final file |
|---|---|---|
| Filename | modeM0/AS1G07_016T01_9000001420_09942cztM0_level2.evt | modeM0/AS1G07_016T01_9000001420_09942cztM0_level2_quad_clean.evt |
| Size (bytes) | 434,908,800 | 84,545,280 |
| Size | 414.8 MB | 80.6 MB |
| Events in quadrant A | 2,927,726 | 548,967 |
| Events in quadrant B | 3,068,763 | 555,121 |
| Events in quadrant C | 2,726,117 | 547,634 |
| Events in quadrant D | 4,047,250 | 496,063 |
| Mode SS | |||
|---|---|---|---|
| Quadrant | BADHDUFLAG | Total packets | Discarded packets |
| A | 0 | 128 | 6 |
| B | 0 | 128 | 2 |
| C | 0 | 128 | 6 |
| D | 0 | 128 | 6 |
| Mode M0 | |||
|---|---|---|---|
| Quadrant | BADHDUFLAG | Total packets | Discarded packets |
| A | 0 | 13358 | 840 |
| B | 0 | 13762 | 816 |
| C | 0 | 12830 | 681 |
| D | 0 | 17201 | 1269 |
| Mode M9 | |||
|---|---|---|---|
| Quadrant | BADHDUFLAG | Total packets | Discarded packets |
| A | 0 | 17 | 0 |
| B | 0 | 17 | 1 |
| C | 0 | 17 | 1 |
| D | 0 | 18 | 0 |
| Quadrant | Total seconds | Saturated seconds | Saturation percentage |
|---|---|---|---|
| A | 5889 | 40 | 0.679232% |
| B | 5905 | 68 | 1.151566% |
| C | 5925 | 29 | 0.489451% |
| D | 5829 | 150 | 2.573340% |
Noise dominated data is calculated using 1-second bins in cleaned event files. If a bin has >2000 counts, and if more than 50% of those come from <1% of pixels, then it is considered to be noise-dominated and hence unusable.
| Quadrant | # 1 sec bins | Bins with >0 counts | Bins with >2000 counts | High rate bins dominated by noise | Noise dominated (total time) | Noise dominated (detector-on time) | Marked lightcurve |
|---|---|---|---|---|---|---|---|
| A | 7515 | 6164 | 4 | 4 | 0.05% | 0.06% | 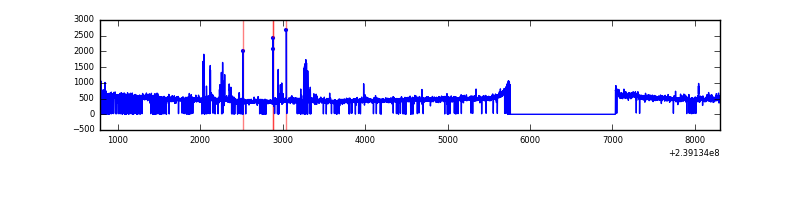 |
| B | 7518 | 6170 | 8 | 8 | 0.11% | 0.13% | 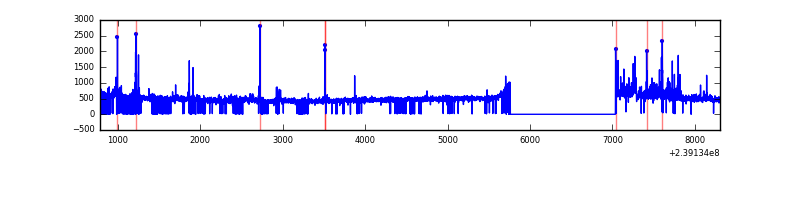 |
| C | 7515 | 6186 | 0 | 0 | 0.00% | 0.00% | 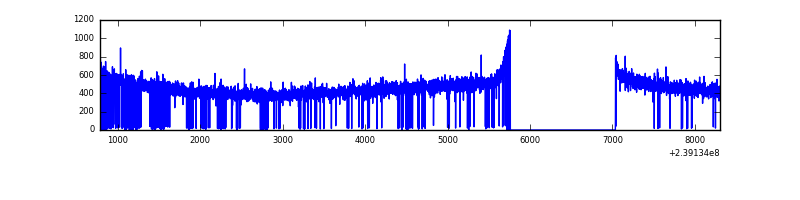 |
| D | 7518 | 6157 | 139 | 139 | 1.85% | 2.26% | 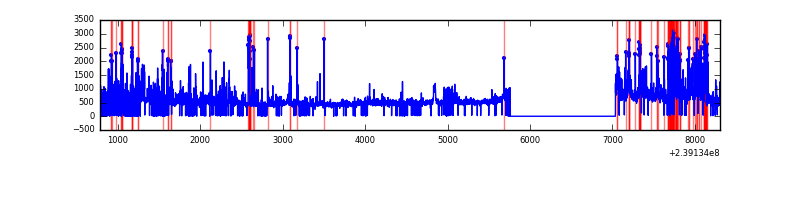 |
Top three noisy pixels from each quadrant. If the there are fewer than three noisy pixels in the level2.evt file, extra rows are filled as -1
| Pixel properties | Quadrant properties | ||||||
|---|---|---|---|---|---|---|---|
| Quadrant | DetID | PixID | Counts | Sigma | Mean | Median | Sigma |
| A | 15 | 174 | 67330 | 455.69 | 721 | 708 | 146.2 |
| A | 8 | 15 | 50113 | 337.93 | 721 | 708 | 146.2 |
| A | 15 | 239 | 23618 | 156.7 | 721 | 708 | 146.2 |
| B | 4 | 239 | 63258 | 452.52 | 728 | 711 | 138.2 |
| B | 6 | 51 | 47903 | 341.43 | 728 | 711 | 138.2 |
| B | 4 | 81 | 36157 | 256.45 | 728 | 711 | 138.2 |
| C | 13 | 61 | 5439 | 29.49 | 696 | 701 | 160.7 |
| C | 10 | 22 | 3818 | 19.4 | 696 | 701 | 160.7 |
| C | 8 | 222 | 2869 | 13.49 | 696 | 701 | 160.7 |
| D | 2 | 16 | 432975 | 2426.17 | 672 | 653 | 178.2 |
| D | 12 | 233 | 350396 | 1962.74 | 672 | 653 | 178.2 |
| D | 8 | 195 | 255299 | 1429.06 | 672 | 653 | 178.2 |
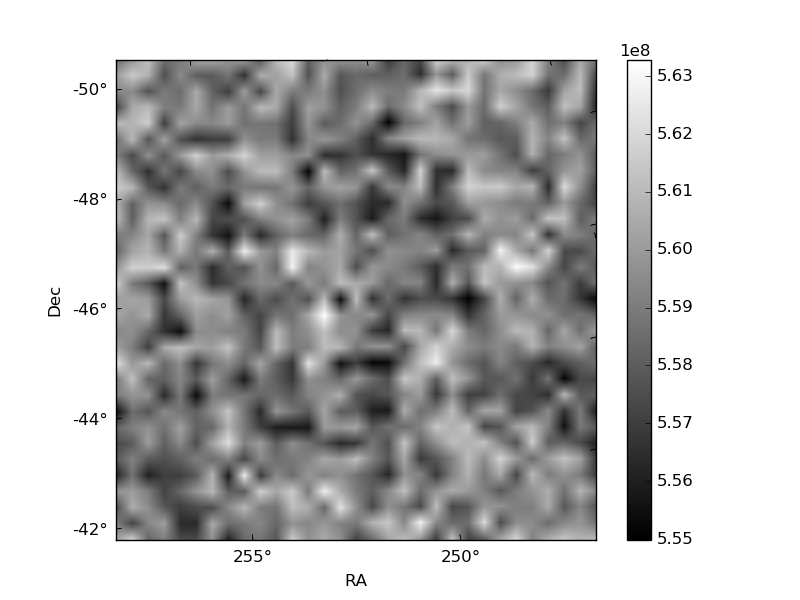
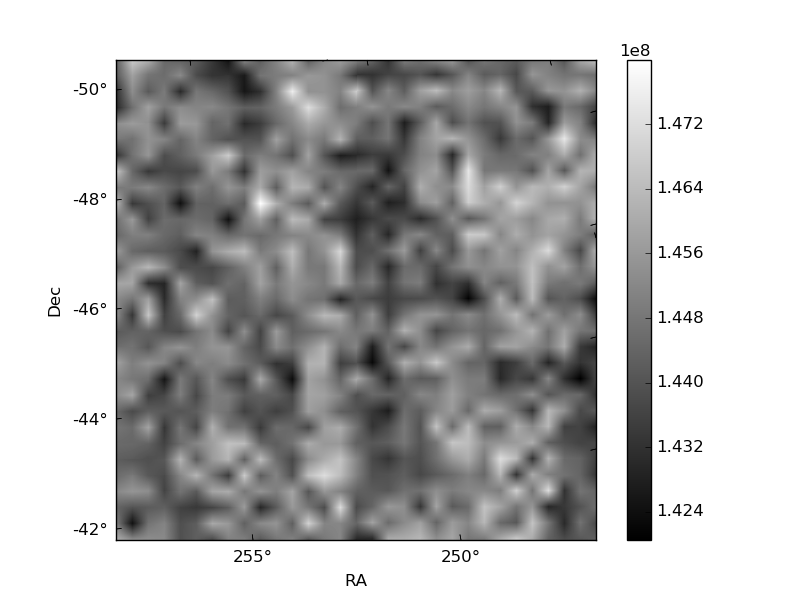
Histogram calculated using DETX and DETY for each event in the final _common_clean file
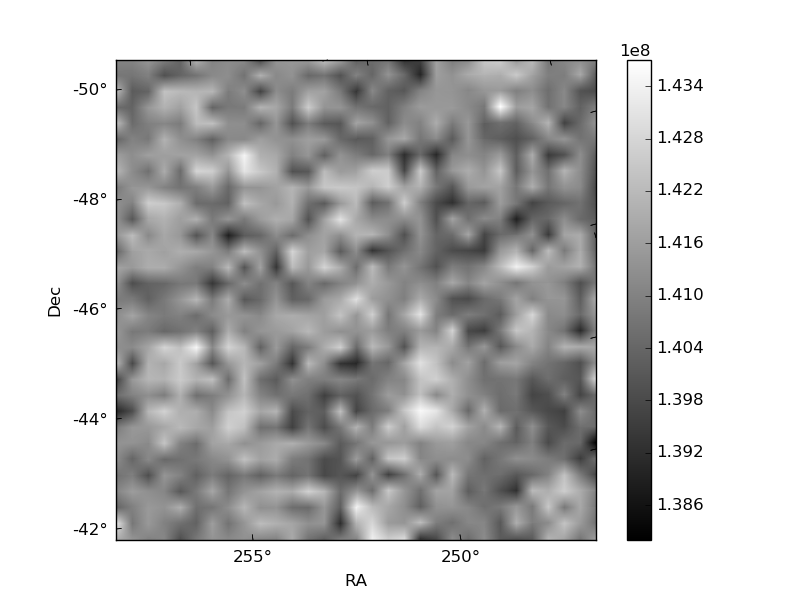
| Quadrant A | 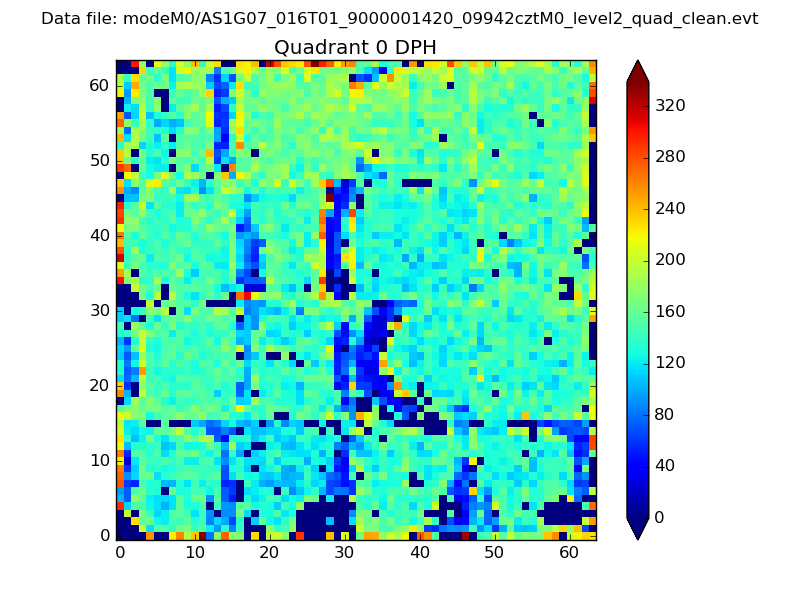 |
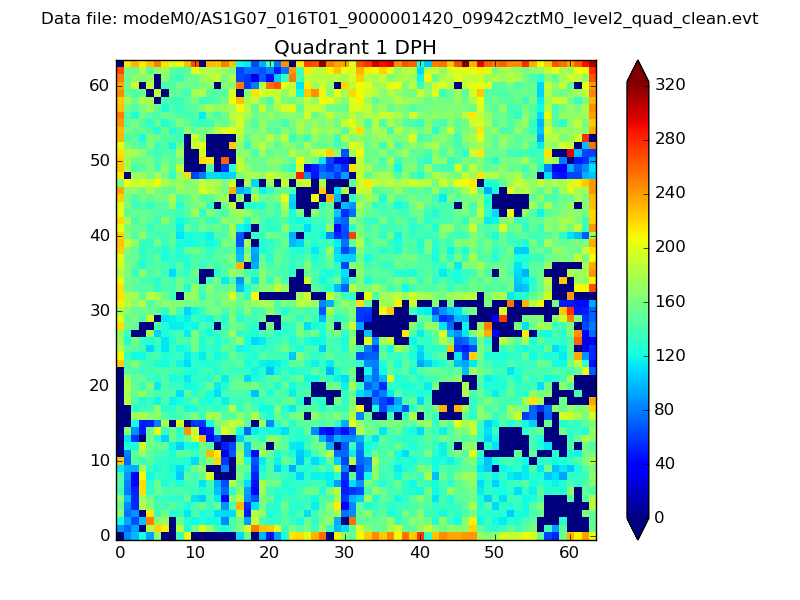 |
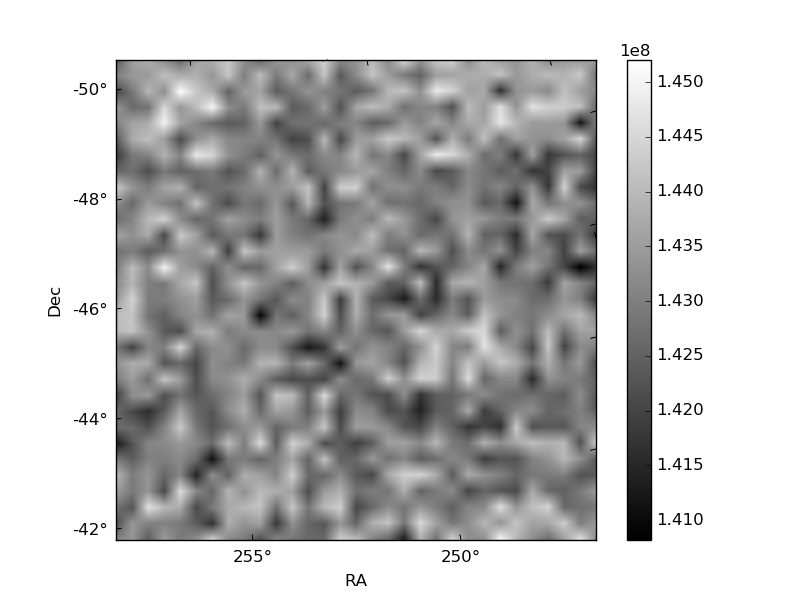
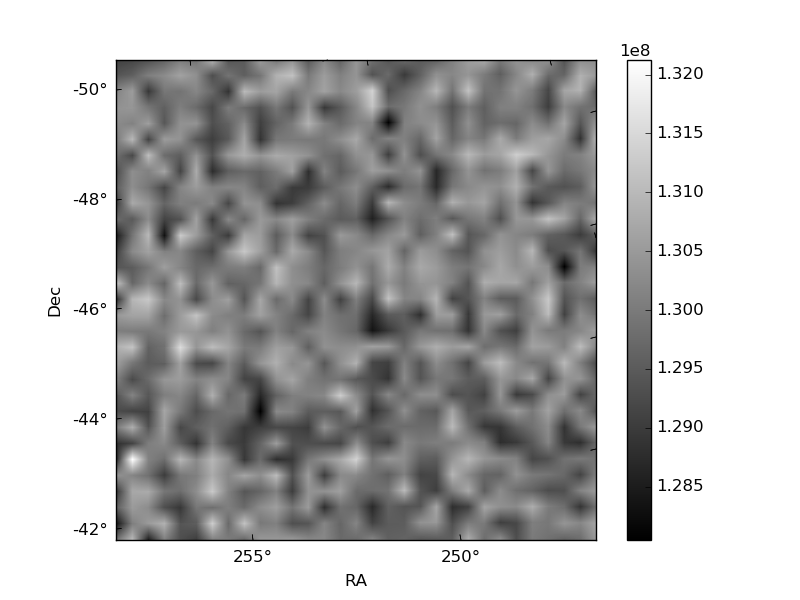
Quadrant B |
|---|---|---|---|
| Quadrant D |  |
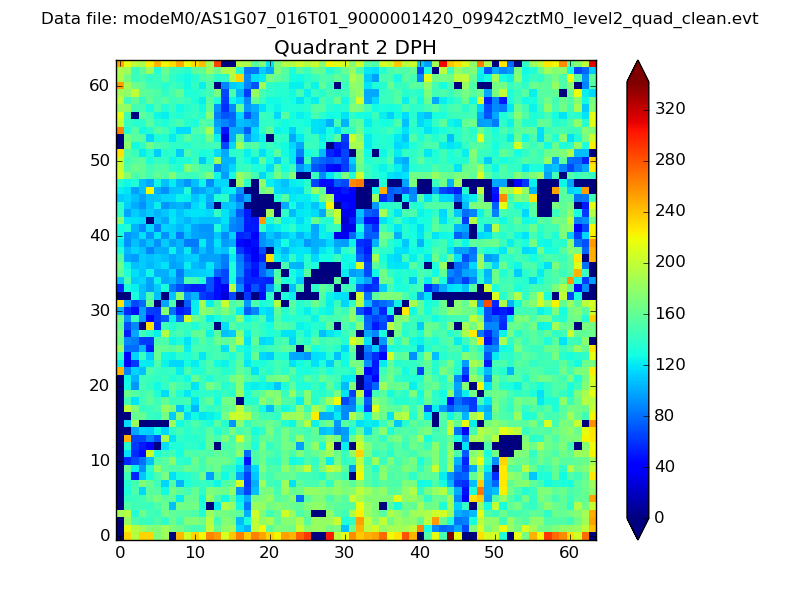 |
Quadrant C |
| Plot type | Count rate plots | Images |
|---|---|---|
| Comparison with Poisson distribution Blue bars denote a histogram of data divided into 1 sec bins. Red curve is a Poisson curve with rate = median count rate of data. |
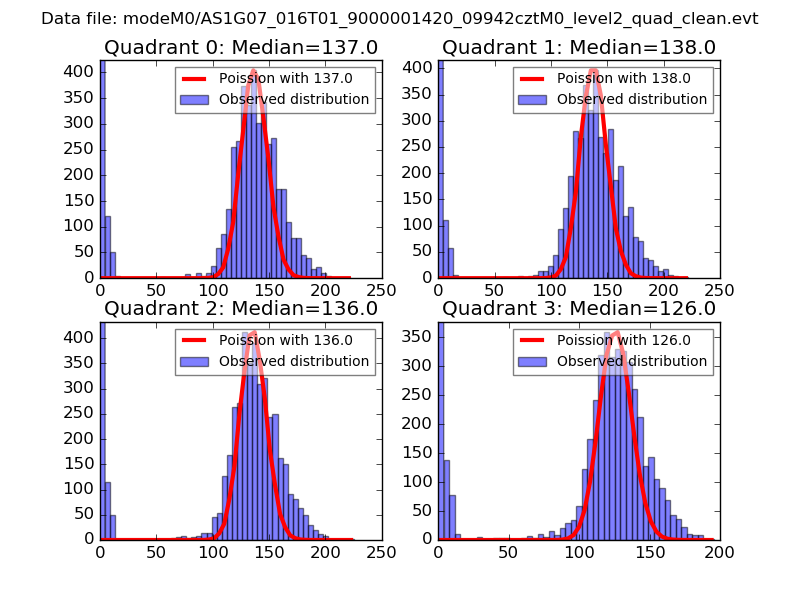 |
 |
| Quadrant-wise count rates Data is divided into 100 sec bins |
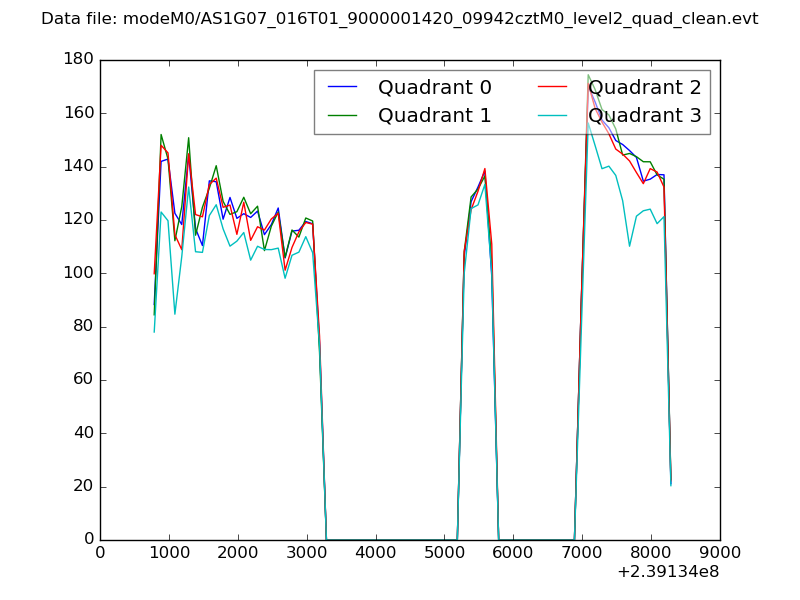 |
|
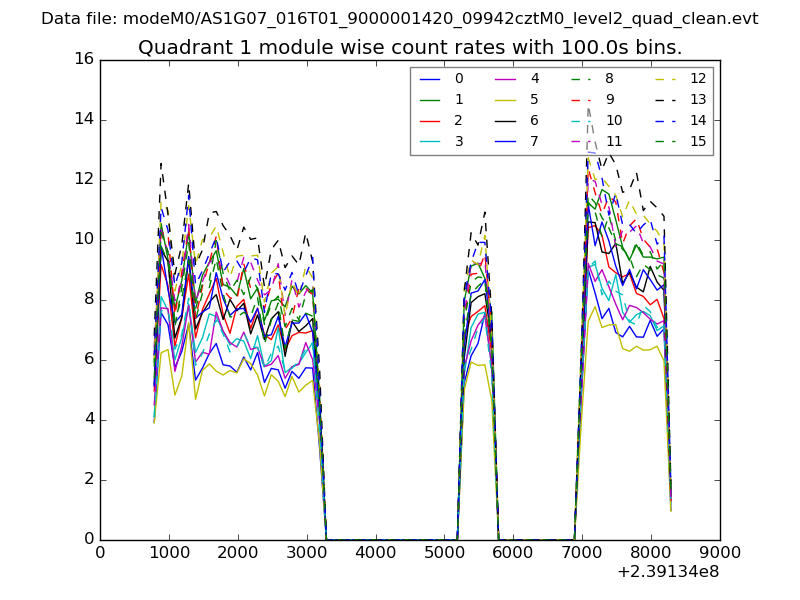
| Module-wise count rates for Quadrant A Data is divided into 100 sec bins |
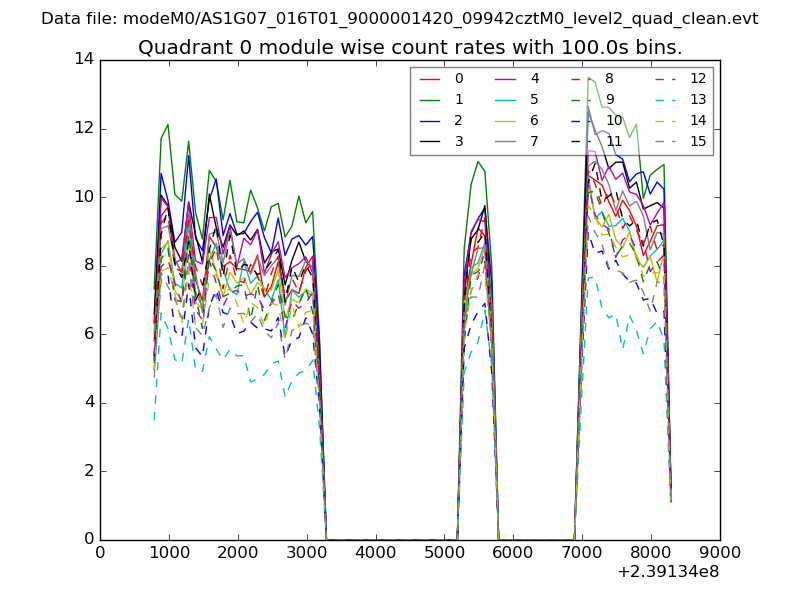 |
 |
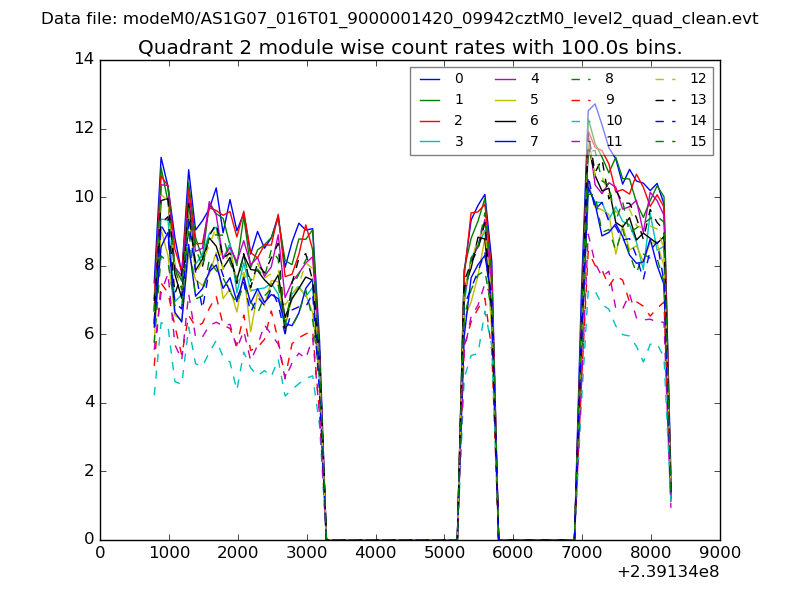
| Module-wise count rates for Quadrant B Data is divided into 100 sec bins |
 |
 |
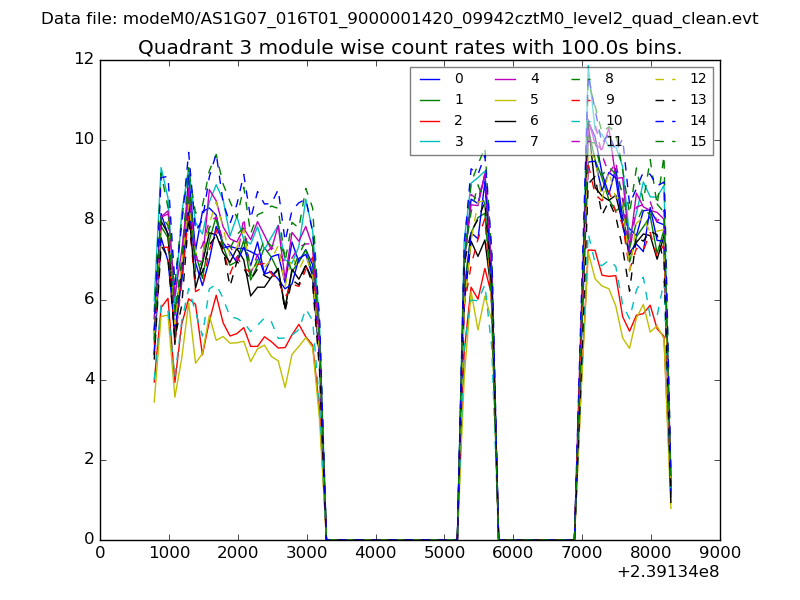
| Module-wise count rates for Quadrant C Data is divided into 100 sec bins |
 |
 |
| Module-wise count rates for Quadrant D Data is divided into 100 sec bins |
 |
 |
| Parameter | Plot |
|---|---|
| CZT HV Monitor | 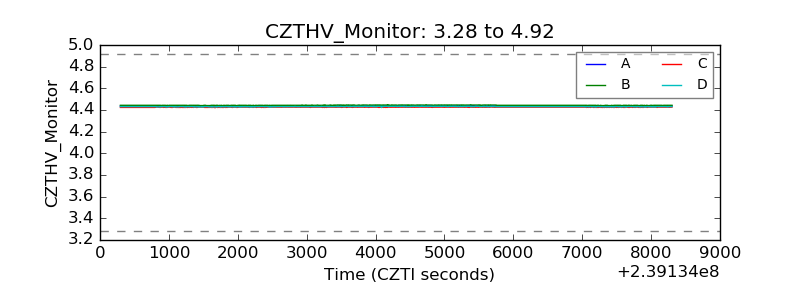 |
| D_VDD | 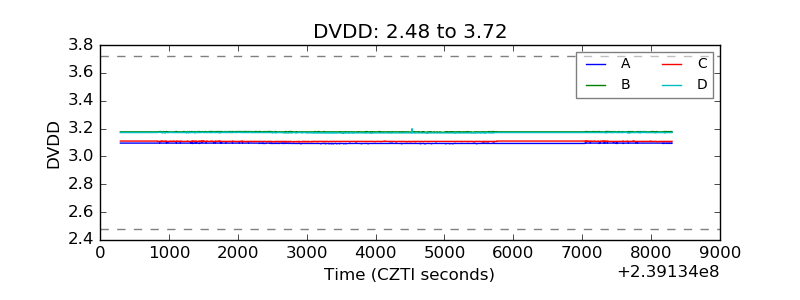 |
| Temperature 1 | 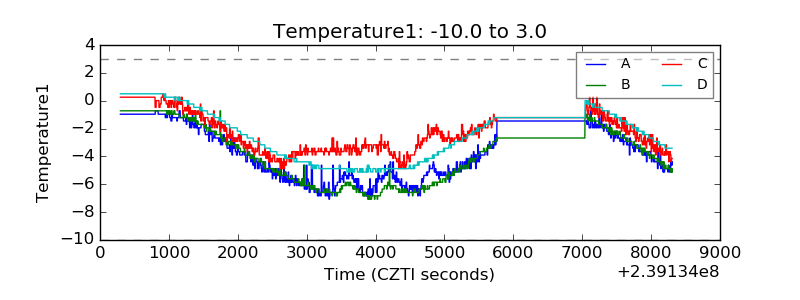 |
| Veto HV Monitor | 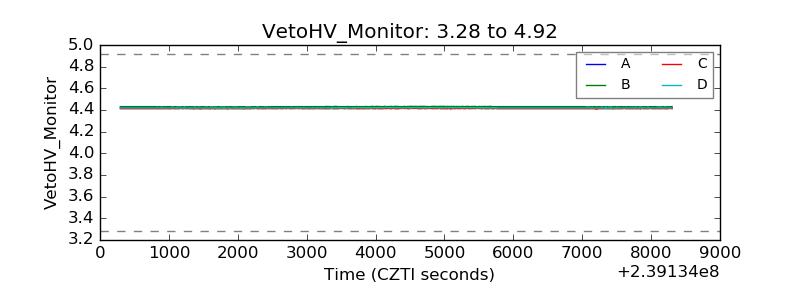 |
| Veto LLD | 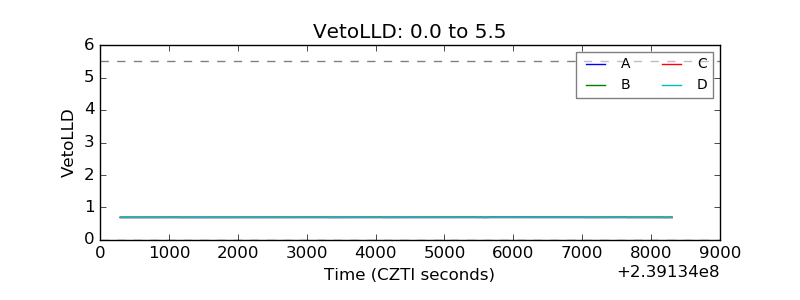 |
| Alpha Counter | 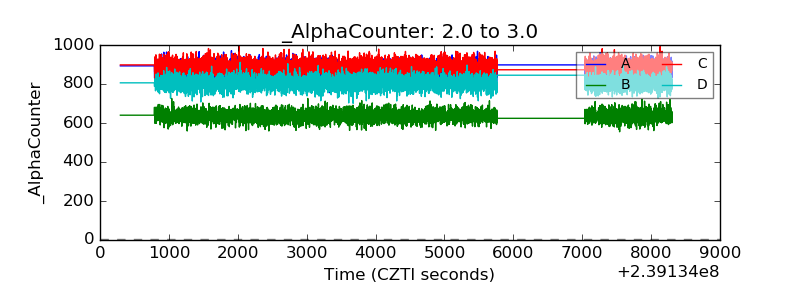 |
| _CPM_Rate | 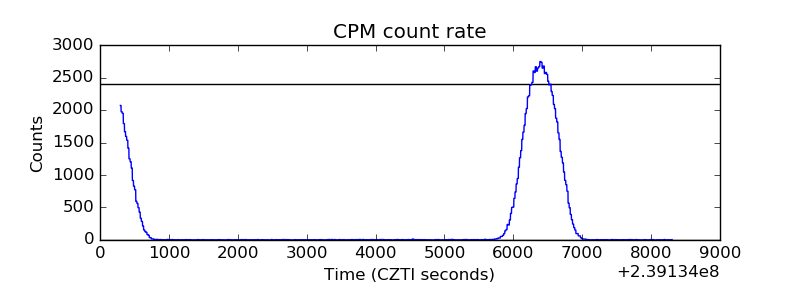 |
| CZT Counter |  |
| +2.5 Volts monitor |  |
| +5 Volts monitor | 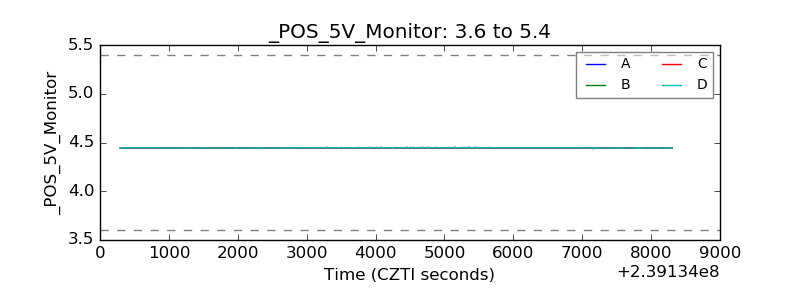 |
| _ROLL_ROT | 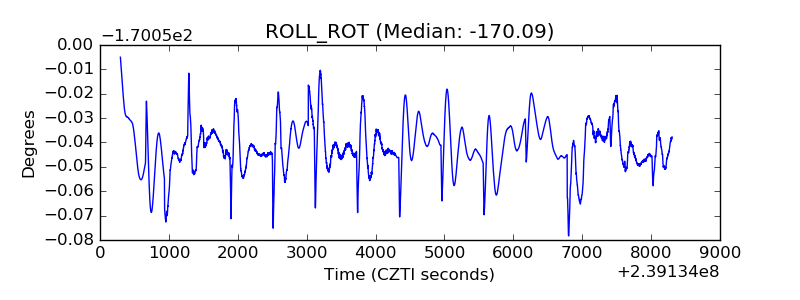 |
| _Roll_DEC | 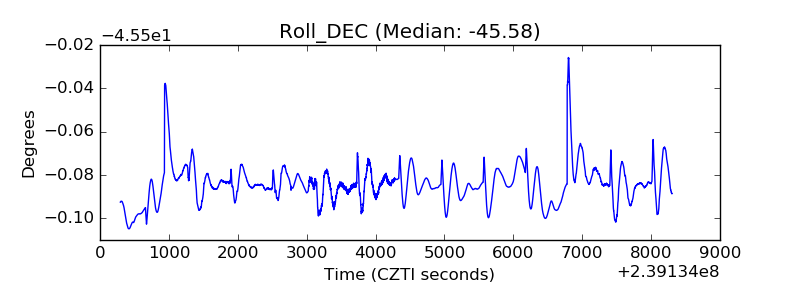 |
| _Roll_RA | 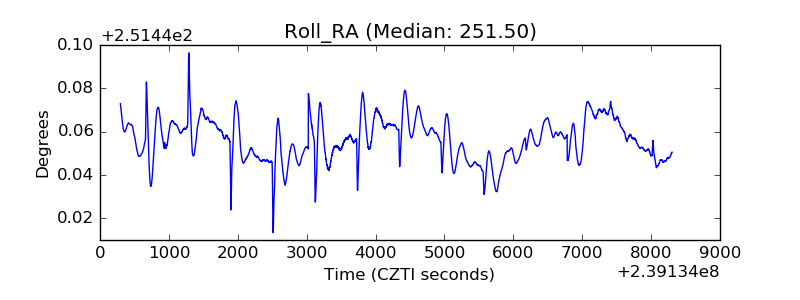 |
| Veto Counter | 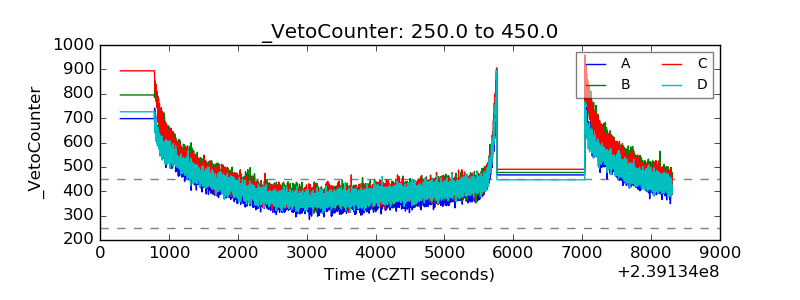 |