| Param | Original file | Final file |
|---|---|---|
| Filename | modeM0/AS1G07_016T01_9000001420_09943cztM0_level2.evt | modeM0/AS1G07_016T01_9000001420_09943cztM0_level2_quad_clean.evt |
| Size (bytes) | 474,560,640 | 88,453,440 |
| Size | 452.6 MB | 84.4 MB |
| Events in quadrant A | 2,949,582 | 574,224 |
| Events in quadrant B | 3,279,158 | 585,473 |
| Events in quadrant C | 2,815,322 | 575,544 |
| Events in quadrant D | 4,914,883 | 518,367 |
| Mode SS | |||
|---|---|---|---|
| Quadrant | BADHDUFLAG | Total packets | Discarded packets |
| A | 0 | 126 | 0 |
| B | 0 | 126 | 0 |
| C | 0 | 126 | 0 |
| D | 0 | 126 | 0 |
| Mode M0 | |||
|---|---|---|---|
| Quadrant | BADHDUFLAG | Total packets | Discarded packets |
| A | 0 | 12770 | 9 |
| B | 0 | 13688 | 30 |
| C | 0 | 12466 | 14 |
| D | 0 | 18717 | 28 |
| Mode M9 | |||
|---|---|---|---|
| Quadrant | BADHDUFLAG | Total packets | Discarded packets |
| A | 0 | 15 | 0 |
| B | 0 | 15 | 0 |
| C | 0 | 15 | 0 |
| D | 0 | 16 | 0 |
| Quadrant | Total seconds | Saturated seconds | Saturation percentage |
|---|---|---|---|
| A | 6083 | 10 | 0.164393% |
| B | 6077 | 47 | 0.773408% |
| C | 6080 | 9 | 0.148026% |
| D | 6079 | 319 | 5.247574% |
Noise dominated data is calculated using 1-second bins in cleaned event files. If a bin has >2000 counts, and if more than 50% of those come from <1% of pixels, then it is considered to be noise-dominated and hence unusable.
| Quadrant | # 1 sec bins | Bins with >0 counts | Bins with >2000 counts | High rate bins dominated by noise | Noise dominated (total time) | Noise dominated (detector-on time) | Marked lightcurve |
|---|---|---|---|---|---|---|---|
| A | 7481 | 6087 | 2 | 2 | 0.03% | 0.03% | 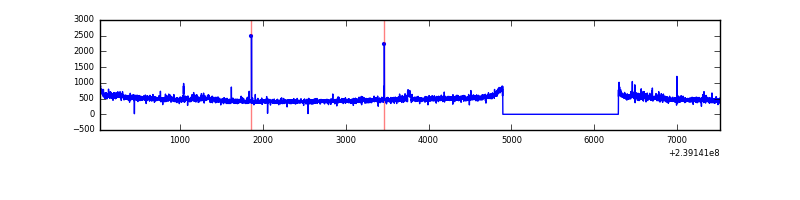 |
| B | 7481 | 6086 | 16 | 16 | 0.21% | 0.26% | 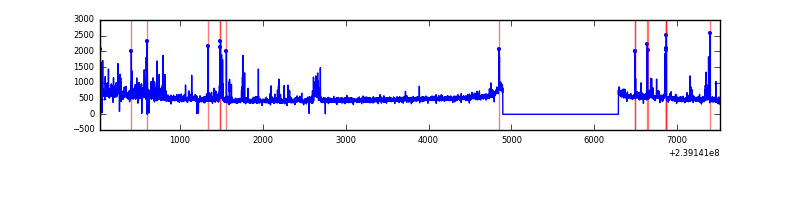 |
| C | 7481 | 6087 | 0 | 0 | 0.00% | 0.00% | 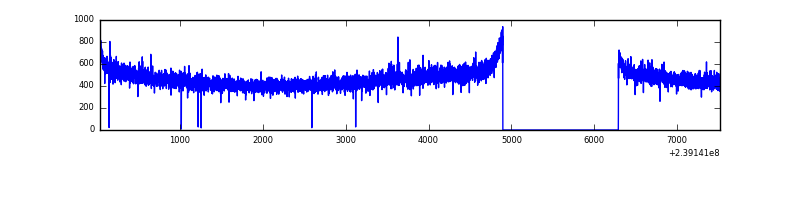 |
| D | 7481 | 6086 | 367 | 367 | 4.91% | 6.03% | 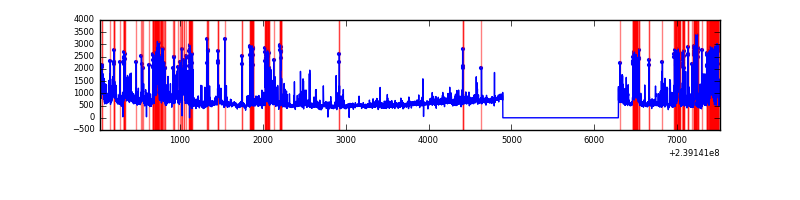 |
Top three noisy pixels from each quadrant. If the there are fewer than three noisy pixels in the level2.evt file, extra rows are filled as -1
| Pixel properties | Quadrant properties | ||||||
|---|---|---|---|---|---|---|---|
| Quadrant | DetID | PixID | Counts | Sigma | Mean | Median | Sigma |
| A | 8 | 15 | 52454 | 342.01 | 745 | 733 | 151.2 |
| A | 15 | 174 | 11713 | 72.61 | 745 | 733 | 151.2 |
| A | 9 | 110 | 9450 | 57.64 | 745 | 733 | 151.2 |
| B | 4 | 239 | 123610 | 859.59 | 753 | 735 | 142.9 |
| B | 6 | 51 | 86381 | 599.15 | 753 | 735 | 142.9 |
| B | 4 | 81 | 32432 | 221.74 | 753 | 735 | 142.9 |
| C | 13 | 61 | 5610 | 29.53 | 720 | 725 | 165.4 |
| C | 12 | 4 | 4118 | 20.51 | 720 | 725 | 165.4 |
| C | 14 | 67 | 2903 | 13.16 | 720 | 725 | 165.4 |
| D | 12 | 233 | 815573 | 4523.25 | 692 | 674 | 180.2 |
| D | 8 | 195 | 488919 | 2710.1 | 692 | 674 | 180.2 |
| D | 2 | 16 | 455858 | 2526.58 | 692 | 674 | 180.2 |
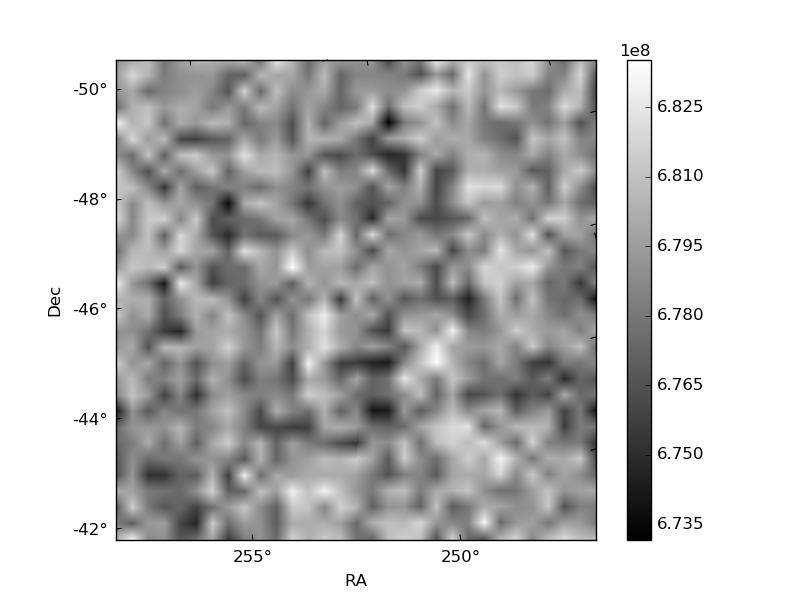
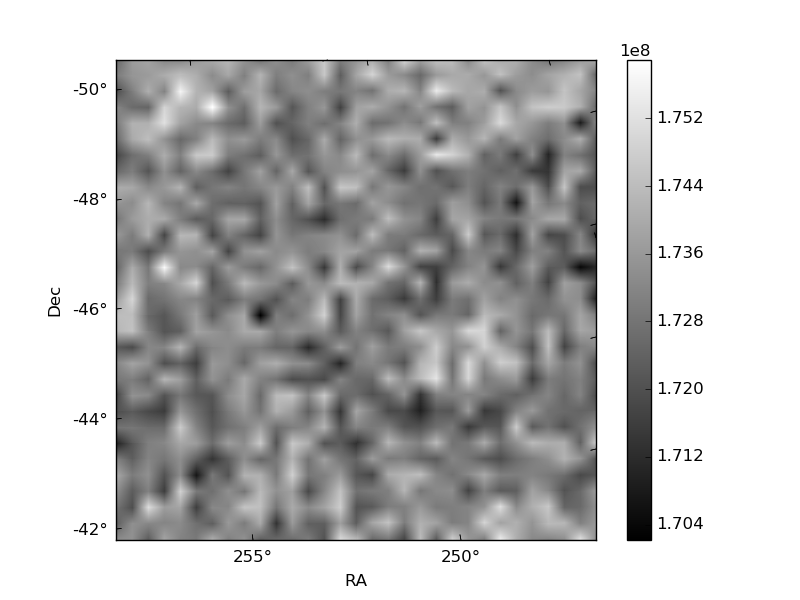
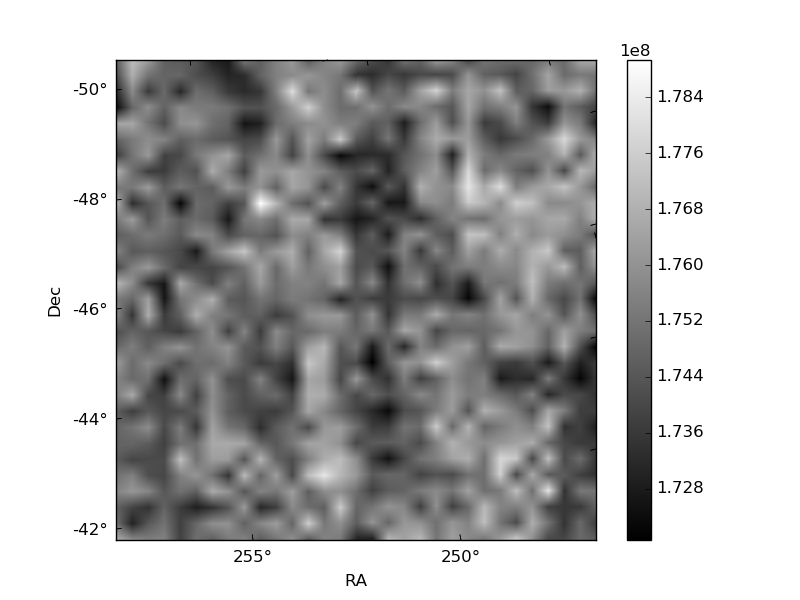
Histogram calculated using DETX and DETY for each event in the final _common_clean file
| Quadrant A | 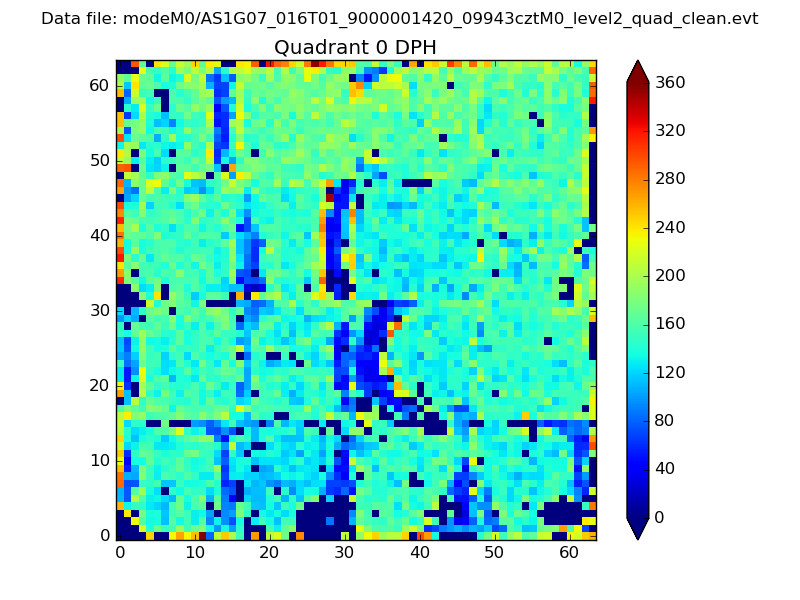 |
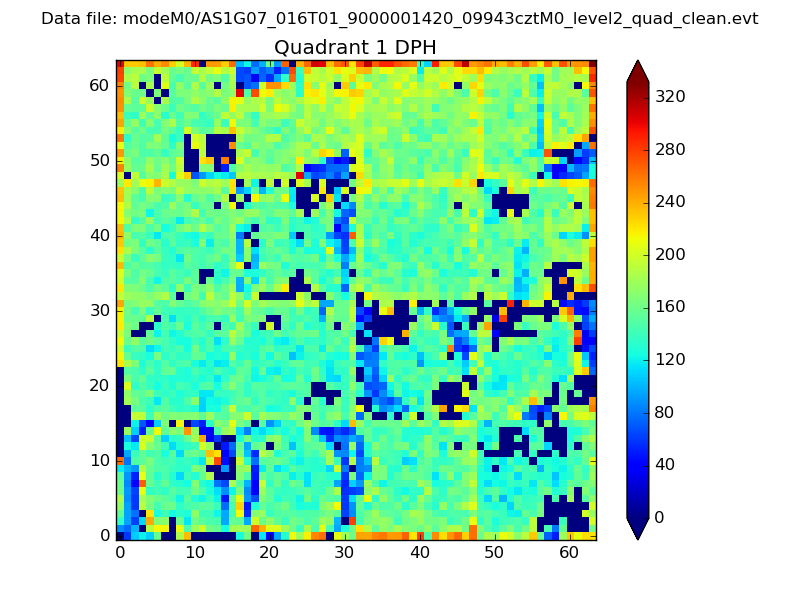 |
Quadrant B |
|---|---|---|---|
| Quadrant D | 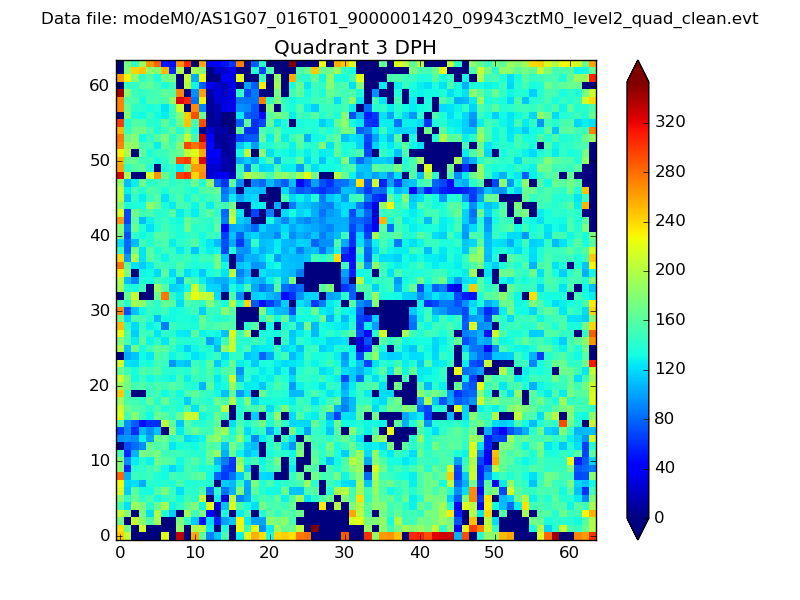 |
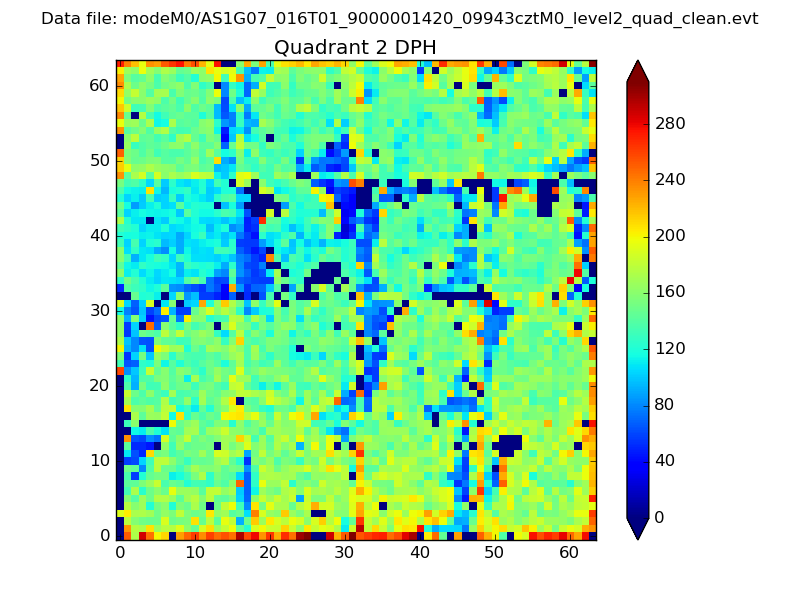 |
Quadrant C |
| Plot type | Count rate plots | Images |
|---|---|---|
| Comparison with Poisson distribution Blue bars denote a histogram of data divided into 1 sec bins. Red curve is a Poisson curve with rate = median count rate of data. |
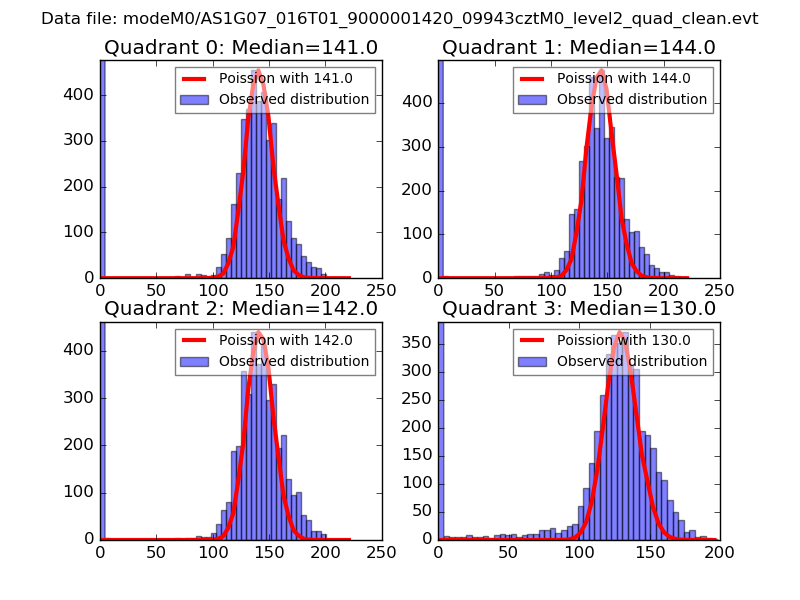 |
 |
| Quadrant-wise count rates Data is divided into 100 sec bins |
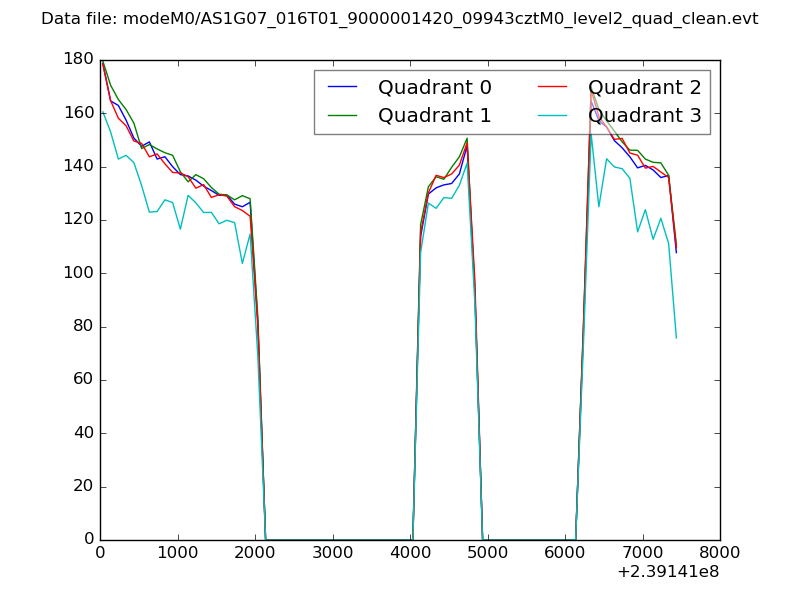 |
|
| Module-wise count rates for Quadrant A Data is divided into 100 sec bins |
 |
 |
| Module-wise count rates for Quadrant B Data is divided into 100 sec bins |
 |
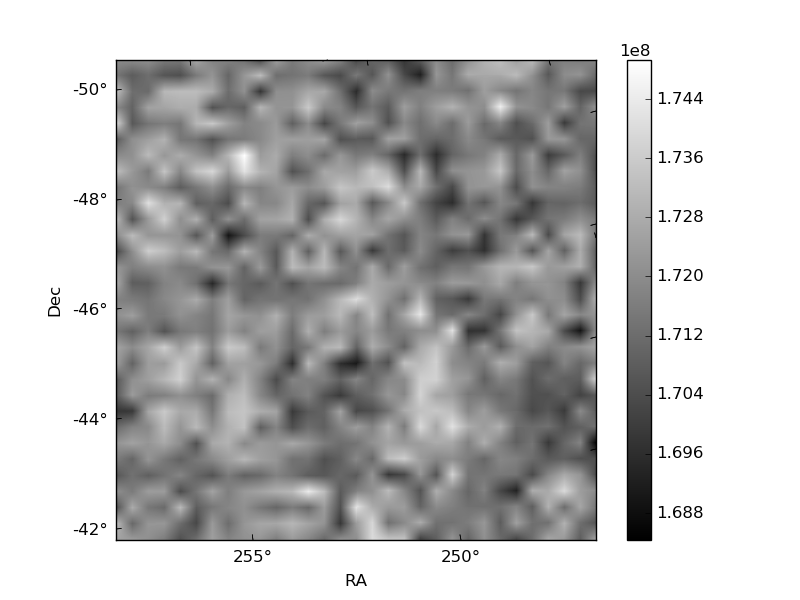 |
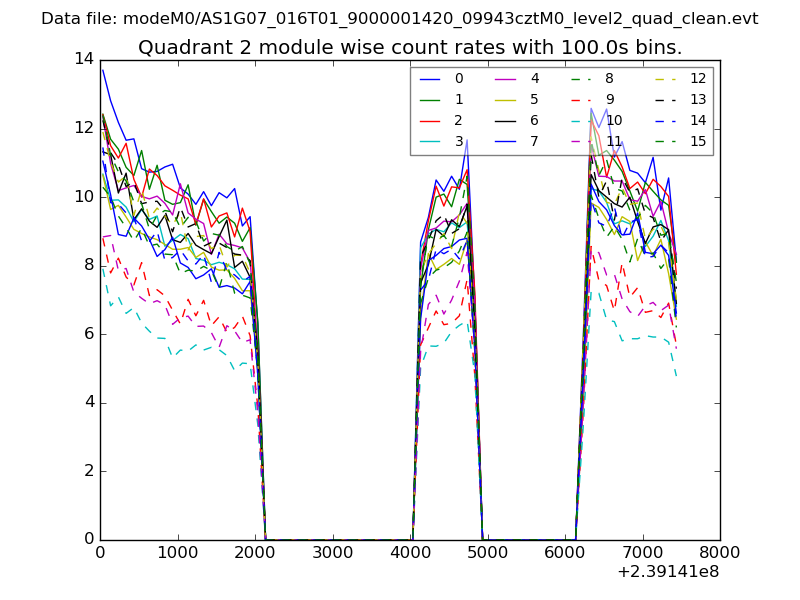
| Module-wise count rates for Quadrant C Data is divided into 100 sec bins |
 |
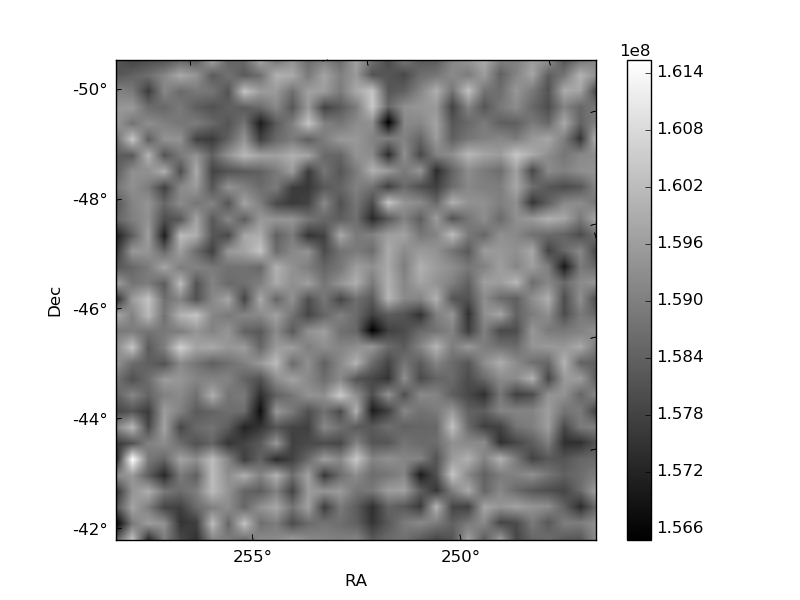 |
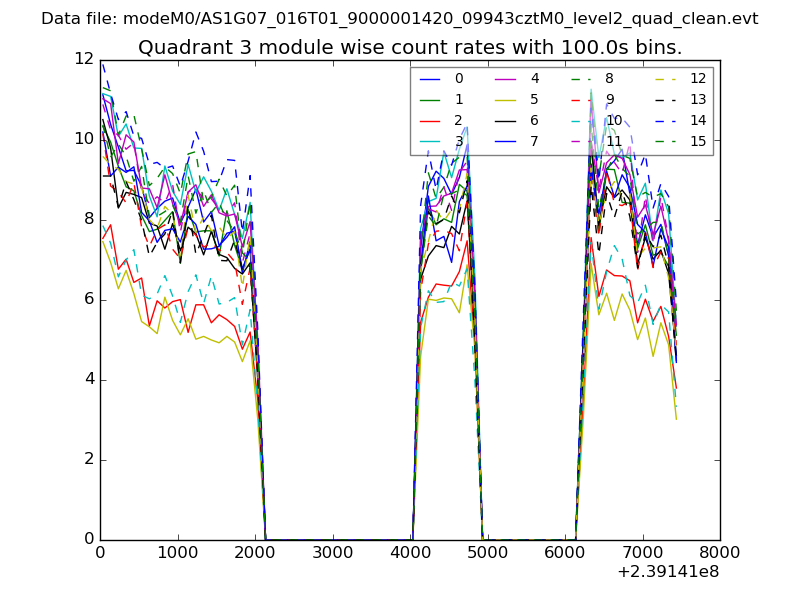
| Module-wise count rates for Quadrant D Data is divided into 100 sec bins |
 |
 |
| Parameter | Plot |
|---|---|
| CZT HV Monitor | 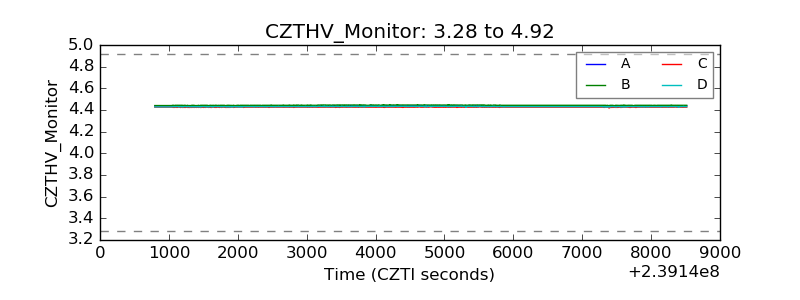 |
| D_VDD | 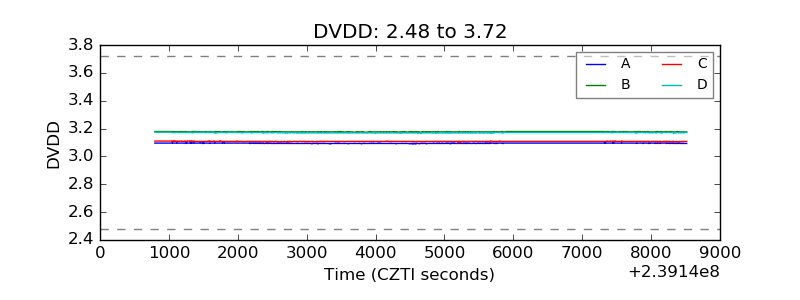 |
| Temperature 1 | 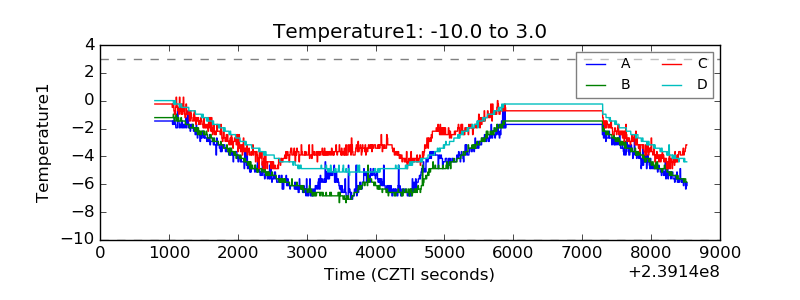 |
| Veto HV Monitor | 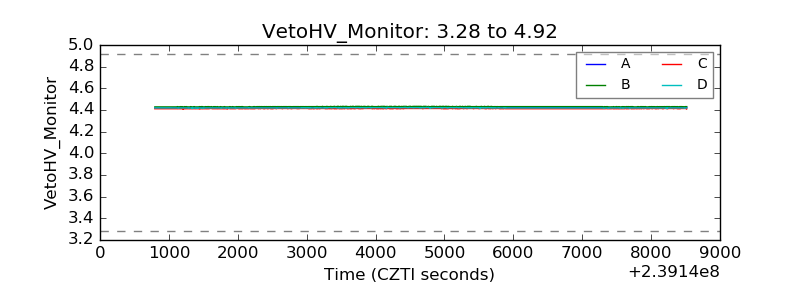 |
| Veto LLD | 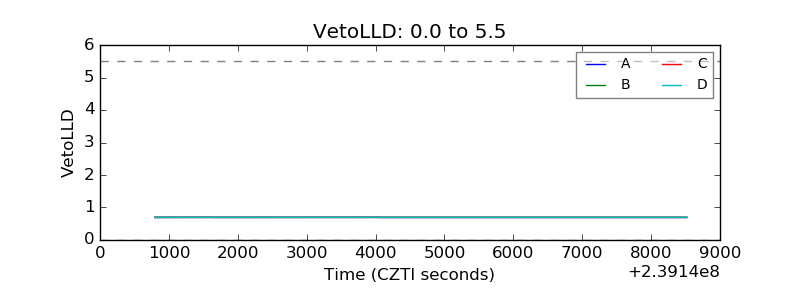 |
| Alpha Counter | 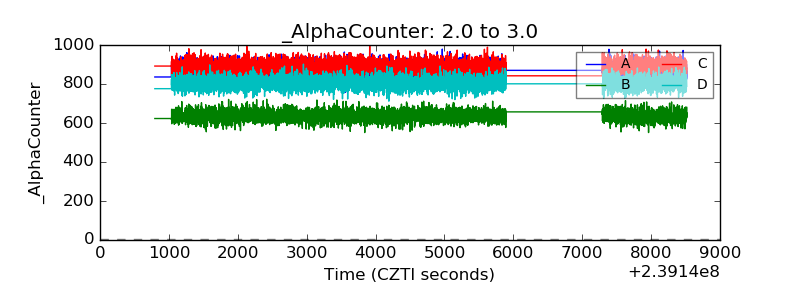 |
| _CPM_Rate | 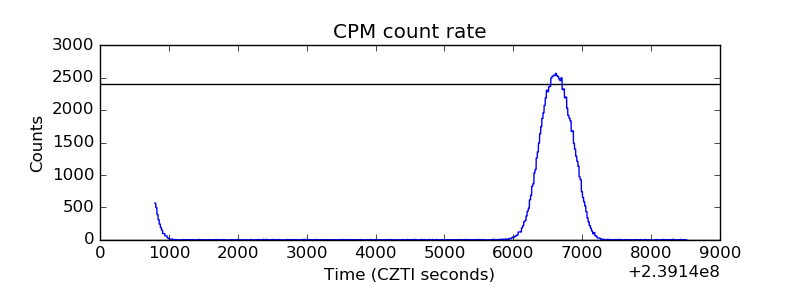 |
| CZT Counter | 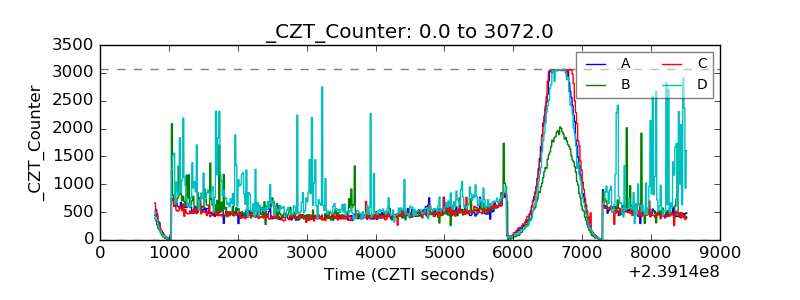 |
| +2.5 Volts monitor |  |
| +5 Volts monitor |  |
| _ROLL_ROT | 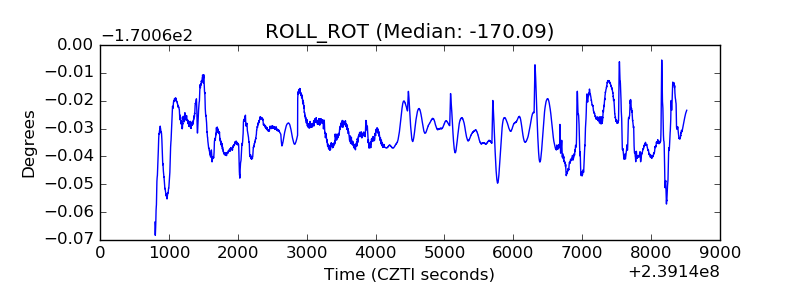 |
| _Roll_DEC | 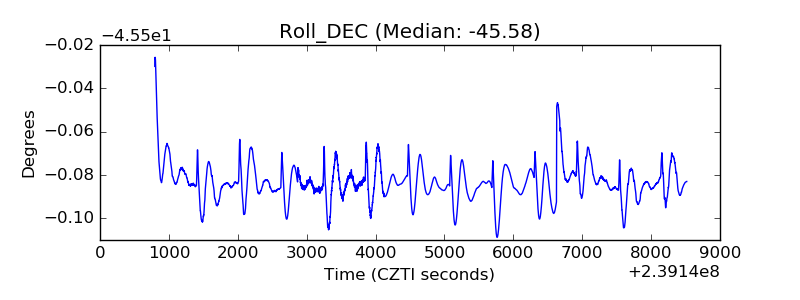 |
| _Roll_RA | 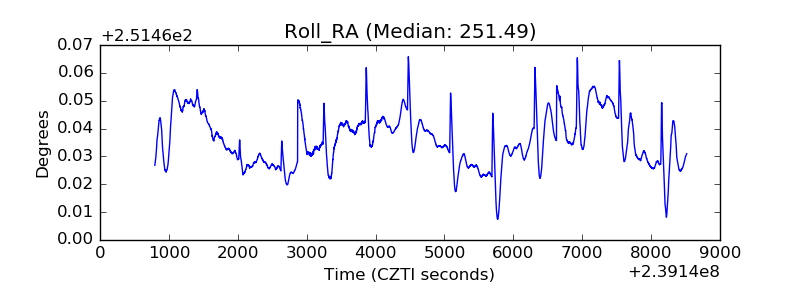 |
| Veto Counter |  |