| Param | Original file | Final file |
|---|---|---|
| Filename | modeM0/AS1G07_016T01_9000001420_09944cztM0_level2.evt | modeM0/AS1G07_016T01_9000001420_09944cztM0_level2_quad_clean.evt |
| Size (bytes) | 497,211,840 | 83,885,760 |
| Size | 474.2 MB | 80.0 MB |
| Events in quadrant A | 2,834,619 | 547,674 |
| Events in quadrant B | 3,206,782 | 556,656 |
| Events in quadrant C | 2,769,711 | 553,680 |
| Events in quadrant D | 5,840,520 | 463,637 |
| Mode SS | |||
|---|---|---|---|
| Quadrant | BADHDUFLAG | Total packets | Discarded packets |
| A | 0 | 124 | 0 |
| B | 0 | 124 | 0 |
| C | 0 | 124 | 2 |
| D | 0 | 124 | 0 |
| Mode M0 | |||
|---|---|---|---|
| Quadrant | BADHDUFLAG | Total packets | Discarded packets |
| A | 0 | 12563 | 135 |
| B | 0 | 13656 | 165 |
| C | 0 | 12394 | 126 |
| D | 0 | 21892 | 497 |
| Mode M9 | |||
|---|---|---|---|
| Quadrant | BADHDUFLAG | Total packets | Discarded packets |
| A | 0 | 14 | 0 |
| B | 0 | 14 | 0 |
| C | 0 | 14 | 0 |
| D | 0 | 14 | 0 |
| Quadrant | Total seconds | Saturated seconds | Saturation percentage |
|---|---|---|---|
| A | 5992 | 20 | 0.333778% |
| B | 5985 | 95 | 1.587302% |
| C | 5995 | 6 | 0.100083% |
| D | 5954 | 754 | 12.663755% |
Noise dominated data is calculated using 1-second bins in cleaned event files. If a bin has >2000 counts, and if more than 50% of those come from <1% of pixels, then it is considered to be noise-dominated and hence unusable.
| Quadrant | # 1 sec bins | Bins with >0 counts | Bins with >2000 counts | High rate bins dominated by noise | Noise dominated (total time) | Noise dominated (detector-on time) | Marked lightcurve |
|---|---|---|---|---|---|---|---|
| A | 7442 | 6053 | 0 | 0 | 0.00% | 0.00% | 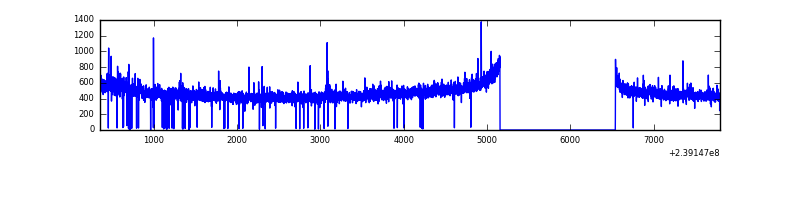 |
| B | 7442 | 6055 | 47 | 47 | 0.63% | 0.78% | 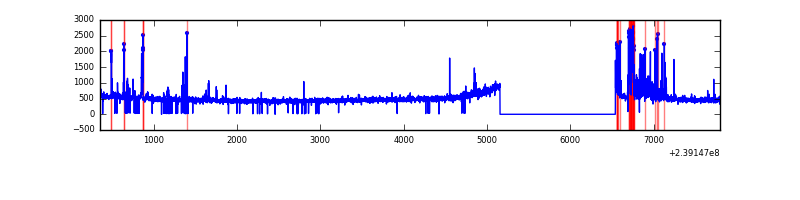 |
| C | 7442 | 6052 | 1 | 1 | 0.01% | 0.02% | 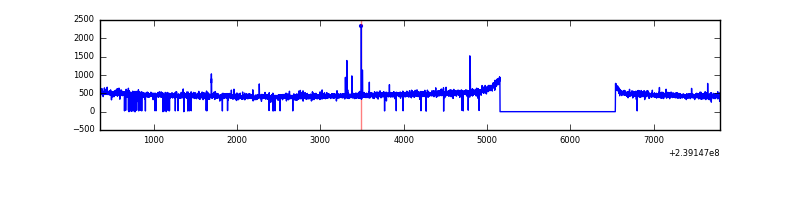 |
| D | 7442 | 6031 | 789 | 789 | 10.60% | 13.08% | 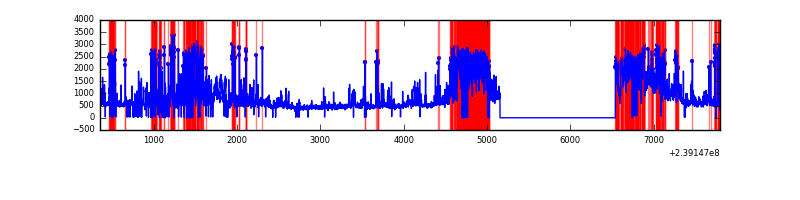 |
Top three noisy pixels from each quadrant. If the there are fewer than three noisy pixels in the level2.evt file, extra rows are filled as -1
| Pixel properties | Quadrant properties | ||||||
|---|---|---|---|---|---|---|---|
| Quadrant | DetID | PixID | Counts | Sigma | Mean | Median | Sigma |
| A | 8 | 15 | 25953 | 171.72 | 723 | 710 | 147.0 |
| A | 15 | 174 | 17849 | 116.59 | 723 | 710 | 147.0 |
| A | 0 | 226 | 6757 | 41.14 | 723 | 710 | 147.0 |
| B | 4 | 81 | 176150 | 1257.46 | 731 | 716 | 139.5 |
| B | 4 | 239 | 91590 | 651.35 | 731 | 716 | 139.5 |
| B | 0 | 214 | 31297 | 219.19 | 731 | 716 | 139.5 |
| C | 14 | 234 | 7170 | 39.63 | 705 | 709 | 163.0 |
| C | 13 | 61 | 5344 | 28.43 | 705 | 709 | 163.0 |
| C | 12 | 4 | 4347 | 22.31 | 705 | 709 | 163.0 |
| D | 2 | 16 | 1067552 | 6212.8 | 647 | 633 | 171.7 |
| D | 12 | 233 | 1051500 | 6119.32 | 647 | 633 | 171.7 |
| D | 10 | 253 | 523223 | 3043.1 | 647 | 633 | 171.7 |
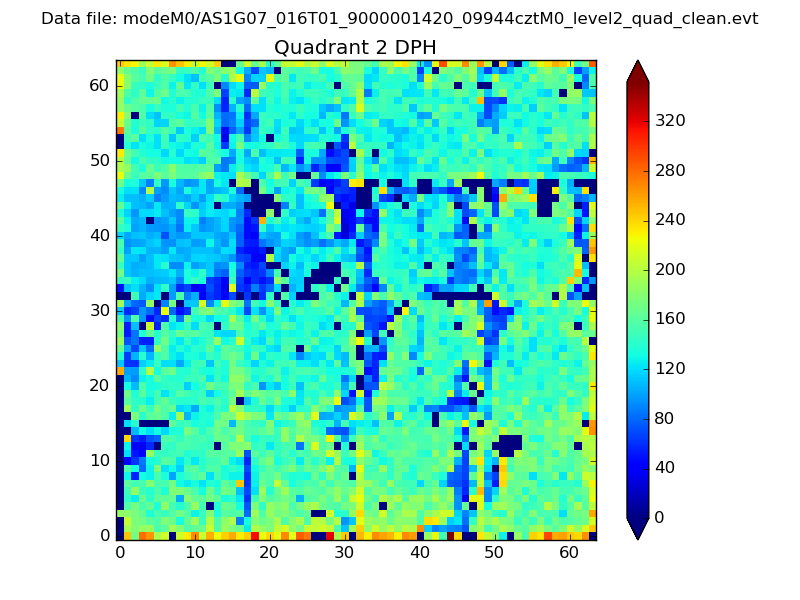
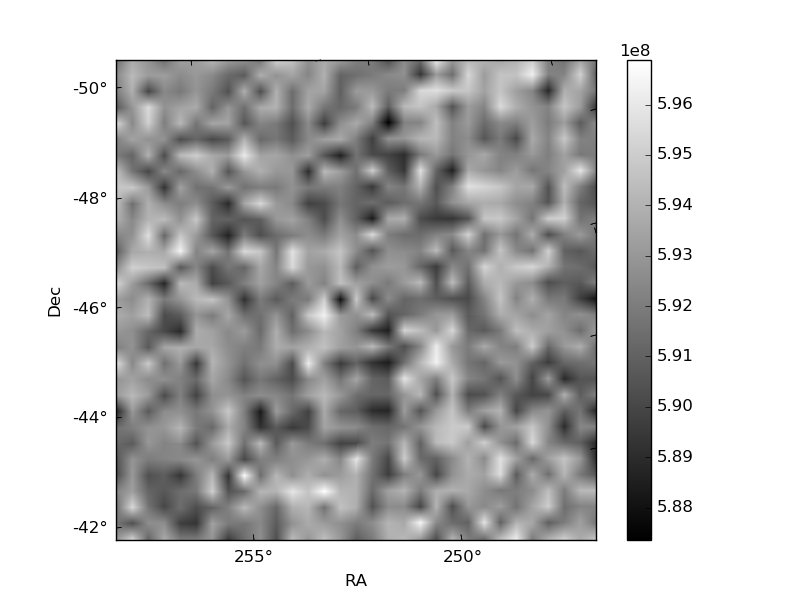
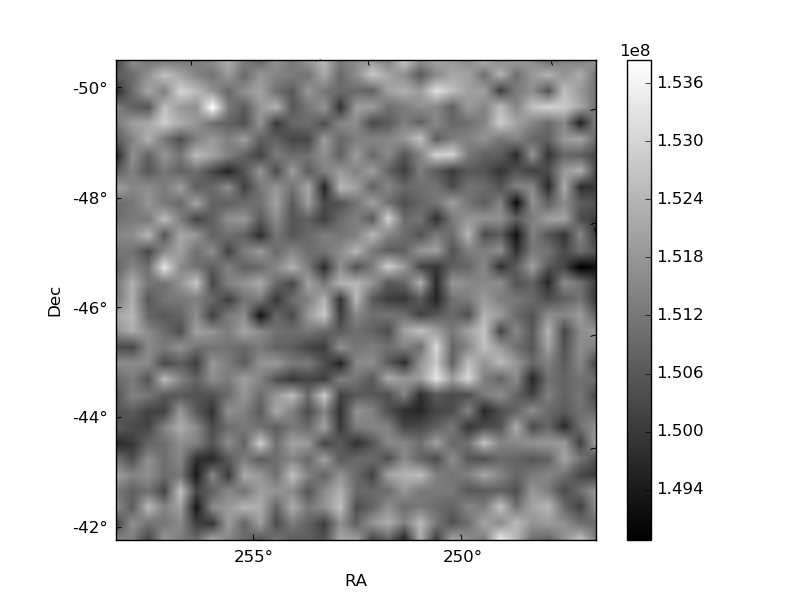
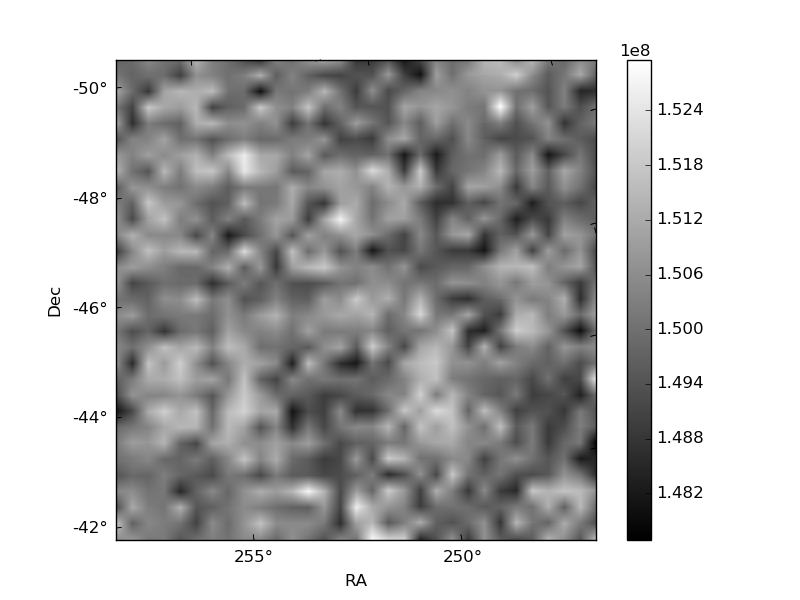
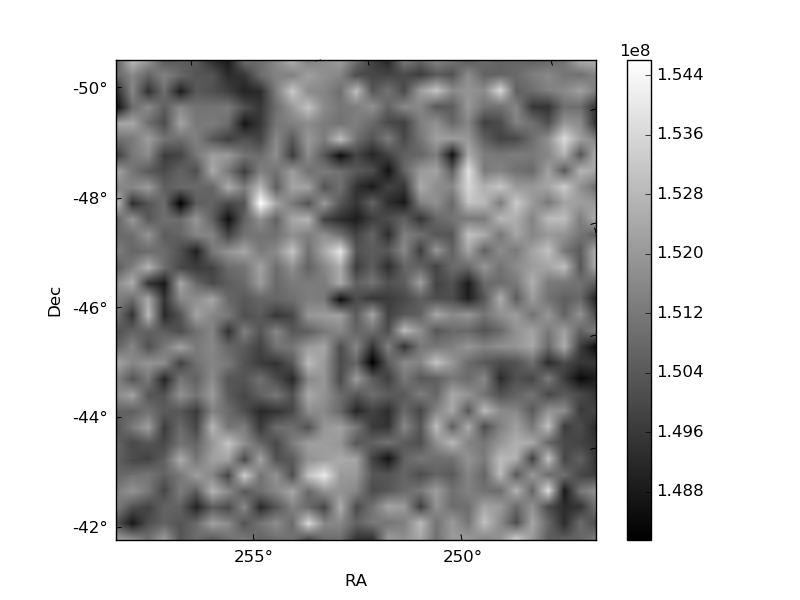
Histogram calculated using DETX and DETY for each event in the final _common_clean file
| Quadrant A | 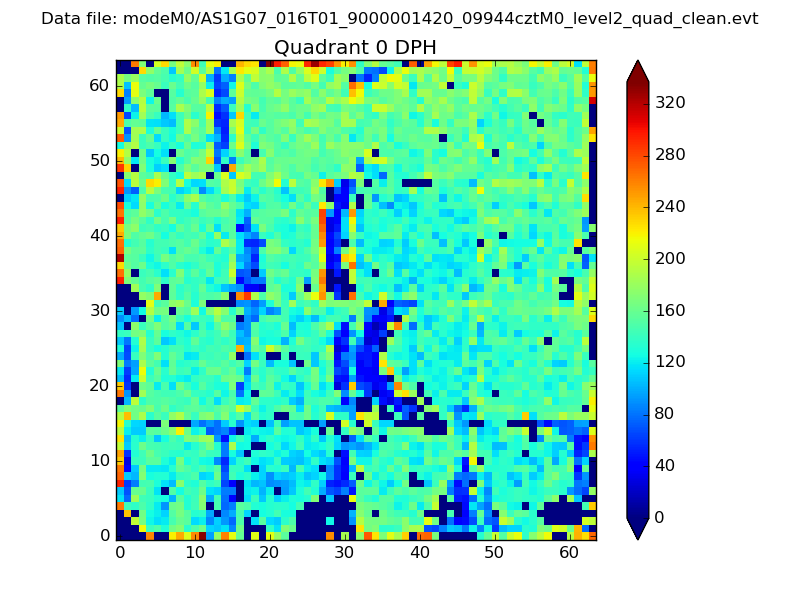 |
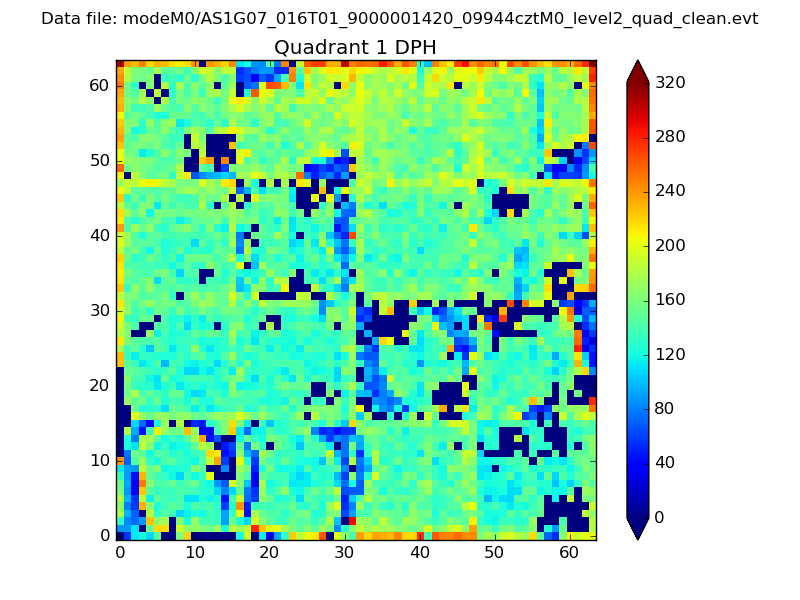 |
Quadrant B |
|---|---|---|---|
| Quadrant D | 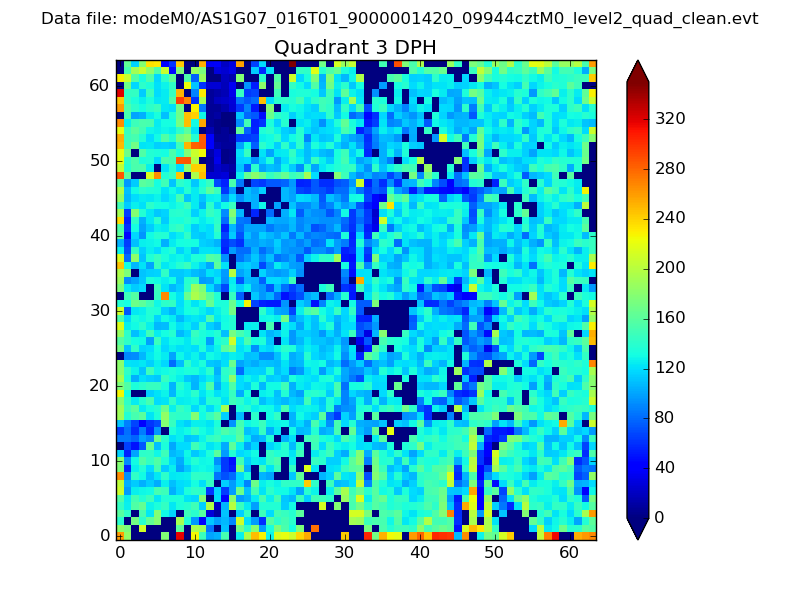 |
 |
Quadrant C |
| Plot type | Count rate plots | Images |
|---|---|---|
| Comparison with Poisson distribution Blue bars denote a histogram of data divided into 1 sec bins. Red curve is a Poisson curve with rate = median count rate of data. |
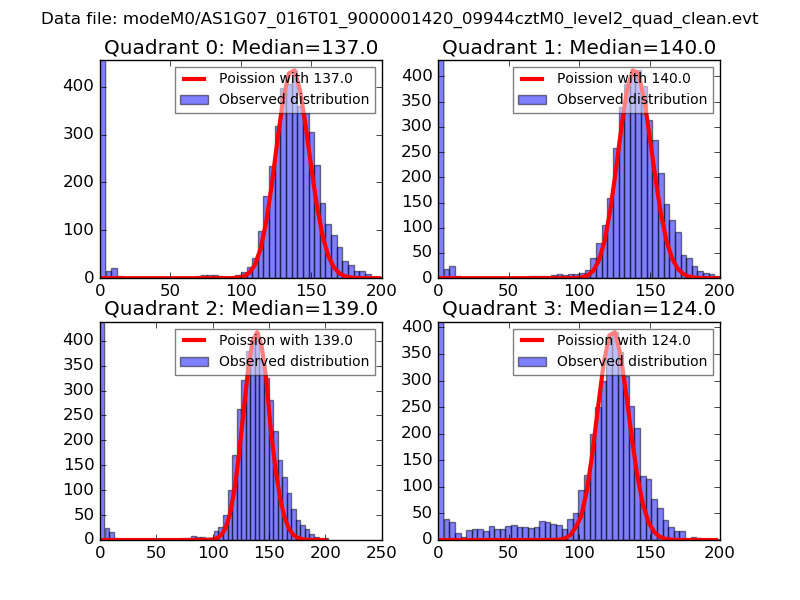 |
 |
| Quadrant-wise count rates Data is divided into 100 sec bins |
 |
|
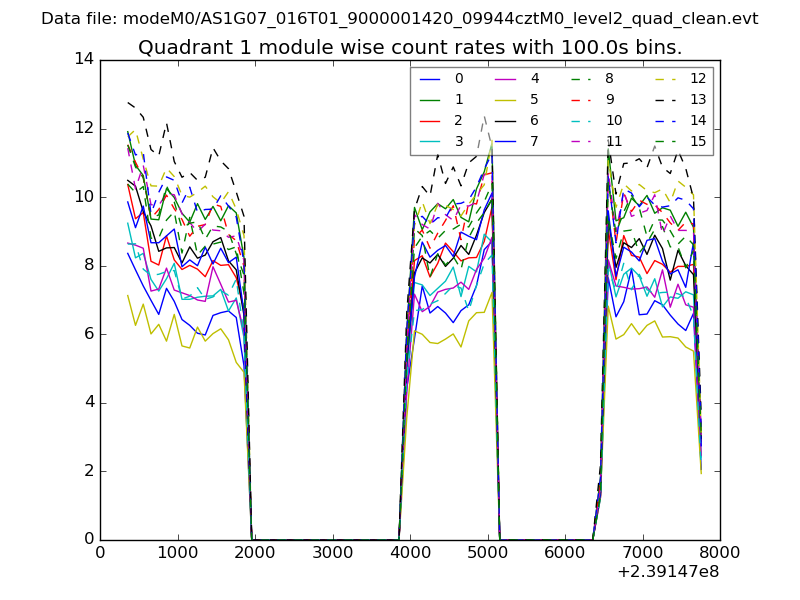
| Module-wise count rates for Quadrant A Data is divided into 100 sec bins |
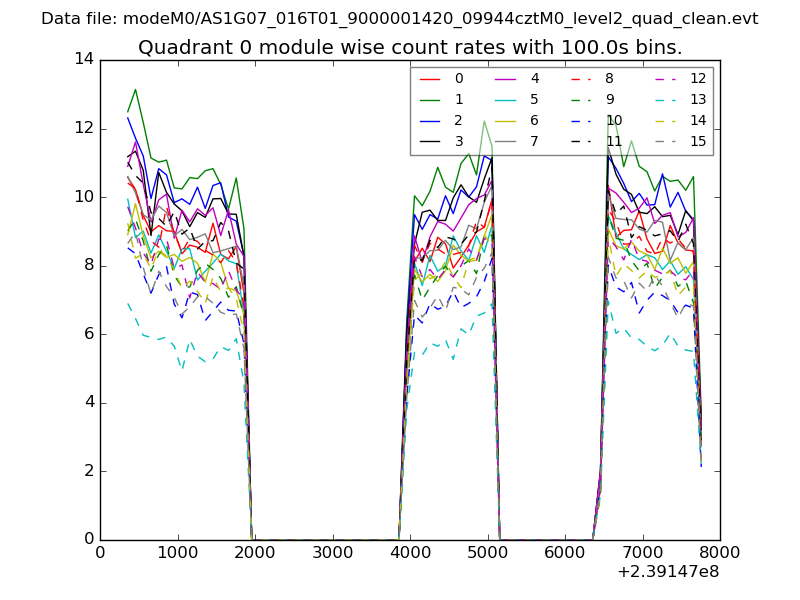 |
 |
| Module-wise count rates for Quadrant B Data is divided into 100 sec bins |
 |
 |
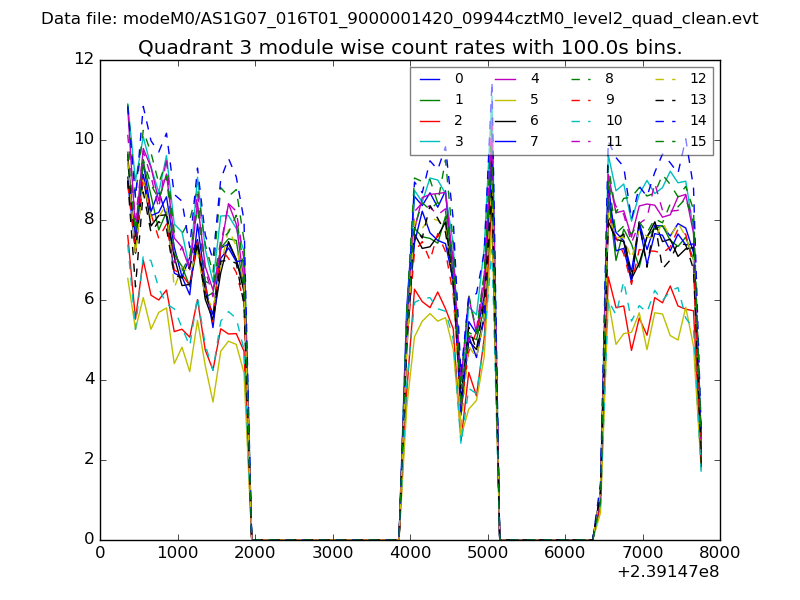
| Module-wise count rates for Quadrant C Data is divided into 100 sec bins |
 |
 |
| Module-wise count rates for Quadrant D Data is divided into 100 sec bins |
 |
 |
| Parameter | Plot |
|---|---|
| CZT HV Monitor | 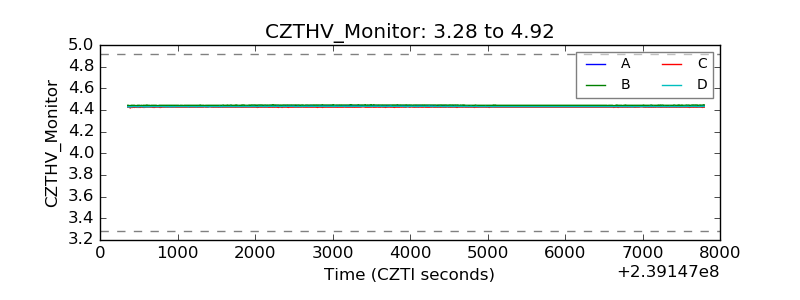 |
| D_VDD | 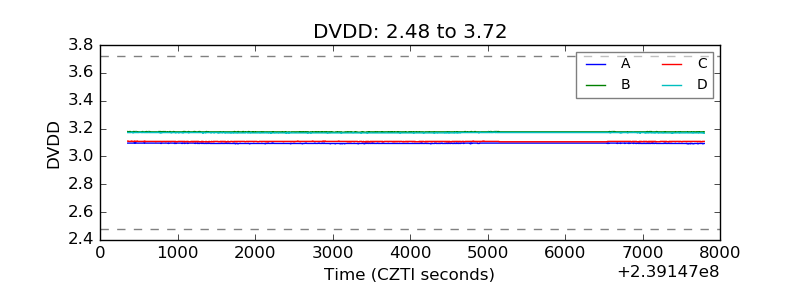 |
| Temperature 1 | 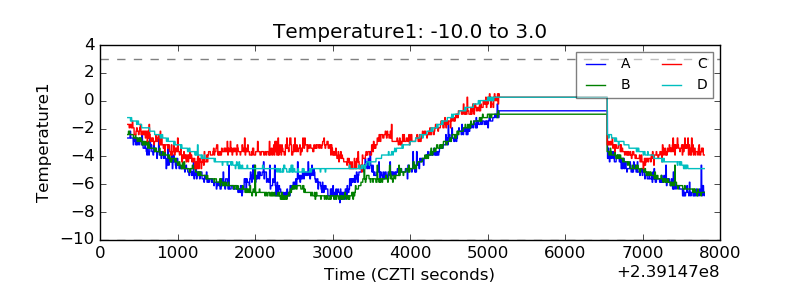 |
| Veto HV Monitor | 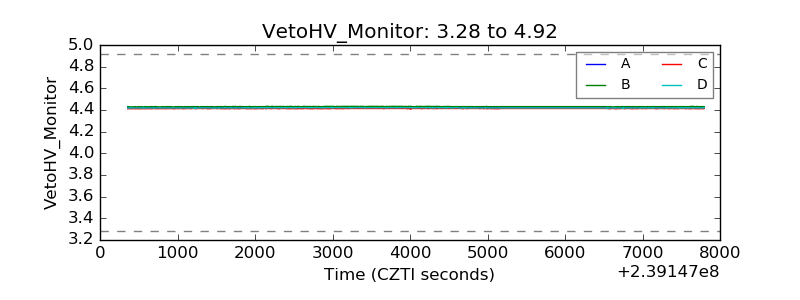 |
| Veto LLD | 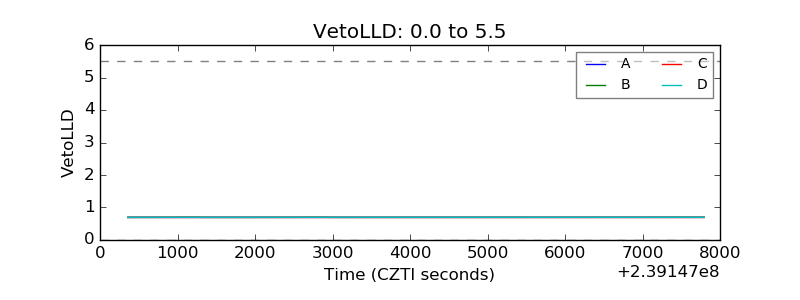 |
| Alpha Counter | 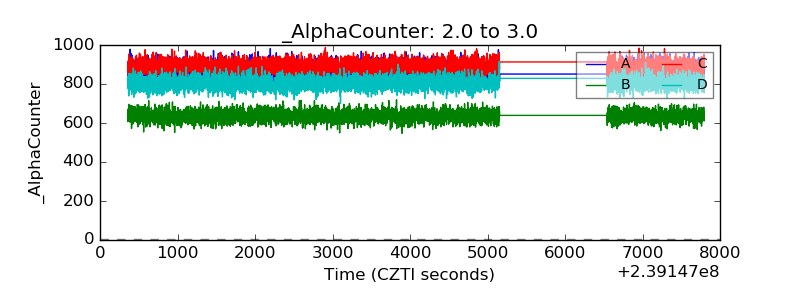 |
| _CPM_Rate | 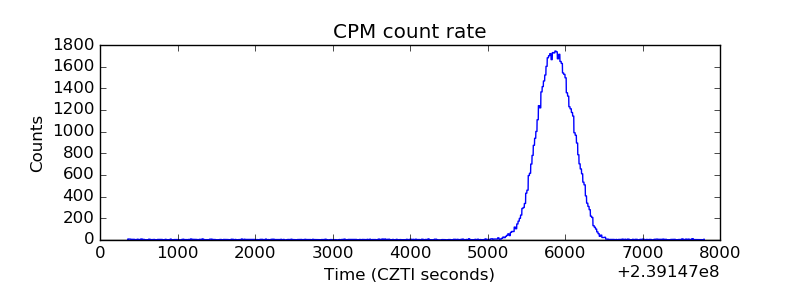 |
| CZT Counter | 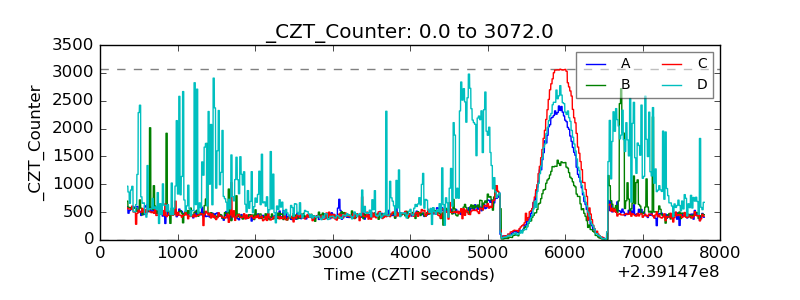 |
| +2.5 Volts monitor |  |
| +5 Volts monitor |  |
| _ROLL_ROT | 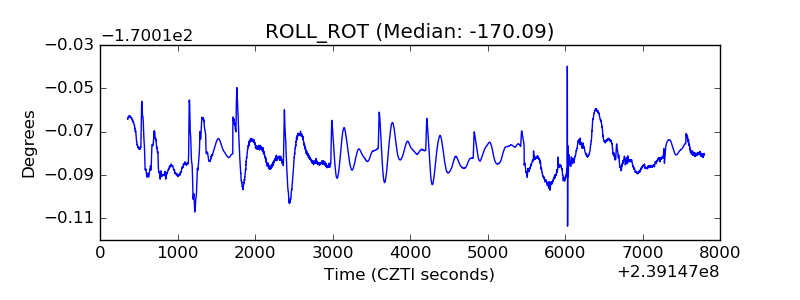 |
| _Roll_DEC | 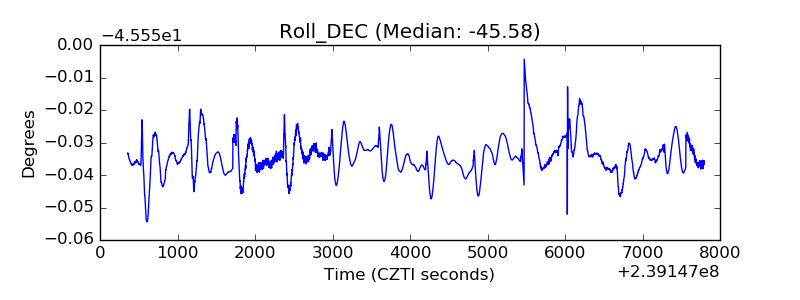 |
| _Roll_RA | 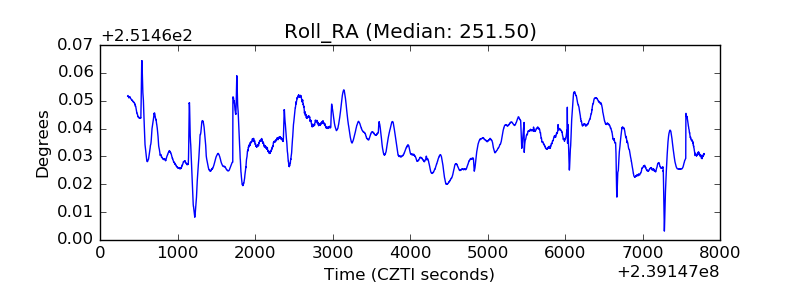 |
| Veto Counter | 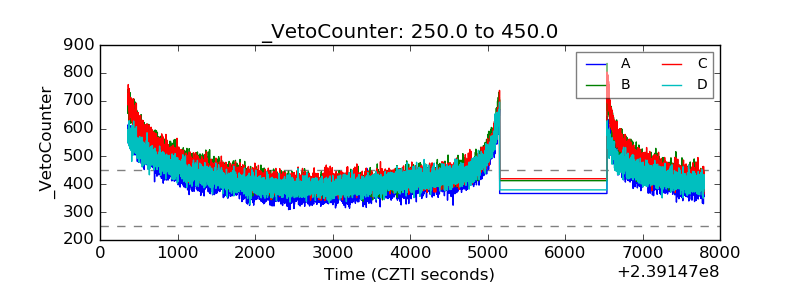 |