| Param | Original file | Final file |
|---|---|---|
| Filename | modeM0/AS1G07_016T01_9000001420_09946cztM0_level2.evt | modeM0/AS1G07_016T01_9000001420_09946cztM0_level2_quad_clean.evt |
| Size (bytes) | 503,406,720 | 81,757,440 |
| Size | 480.1 MB | 78.0 MB |
| Events in quadrant A | 3,484,907 | 496,739 |
| Events in quadrant B | 3,624,700 | 506,347 |
| Events in quadrant C | 3,149,984 | 509,441 |
| Events in quadrant D | 4,509,923 | 474,741 |
| Mode SS | |||
|---|---|---|---|
| Quadrant | BADHDUFLAG | Total packets | Discarded packets |
| A | 0 | 144 | 0 |
| B | 0 | 144 | 0 |
| C | 0 | 144 | 0 |
| D | 0 | 144 | 0 |
| Mode M0 | |||
|---|---|---|---|
| Quadrant | BADHDUFLAG | Total packets | Discarded packets |
| A | 0 | 15282 | 3 |
| B | 0 | 15565 | 2 |
| C | 0 | 14383 | 2 |
| D | 0 | 18489 | 2 |
| Mode M9 | |||
|---|---|---|---|
| Quadrant | BADHDUFLAG | Total packets | Discarded packets |
| A | 0 | 22 | 0 |
| B | 0 | 22 | 0 |
| C | 0 | 22 | 0 |
| D | 0 | 22 | 0 |
| Quadrant | Total seconds | Saturated seconds | Saturation percentage |
|---|---|---|---|
| A | 7011 | 224 | 3.194979% |
| B | 7011 | 135 | 1.925546% |
| C | 7011 | 32 | 0.456426% |
| D | 7011 | 210 | 2.995293% |
Noise dominated data is calculated using 1-second bins in cleaned event files. If a bin has >2000 counts, and if more than 50% of those come from <1% of pixels, then it is considered to be noise-dominated and hence unusable.
| Quadrant | # 1 sec bins | Bins with >0 counts | Bins with >2000 counts | High rate bins dominated by noise | Noise dominated (total time) | Noise dominated (detector-on time) | Marked lightcurve |
|---|---|---|---|---|---|---|---|
| A | 9171 | 7012 | 8 | 8 | 0.09% | 0.11% | 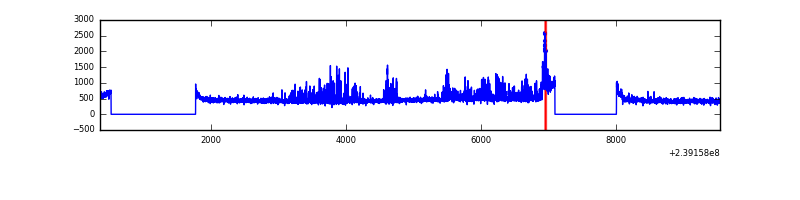 |
| B | 9171 | 7011 | 60 | 60 | 0.65% | 0.86% | 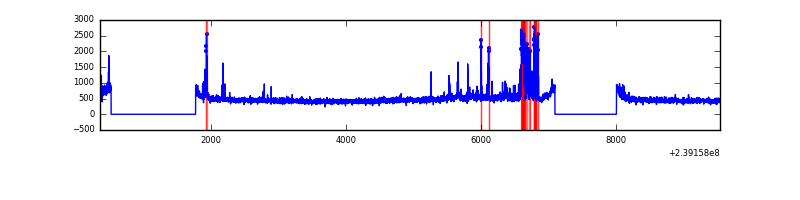 |
| C | 9171 | 7012 | 2 | 2 | 0.02% | 0.03% | 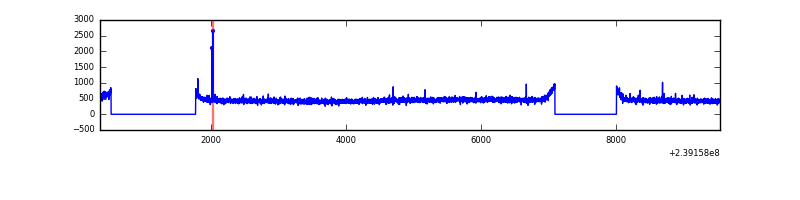 |
| D | 9171 | 7011 | 124 | 124 | 1.35% | 1.77% | 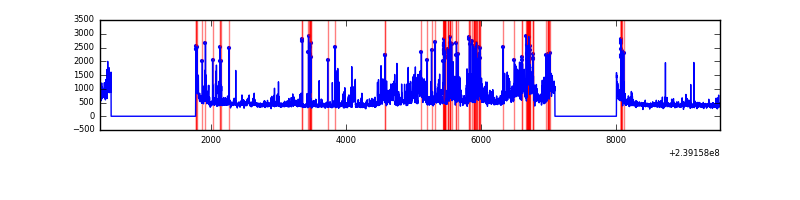 |
Top three noisy pixels from each quadrant. If the there are fewer than three noisy pixels in the level2.evt file, extra rows are filled as -1
| Pixel properties | Quadrant properties | ||||||
|---|---|---|---|---|---|---|---|
| Quadrant | DetID | PixID | Counts | Sigma | Mean | Median | Sigma |
| A | 14 | 111 | 224960 | 1360.26 | 813 | 797 | 164.8 |
| A | 15 | 174 | 96425 | 580.29 | 813 | 797 | 164.8 |
| A | 8 | 15 | 27041 | 159.25 | 813 | 797 | 164.8 |
| B | 4 | 239 | 293376 | 1843.59 | 825 | 803 | 158.7 |
| B | 0 | 214 | 57761 | 358.91 | 825 | 803 | 158.7 |
| B | 4 | 81 | 25202 | 153.74 | 825 | 803 | 158.7 |
| C | 7 | 247 | 14141 | 72.22 | 800 | 805 | 184.7 |
| C | 13 | 61 | 6009 | 28.18 | 800 | 805 | 184.7 |
| C | 14 | 67 | 4242 | 18.61 | 800 | 805 | 184.7 |
| D | 2 | 16 | 685563 | 3310.92 | 782 | 762 | 206.8 |
| D | 12 | 233 | 179515 | 864.25 | 782 | 762 | 206.8 |
| D | 10 | 253 | 152446 | 733.37 | 782 | 762 | 206.8 |
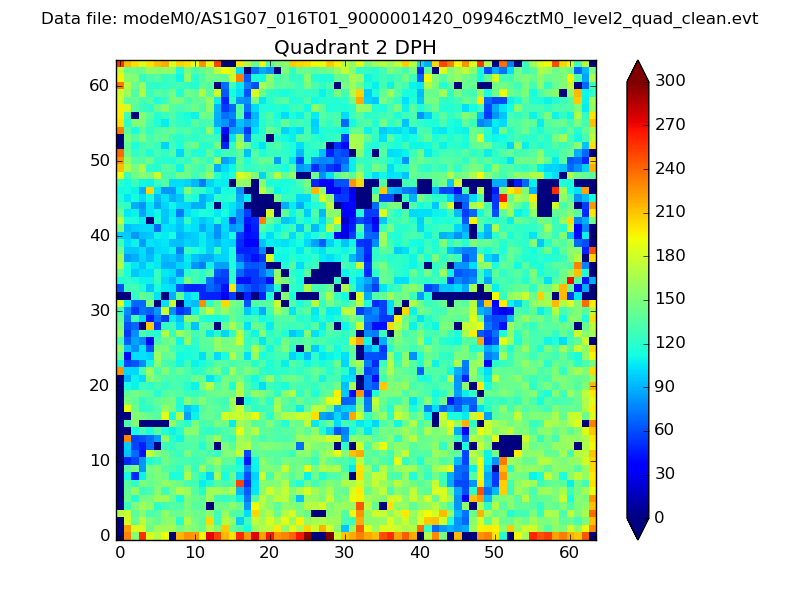
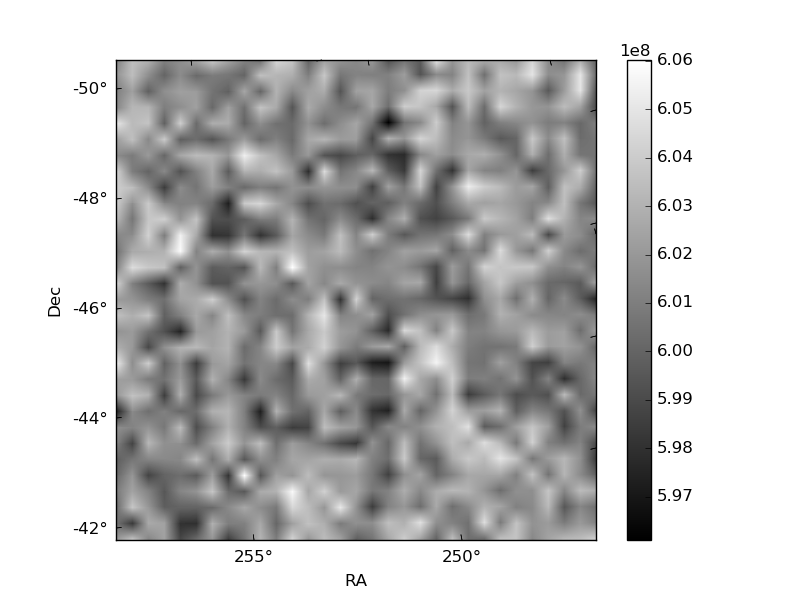
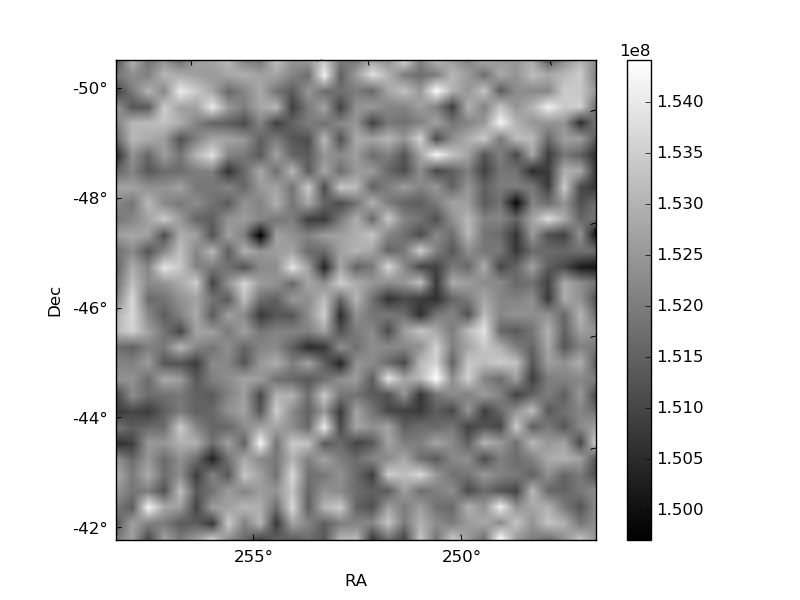
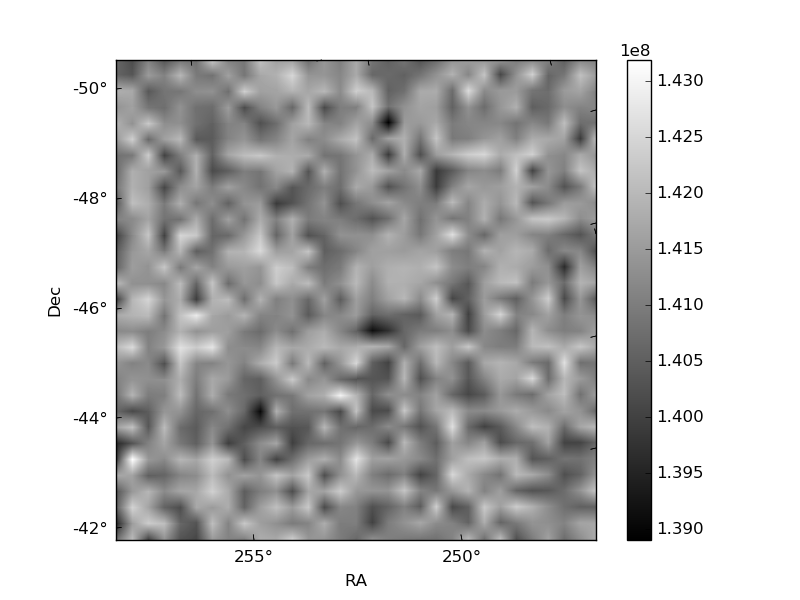
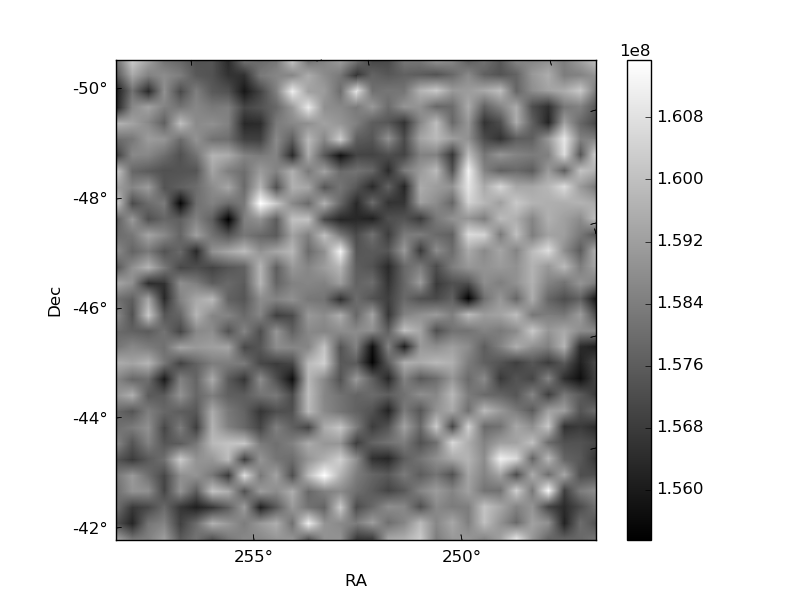
Histogram calculated using DETX and DETY for each event in the final _common_clean file
| Quadrant A | 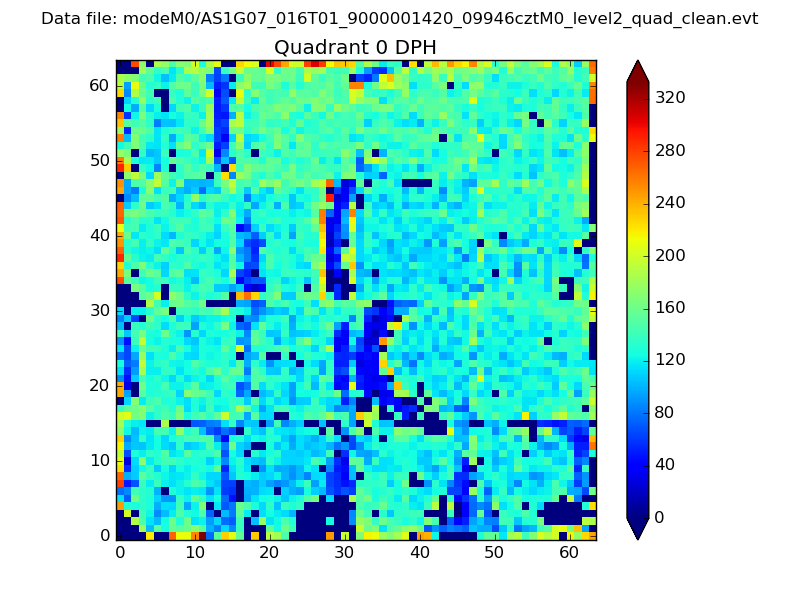 |
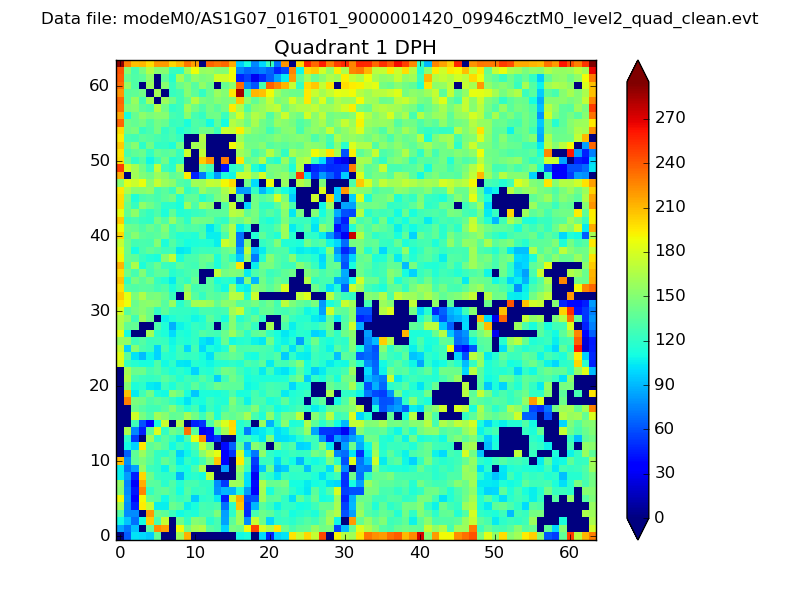 |
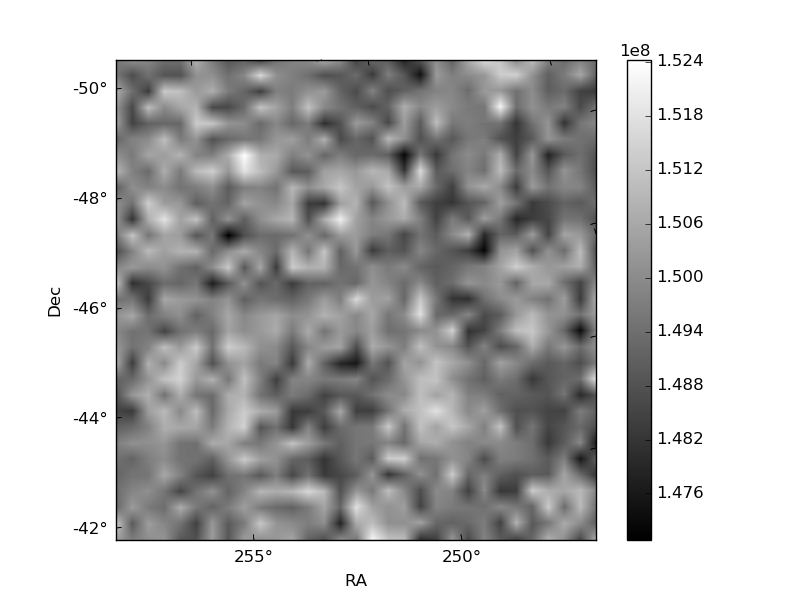
Quadrant B |
|---|---|---|---|
| Quadrant D | 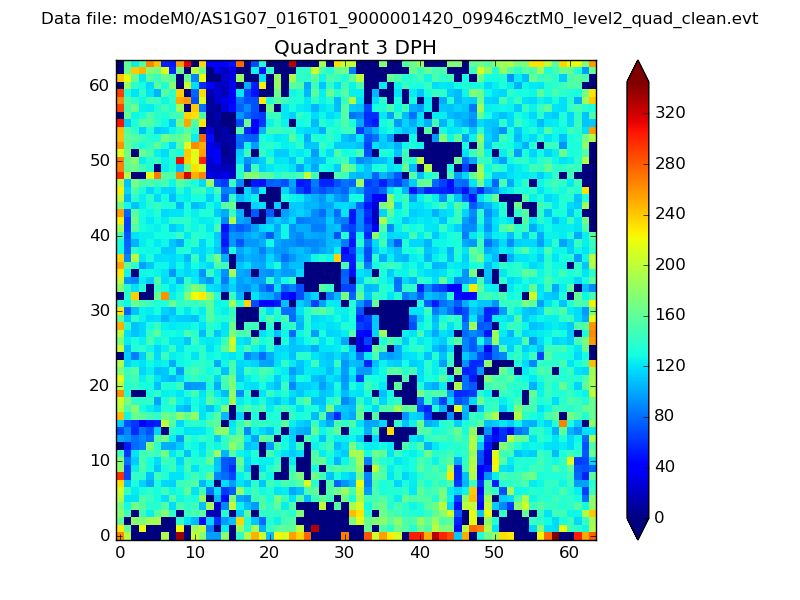 |
 |
Quadrant C |
| Plot type | Count rate plots | Images |
|---|---|---|
| Comparison with Poisson distribution Blue bars denote a histogram of data divided into 1 sec bins. Red curve is a Poisson curve with rate = median count rate of data. |
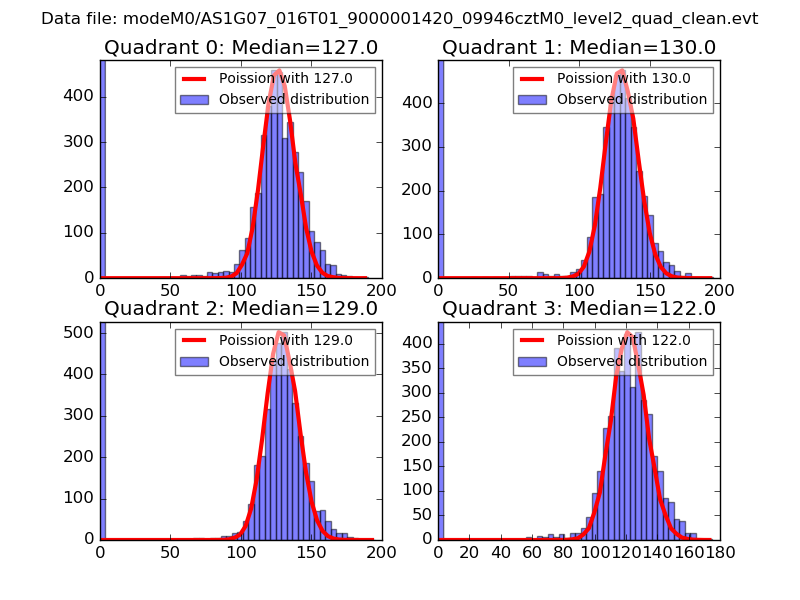 |
 |
| Quadrant-wise count rates Data is divided into 100 sec bins |
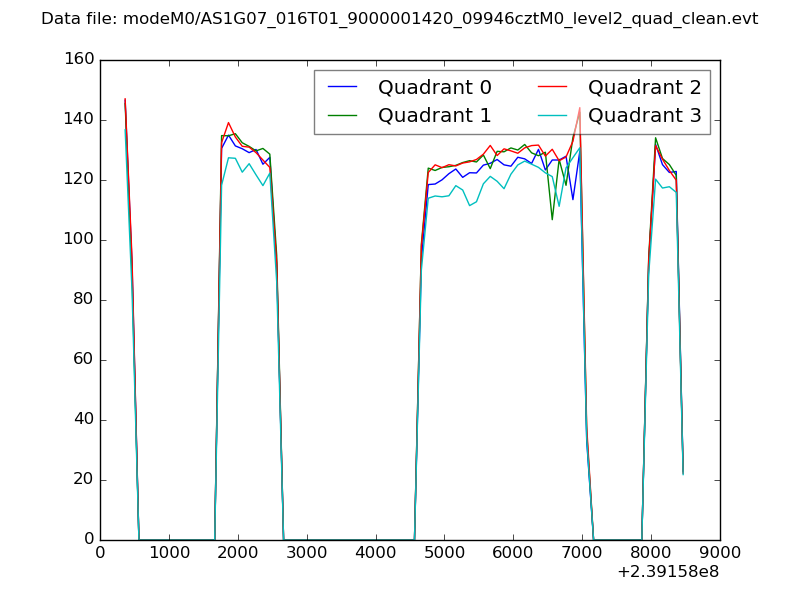 |
|
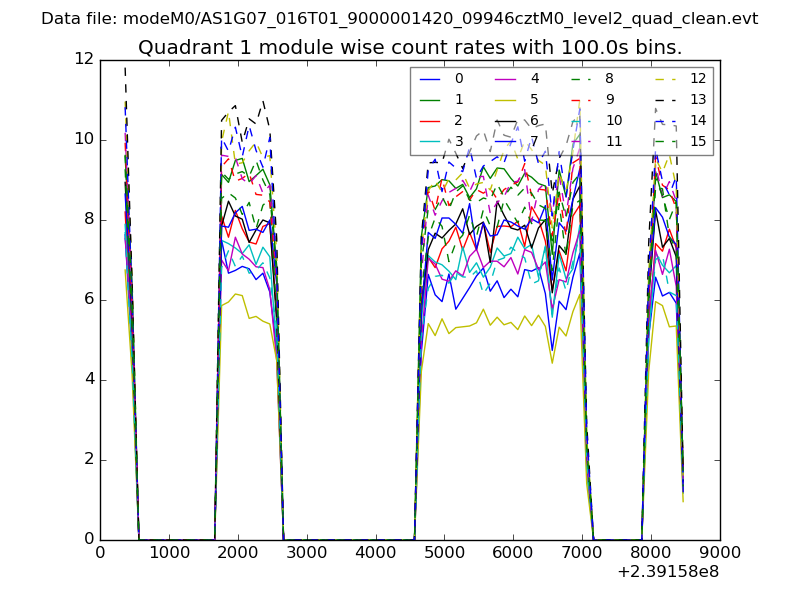
| Module-wise count rates for Quadrant A Data is divided into 100 sec bins |
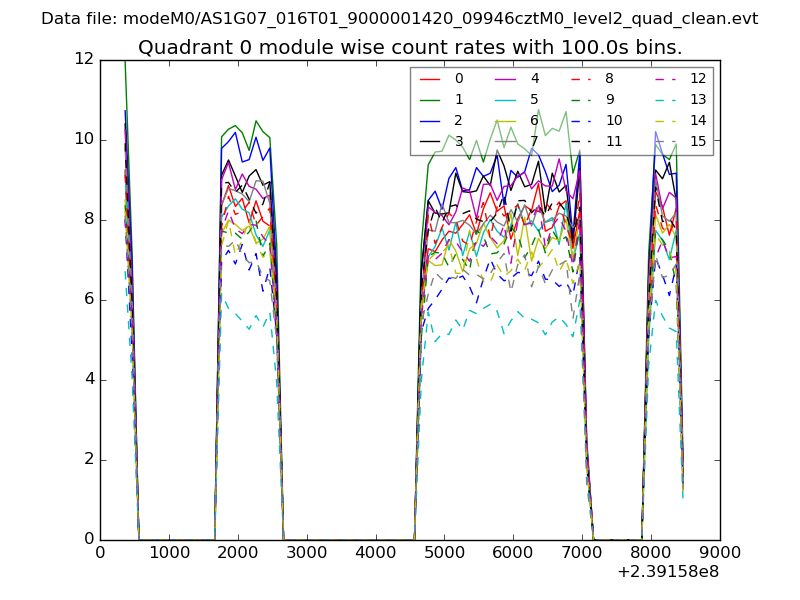 |
 |
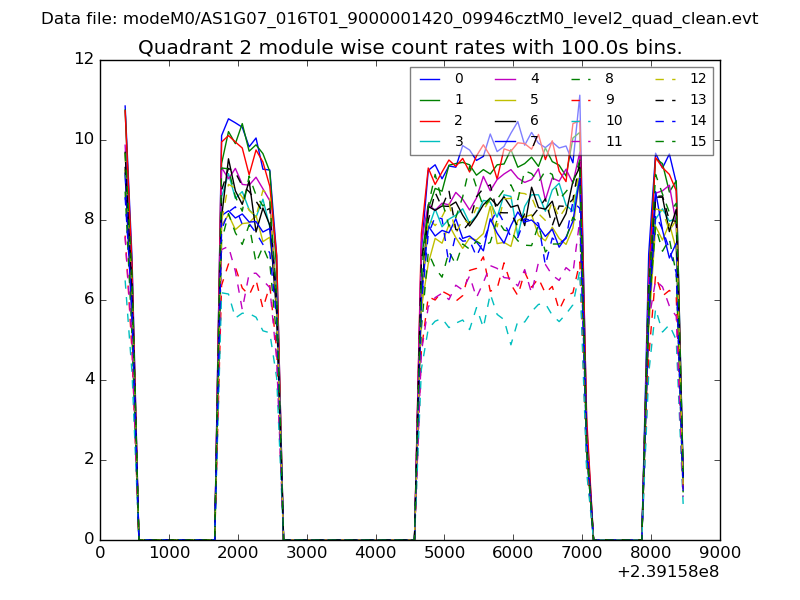
| Module-wise count rates for Quadrant B Data is divided into 100 sec bins |
 |
 |
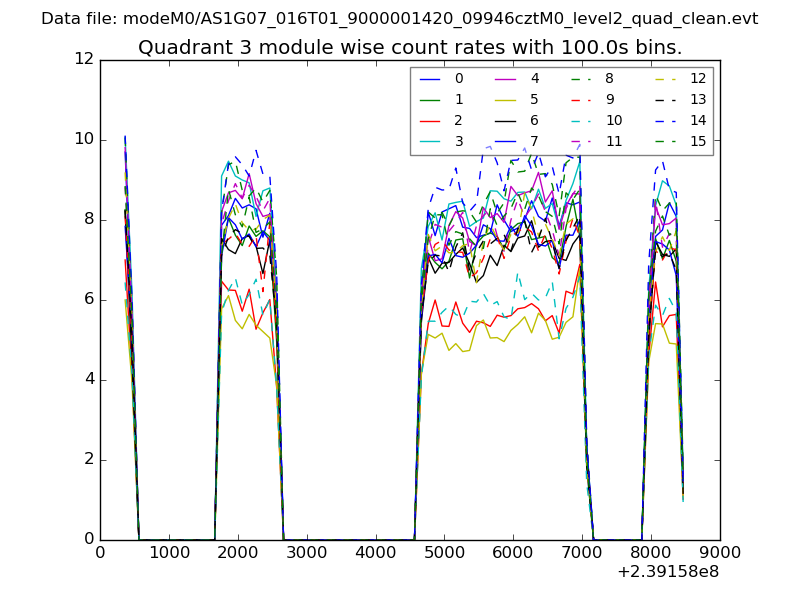
| Module-wise count rates for Quadrant C Data is divided into 100 sec bins |
 |
 |
| Module-wise count rates for Quadrant D Data is divided into 100 sec bins |
 |
 |
| Parameter | Plot |
|---|---|
| CZT HV Monitor | 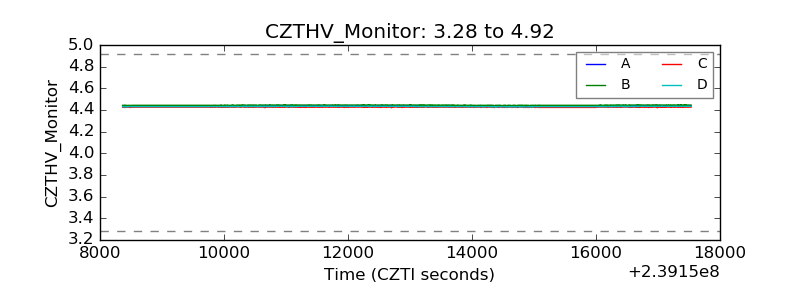 |
| D_VDD | 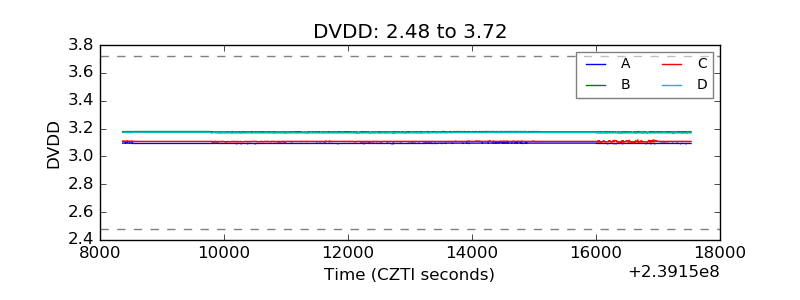 |
| Temperature 1 |  |
| Veto HV Monitor | 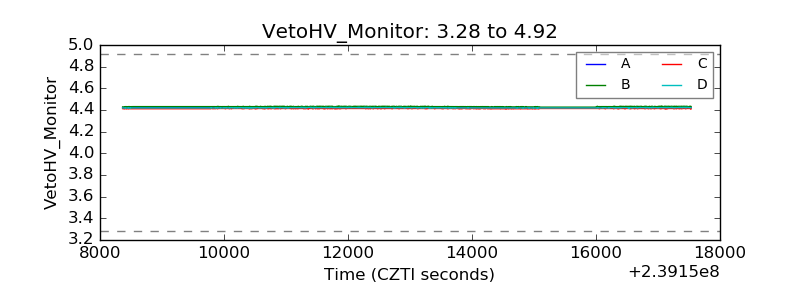 |
| Veto LLD | 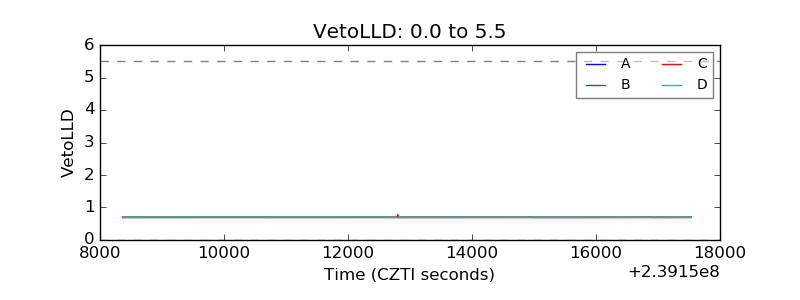 |
| Alpha Counter | 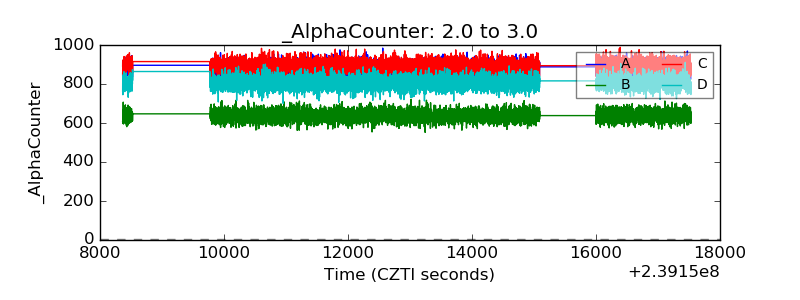 |
| _CPM_Rate | 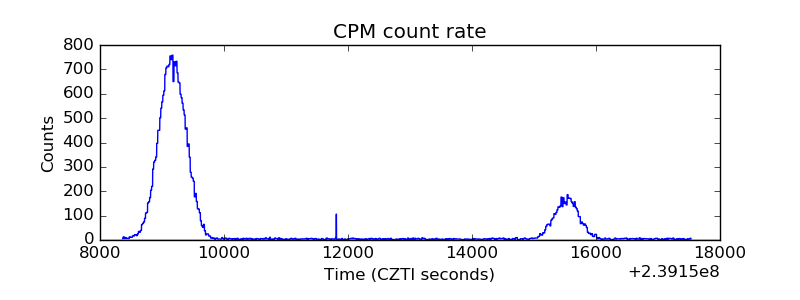 |
| CZT Counter | 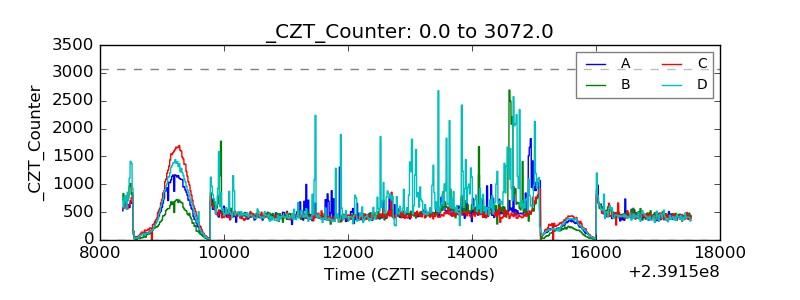 |
| +2.5 Volts monitor |  |
| +5 Volts monitor |  |
| _ROLL_ROT | 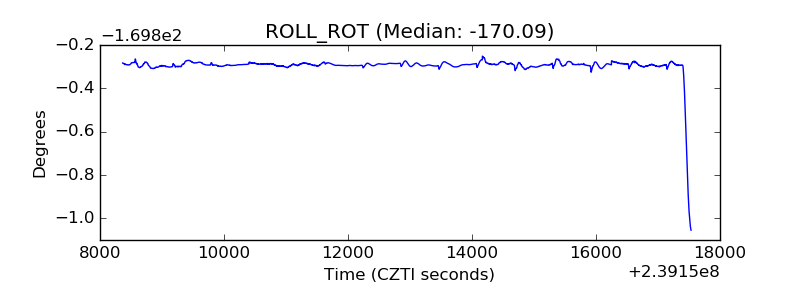 |
| _Roll_DEC |  |
| _Roll_RA | 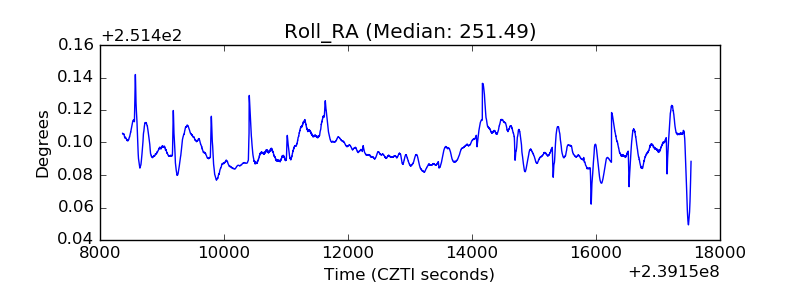 |
| Veto Counter | 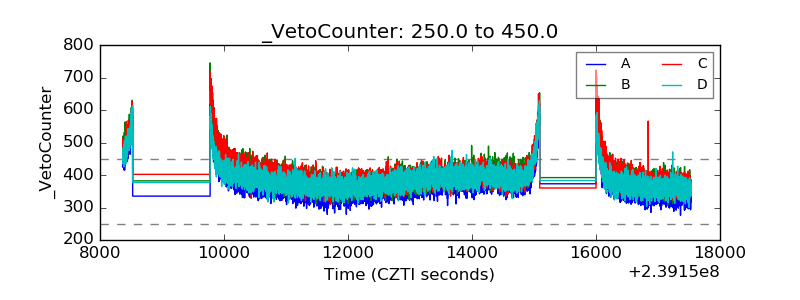 |