| Param | Original file | Final file |
|---|---|---|
| Filename | modeM0/AS1G07_016T01_9000001420_09947cztM0_level2.evt | modeM0/AS1G07_016T01_9000001420_09947cztM0_level2_quad_clean.evt |
| Size (bytes) | 493,312,320 | 77,716,800 |
| Size | 470.5 MB | 74.1 MB |
| Events in quadrant A | 3,240,895 | 469,927 |
| Events in quadrant B | 3,403,526 | 477,165 |
| Events in quadrant C | 3,196,513 | 476,671 |
| Events in quadrant D | 4,610,460 | 428,713 |
| Mode SS | |||
|---|---|---|---|
| Quadrant | BADHDUFLAG | Total packets | Discarded packets |
| A | 0 | 144 | 0 |
| B | 0 | 144 | 0 |
| C | 0 | 144 | 0 |
| D | 0 | 144 | 0 |
| Mode M0 | |||
|---|---|---|---|
| Quadrant | BADHDUFLAG | Total packets | Discarded packets |
| A | 0 | 14788 | 3 |
| B | 0 | 15027 | 2 |
| C | 0 | 14752 | 2 |
| D | 0 | 18835 | 2 |
| Mode M9 | |||
|---|---|---|---|
| Quadrant | BADHDUFLAG | Total packets | Discarded packets |
| A | 0 | 8 | 0 |
| B | 0 | 8 | 0 |
| C | 0 | 8 | 0 |
| D | 0 | 9 | 0 |
| Quadrant | Total seconds | Saturated seconds | Saturation percentage |
|---|---|---|---|
| A | 7196 | 35 | 0.486381% |
| B | 7196 | 76 | 1.056142% |
| C | 7196 | 41 | 0.569761% |
| D | 7196 | 455 | 6.322957% |
Noise dominated data is calculated using 1-second bins in cleaned event files. If a bin has >2000 counts, and if more than 50% of those come from <1% of pixels, then it is considered to be noise-dominated and hence unusable.
| Quadrant | # 1 sec bins | Bins with >0 counts | Bins with >2000 counts | High rate bins dominated by noise | Noise dominated (total time) | Noise dominated (detector-on time) | Marked lightcurve |
|---|---|---|---|---|---|---|---|
| A | 7681 | 7196 | 0 | 0 | 0.00% | 0.00% | 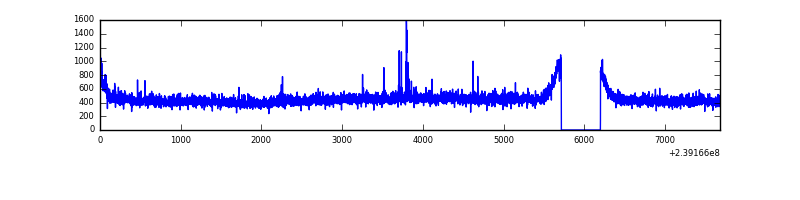 |
| B | 7681 | 7196 | 6 | 6 | 0.08% | 0.08% | 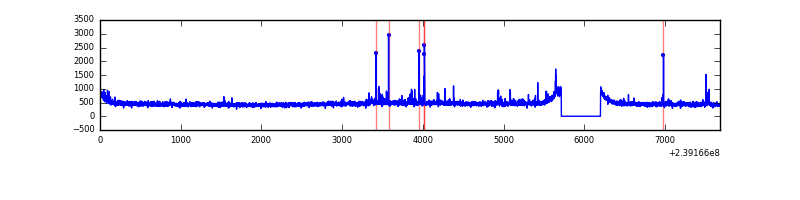 |
| C | 7681 | 7196 | 0 | 0 | 0.00% | 0.00% | 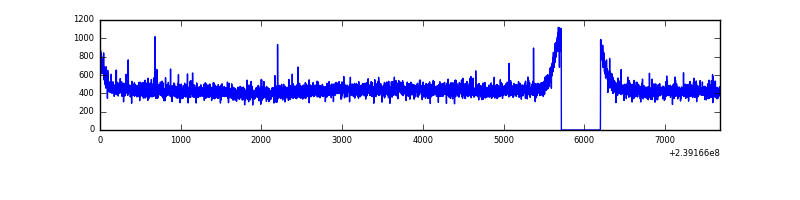 |
| D | 7681 | 7196 | 381 | 381 | 4.96% | 5.29% |  |
Top three noisy pixels from each quadrant. If the there are fewer than three noisy pixels in the level2.evt file, extra rows are filled as -1
| Pixel properties | Quadrant properties | ||||||
|---|---|---|---|---|---|---|---|
| Quadrant | DetID | PixID | Counts | Sigma | Mean | Median | Sigma |
| A | 15 | 174 | 22290 | 126.26 | 831 | 813 | 170.1 |
| A | 8 | 15 | 8598 | 45.77 | 831 | 813 | 170.1 |
| A | 0 | 226 | 7707 | 40.53 | 831 | 813 | 170.1 |
| B | 4 | 239 | 36843 | 221.54 | 841 | 822 | 162.6 |
| B | 0 | 214 | 21569 | 127.6 | 841 | 822 | 162.6 |
| B | 4 | 81 | 20205 | 119.21 | 841 | 822 | 162.6 |
| C | 13 | 61 | 6225 | 28.32 | 815 | 819 | 190.9 |
| C | 7 | 247 | 5898 | 26.61 | 815 | 819 | 190.9 |
| C | 14 | 67 | 5359 | 23.79 | 815 | 819 | 190.9 |
| D | 10 | 253 | 907176 | 4442.32 | 777 | 756 | 204.0 |
| D | 1 | 52 | 306549 | 1498.68 | 777 | 756 | 204.0 |
| D | 2 | 152 | 170170 | 830.29 | 777 | 756 | 204.0 |
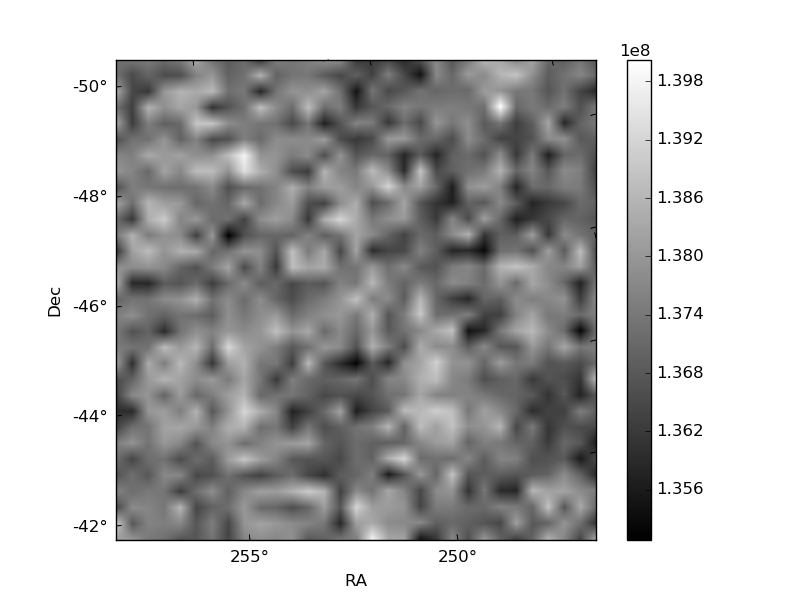
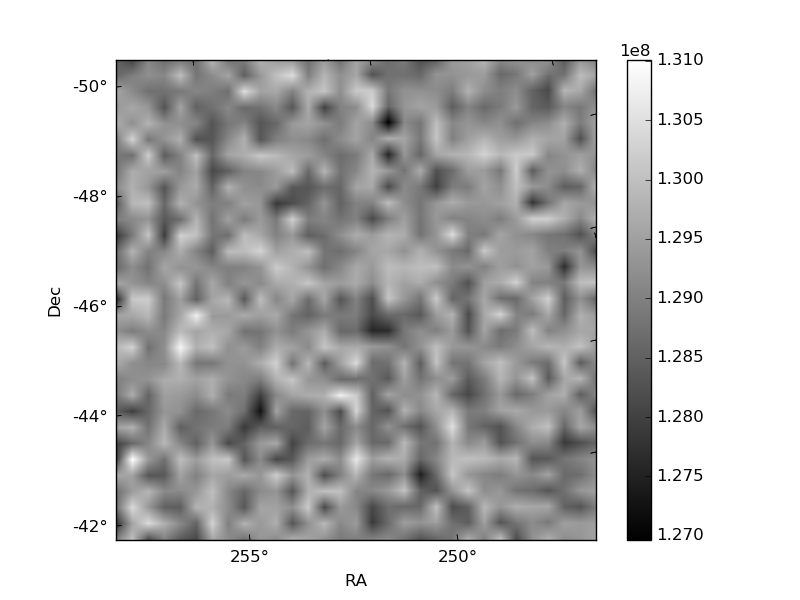
Histogram calculated using DETX and DETY for each event in the final _common_clean file
| Quadrant A | 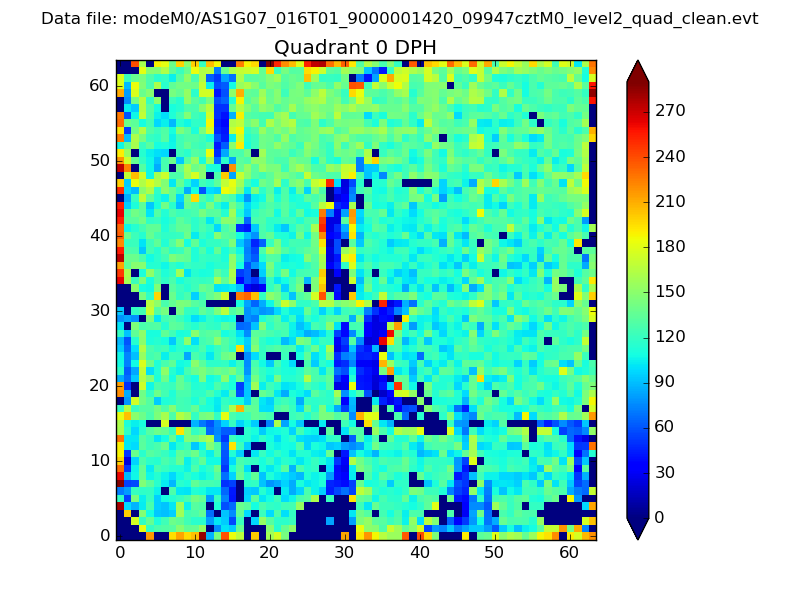 |
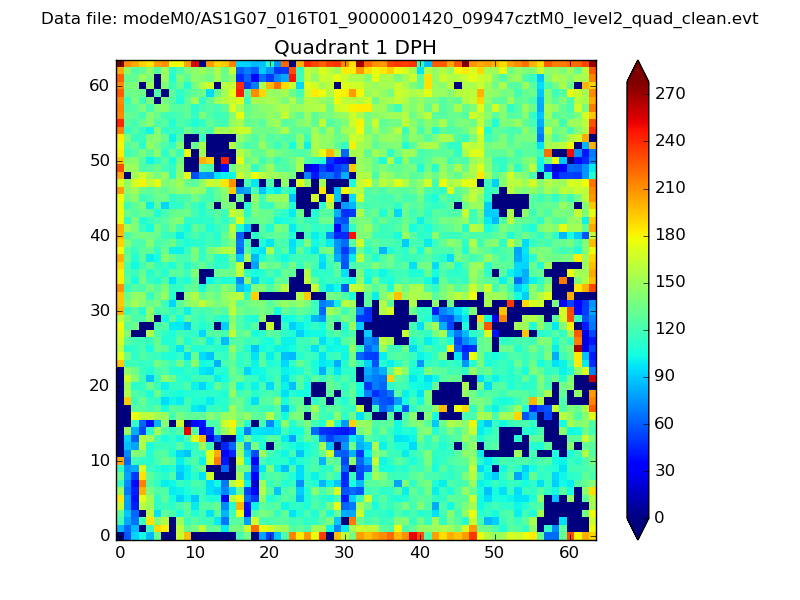 |
Quadrant B |
|---|---|---|---|
| Quadrant D |  |
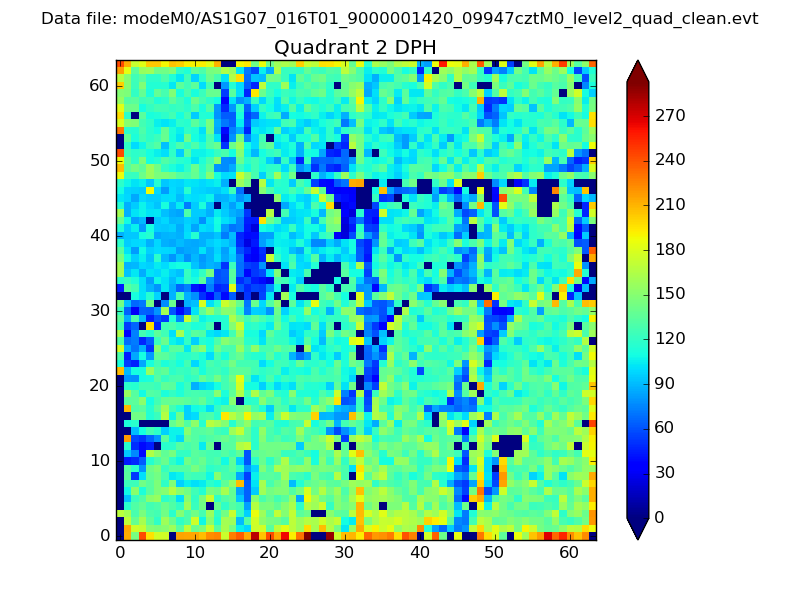 |
Quadrant C |
| Plot type | Count rate plots | Images |
|---|---|---|
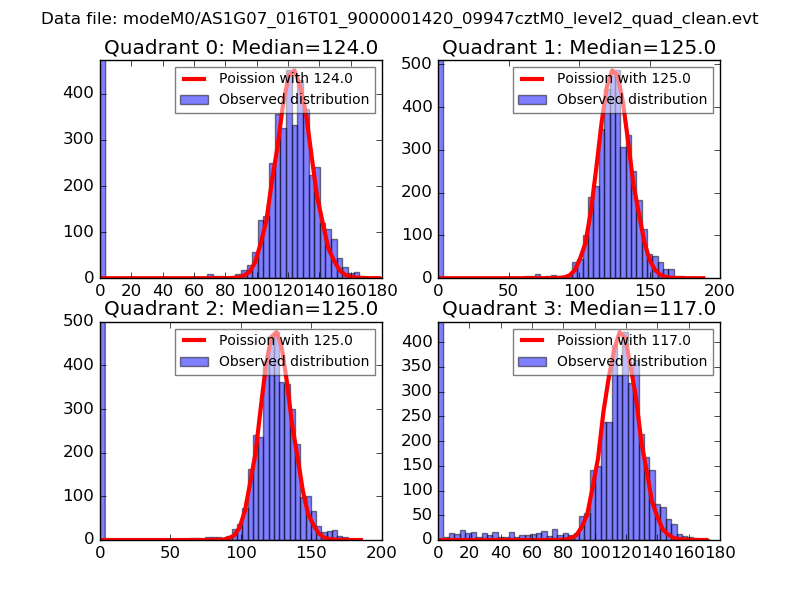
| Comparison with Poisson distribution Blue bars denote a histogram of data divided into 1 sec bins. Red curve is a Poisson curve with rate = median count rate of data. |
 |
 |
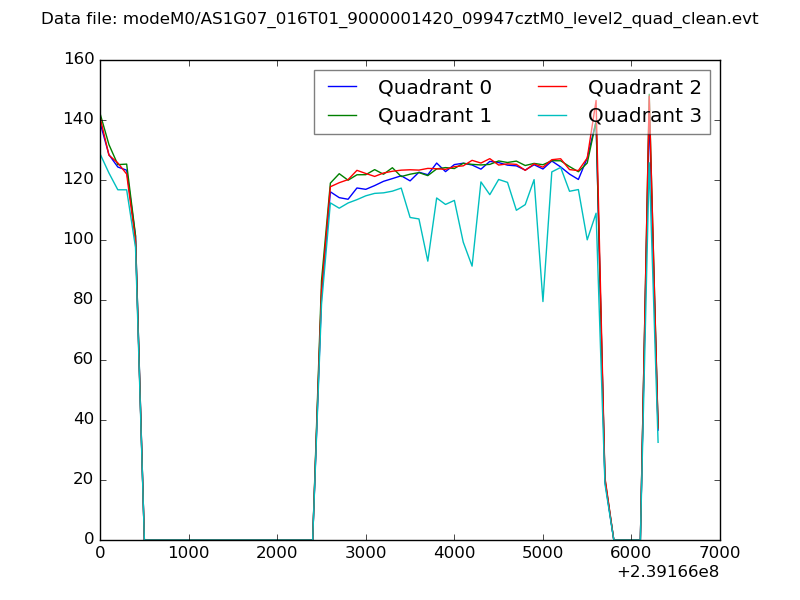
| Quadrant-wise count rates Data is divided into 100 sec bins |
 |
|
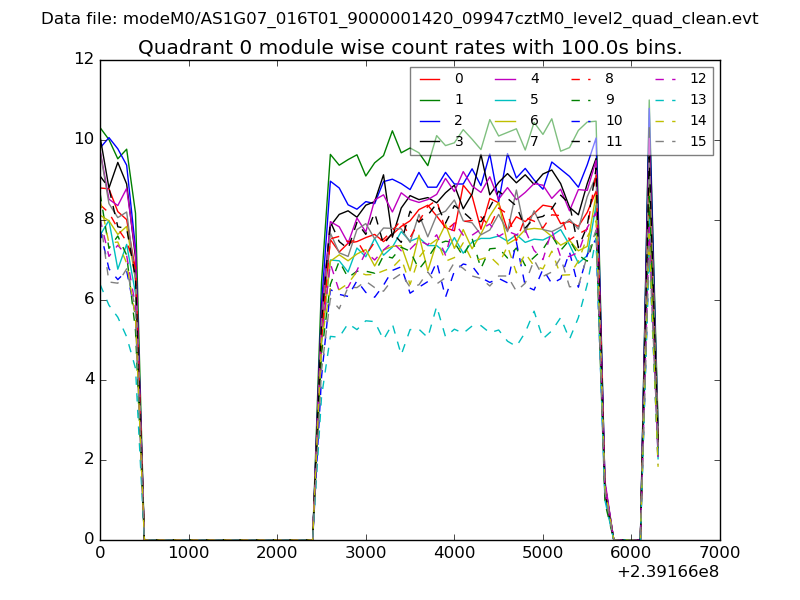
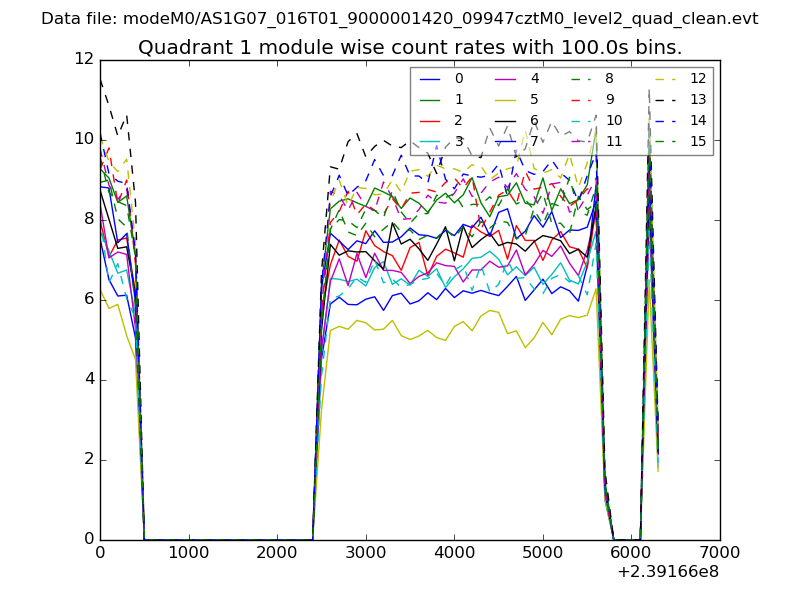
| Module-wise count rates for Quadrant A Data is divided into 100 sec bins |
 |
 |
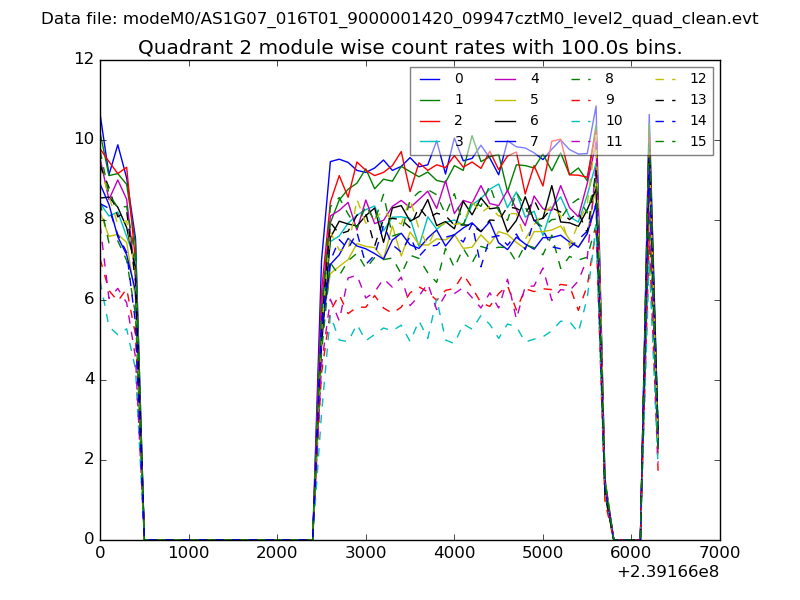
| Module-wise count rates for Quadrant B Data is divided into 100 sec bins |
 |
 |
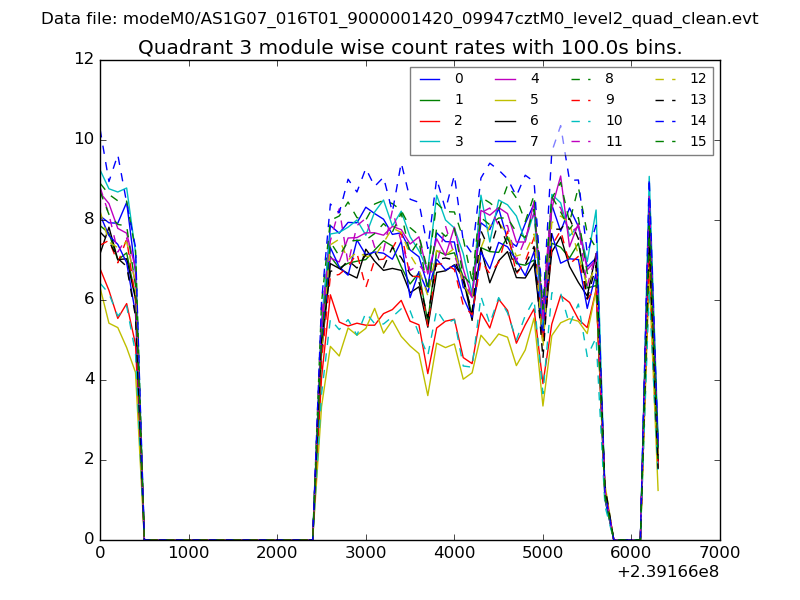
| Module-wise count rates for Quadrant C Data is divided into 100 sec bins |
 |
 |
| Module-wise count rates for Quadrant D Data is divided into 100 sec bins |
 |
 |
| Parameter | Plot |
|---|---|
| CZT HV Monitor | 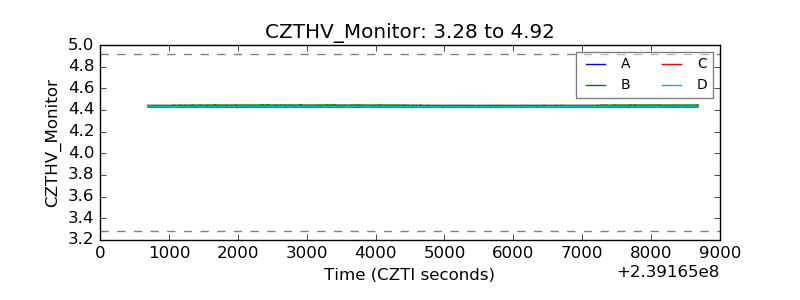 |
| D_VDD | 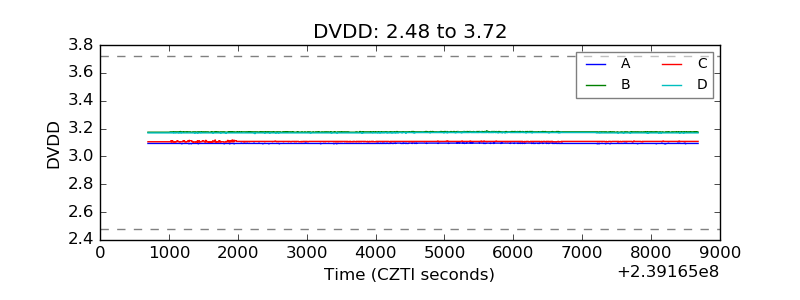 |
| Temperature 1 |  |
| Veto HV Monitor | 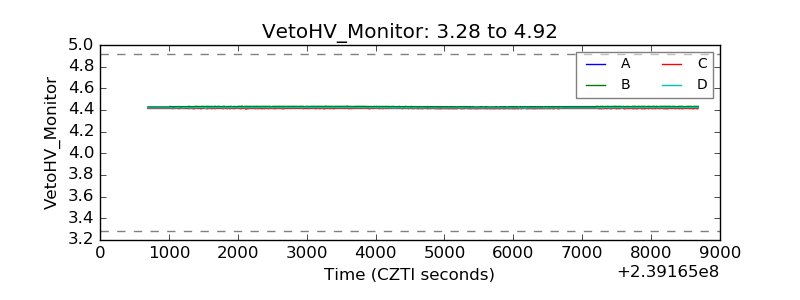 |
| Veto LLD | 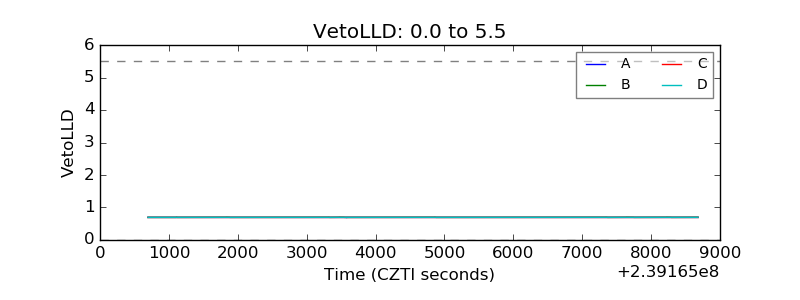 |
| Alpha Counter | 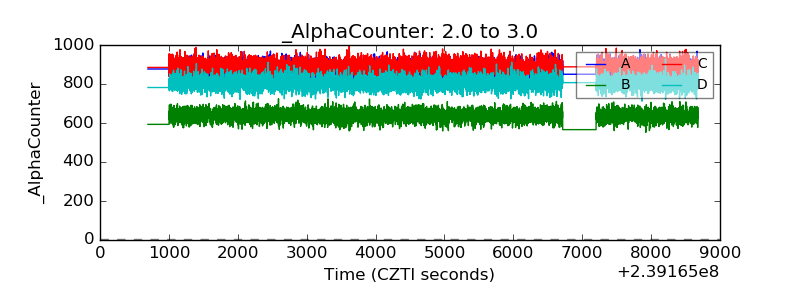 |
| _CPM_Rate | 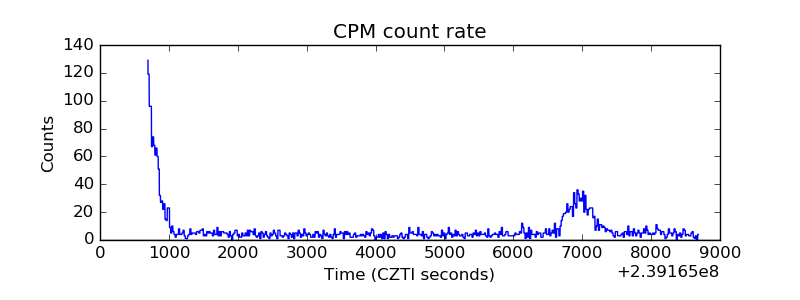 |
| CZT Counter | 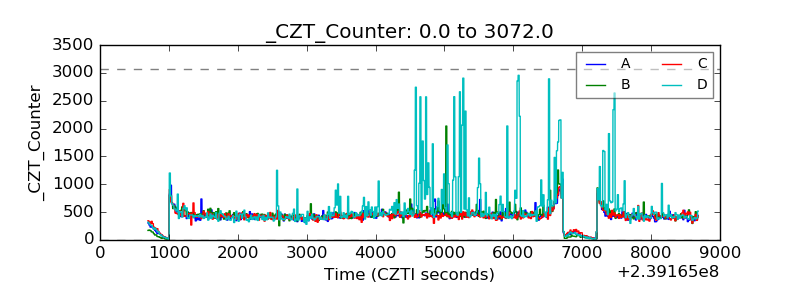 |
| +2.5 Volts monitor | 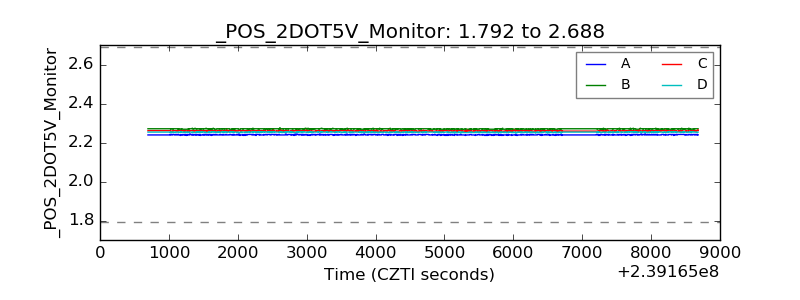 |
| +5 Volts monitor |  |
| _ROLL_ROT | 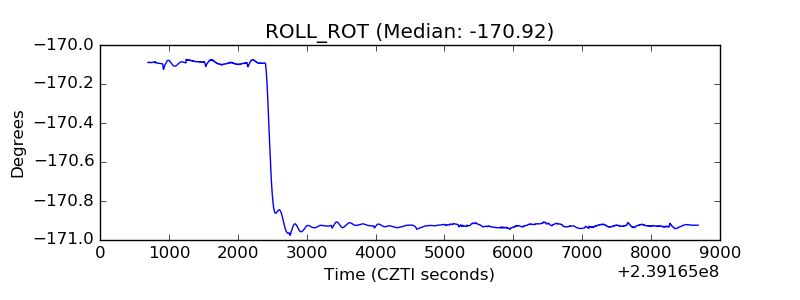 |
| _Roll_DEC | 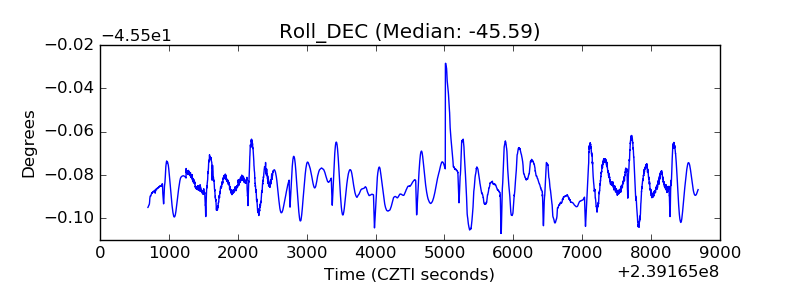 |
| _Roll_RA | 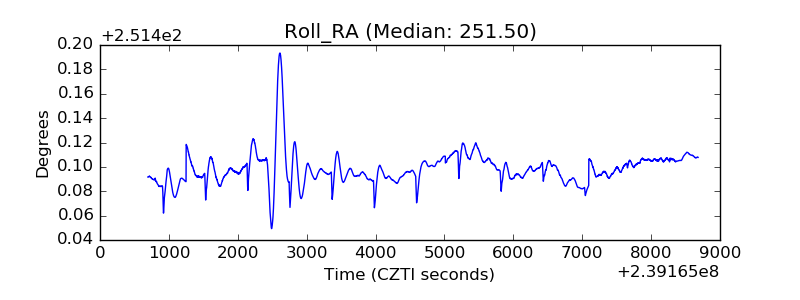 |
| Veto Counter | 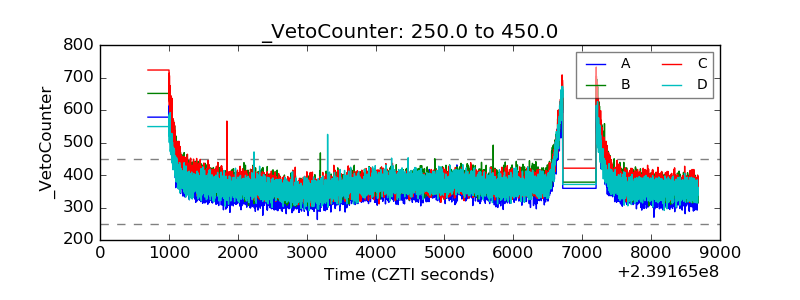 |