| Param | Original file | Final file |
|---|---|---|
| Filename | modeM0/AS1G07_016T01_9000001420_09949cztM0_level2.evt | modeM0/AS1G07_016T01_9000001420_09949cztM0_level2_quad_clean.evt |
| Size (bytes) | 476,352,000 | 71,219,520 |
| Size | 454.3 MB | 67.9 MB |
| Events in quadrant A | 3,101,935 | 427,339 |
| Events in quadrant B | 3,257,969 | 432,578 |
| Events in quadrant C | 3,022,322 | 431,486 |
| Events in quadrant D | 4,590,443 | 400,557 |
| Mode SS | |||
|---|---|---|---|
| Quadrant | BADHDUFLAG | Total packets | Discarded packets |
| A | 0 | 168 | 26 |
| B | 0 | 168 | 24 |
| C | 0 | 168 | 28 |
| D | 0 | 168 | 28 |
| Mode M0 | |||
|---|---|---|---|
| Quadrant | BADHDUFLAG | Total packets | Discarded packets |
| A | 0 | 17338 | 3398 |
| B | 0 | 17513 | 3406 |
| C | 0 | 17241 | 3429 |
| D | 0 | 23028 | 5215 |
| Mode M9 | |||
|---|---|---|---|
| Quadrant | BADHDUFLAG | Total packets | Discarded packets |
| A | 0 | 2 | 0 |
| B | 0 | 2 | 0 |
| C | 0 | 2 | 0 |
| D | 0 | 2 | 0 |
| Quadrant | Total seconds | Saturated seconds | Saturation percentage |
|---|---|---|---|
| A | 6695 | 197 | 2.942494% |
| B | 6685 | 236 | 3.530292% |
| C | 6679 | 181 | 2.709987% |
| D | 6473 | 346 | 5.345280% |
Noise dominated data is calculated using 1-second bins in cleaned event files. If a bin has >2000 counts, and if more than 50% of those come from <1% of pixels, then it is considered to be noise-dominated and hence unusable.
| Quadrant | # 1 sec bins | Bins with >0 counts | Bins with >2000 counts | High rate bins dominated by noise | Noise dominated (total time) | Noise dominated (detector-on time) | Marked lightcurve |
|---|---|---|---|---|---|---|---|
| A | 8475 | 7275 | 2 | 2 | 0.02% | 0.03% | 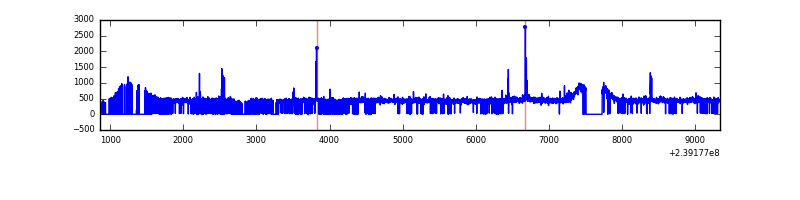 |
| B | 8470 | 7256 | 3 | 3 | 0.04% | 0.04% | 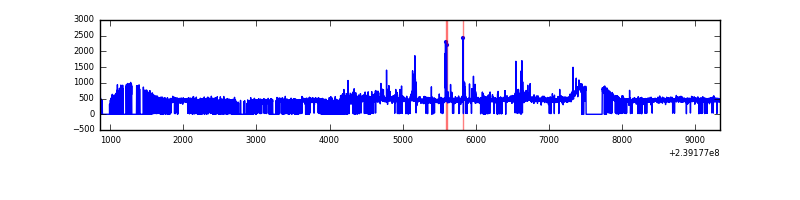 |
| C | 8475 | 7290 | 0 | 0 | 0.00% | 0.00% | 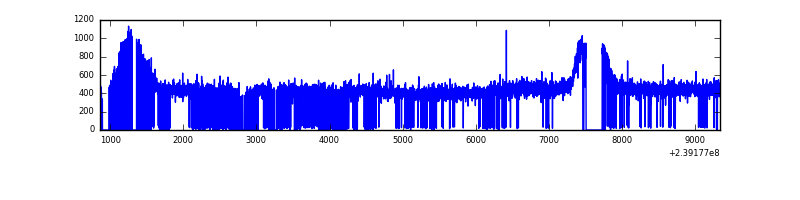 |
| D | 8475 | 7091 | 176 | 176 | 2.08% | 2.48% | 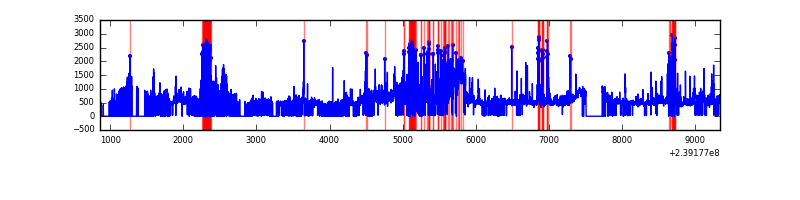 |
Top three noisy pixels from each quadrant. If the there are fewer than three noisy pixels in the level2.evt file, extra rows are filled as -1
| Pixel properties | Quadrant properties | ||||||
|---|---|---|---|---|---|---|---|
| Quadrant | DetID | PixID | Counts | Sigma | Mean | Median | Sigma |
| A | 15 | 174 | 43704 | 263.57 | 785 | 765 | 162.9 |
| A | 8 | 15 | 16183 | 94.64 | 785 | 765 | 162.9 |
| A | 14 | 111 | 9526 | 53.78 | 785 | 765 | 162.9 |
| B | 4 | 239 | 37949 | 242.13 | 790 | 766 | 153.6 |
| B | 0 | 214 | 35679 | 227.35 | 790 | 766 | 153.6 |
| B | 0 | 219 | 34900 | 222.28 | 790 | 766 | 153.6 |
| C | 8 | 128 | 9045 | 46.07 | 769 | 772 | 179.5 |
| C | 13 | 61 | 5771 | 27.84 | 769 | 772 | 179.5 |
| C | 8 | 112 | 5409 | 25.82 | 769 | 772 | 179.5 |
| D | 2 | 16 | 884935 | 4720.55 | 729 | 707 | 187.3 |
| D | 8 | 195 | 310991 | 1656.49 | 729 | 707 | 187.3 |
| D | 2 | 152 | 227824 | 1212.49 | 729 | 707 | 187.3 |
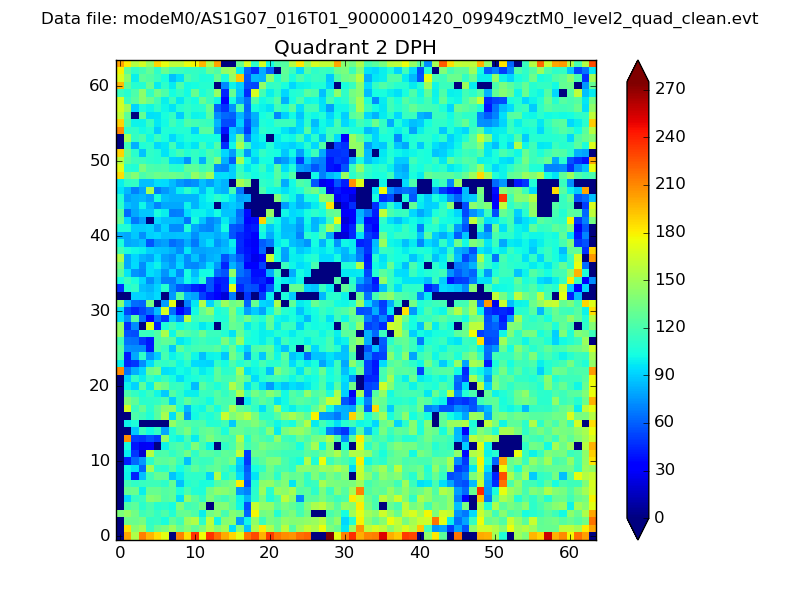
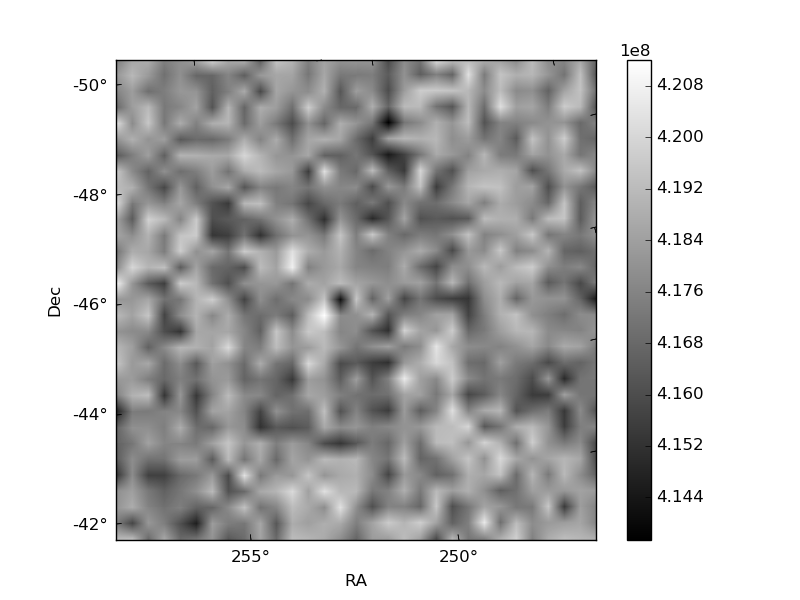
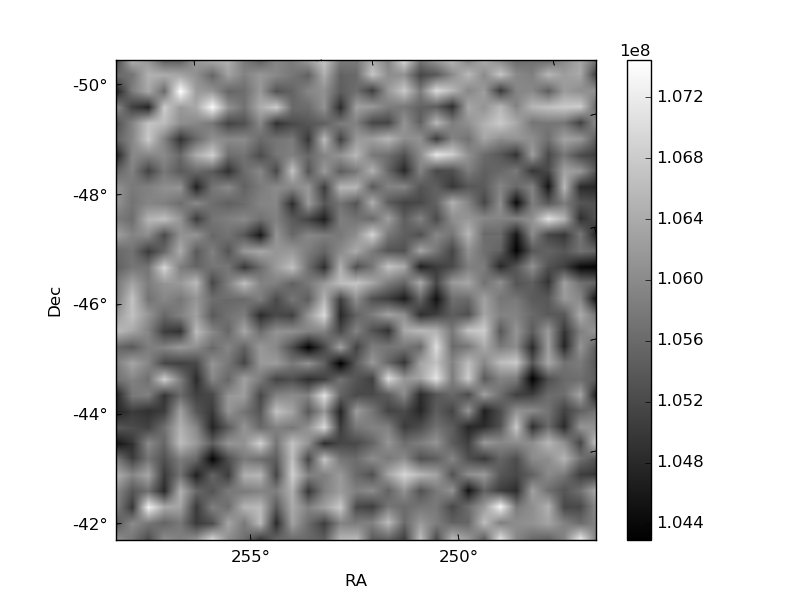
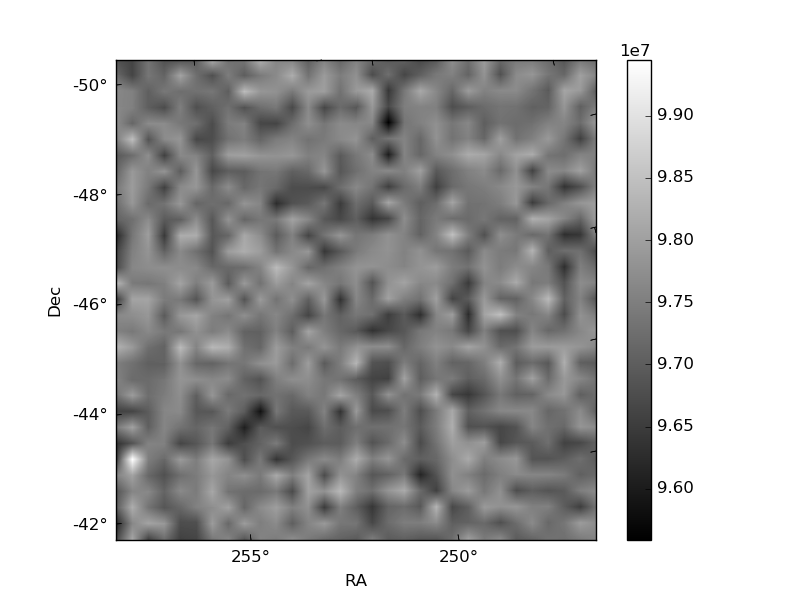
Histogram calculated using DETX and DETY for each event in the final _common_clean file
| Quadrant A | 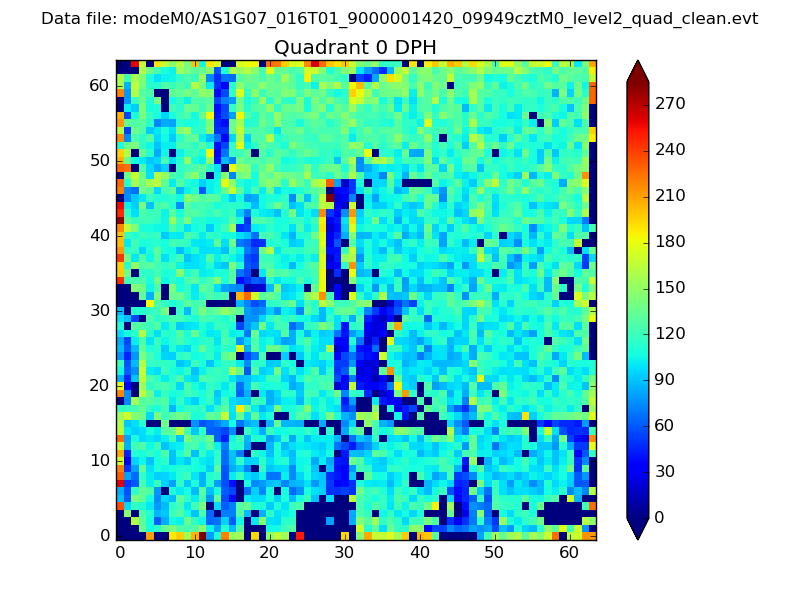 |
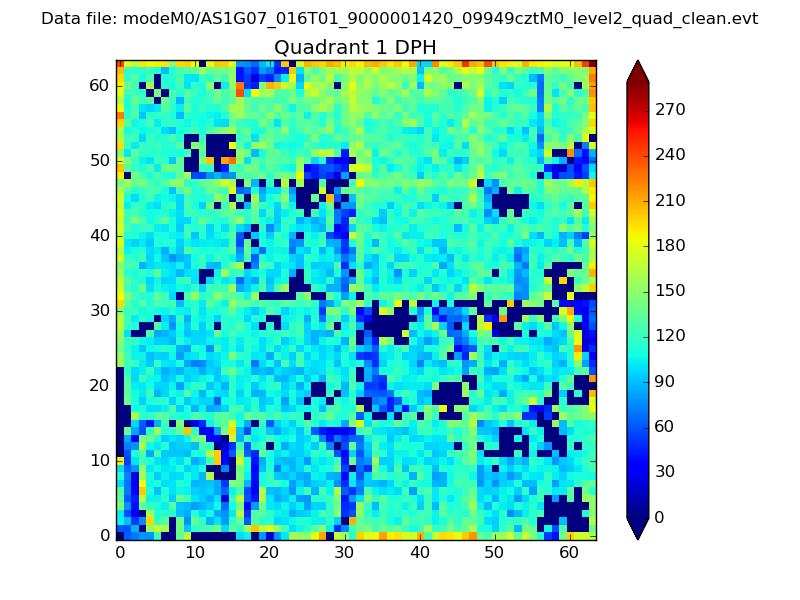 |
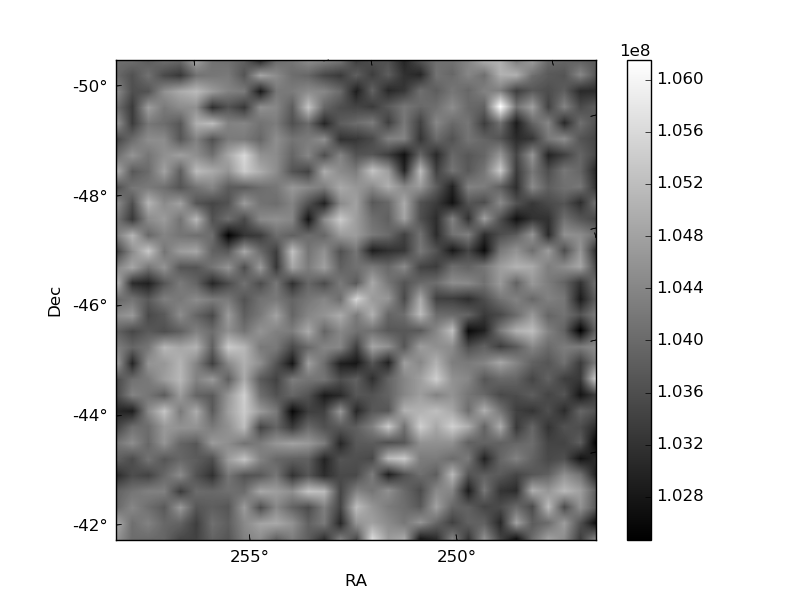
Quadrant B |
|---|---|---|---|
| Quadrant D | 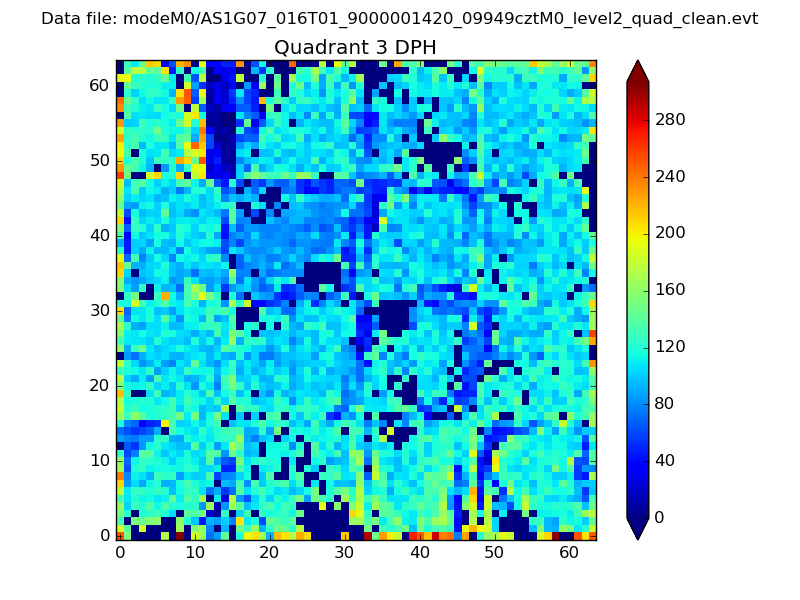 |
 |
Quadrant C |
| Plot type | Count rate plots | Images |
|---|---|---|
| Comparison with Poisson distribution Blue bars denote a histogram of data divided into 1 sec bins. Red curve is a Poisson curve with rate = median count rate of data. |
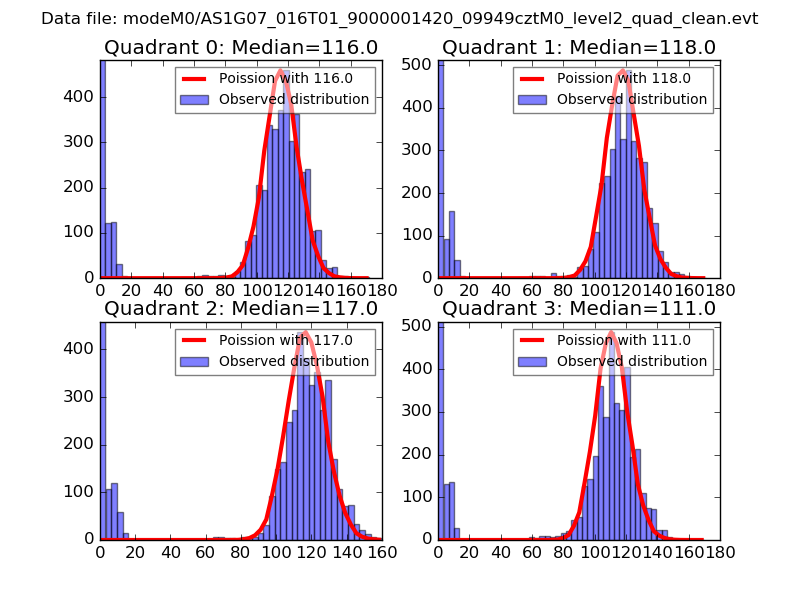 |
 |
| Quadrant-wise count rates Data is divided into 100 sec bins |
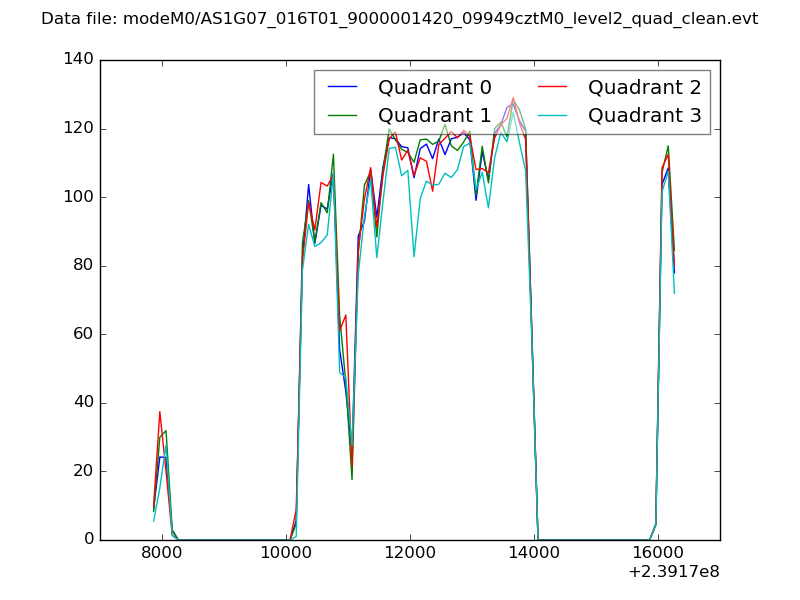 |
|
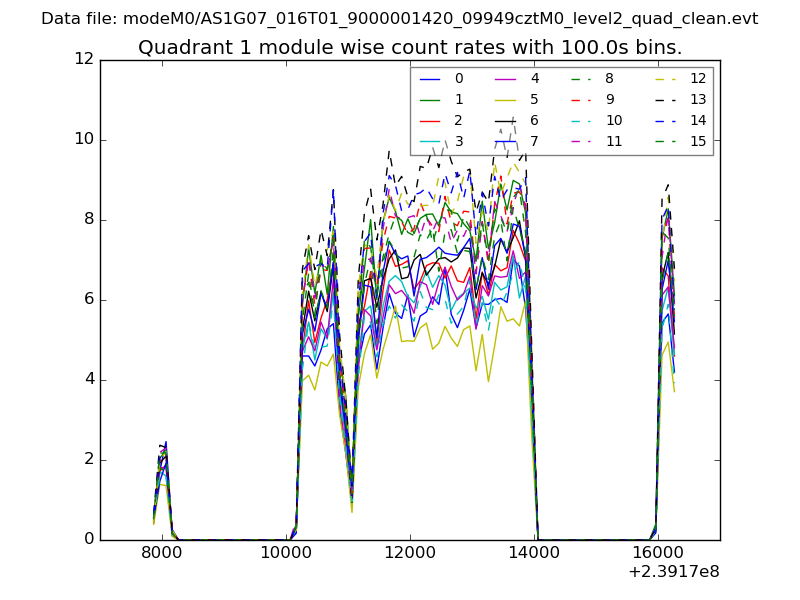
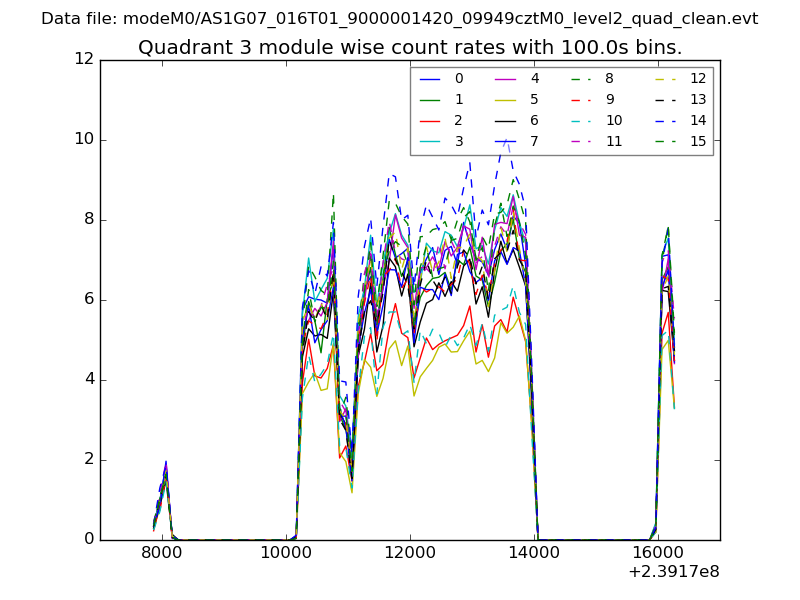
| Module-wise count rates for Quadrant A Data is divided into 100 sec bins |
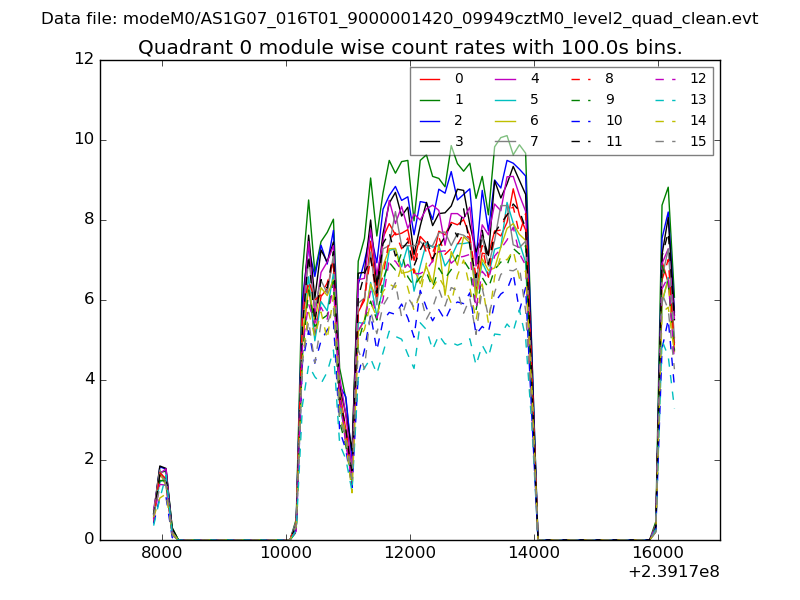 |
 |
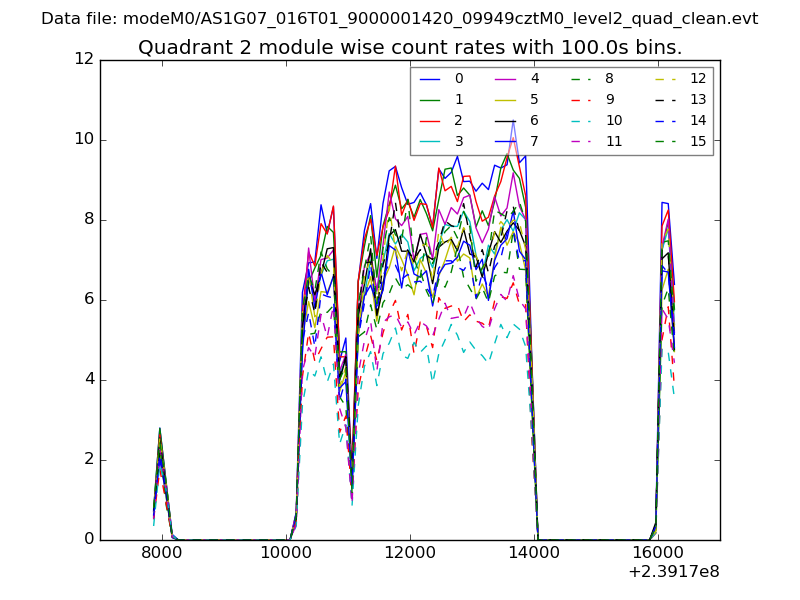
| Module-wise count rates for Quadrant B Data is divided into 100 sec bins |
 |
 |
| Module-wise count rates for Quadrant C Data is divided into 100 sec bins |
 |
 |
| Module-wise count rates for Quadrant D Data is divided into 100 sec bins |
 |
 |
| Parameter | Plot |
|---|---|
| CZT HV Monitor | 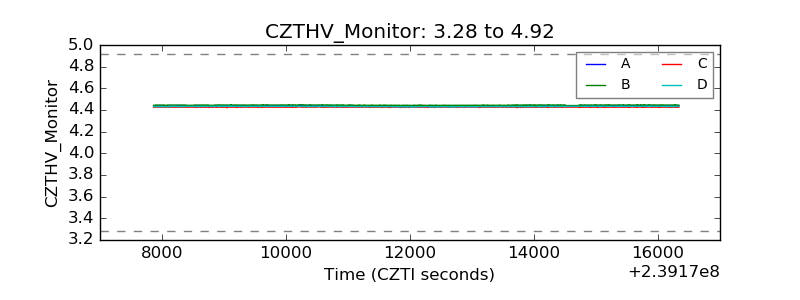 |
| D_VDD | 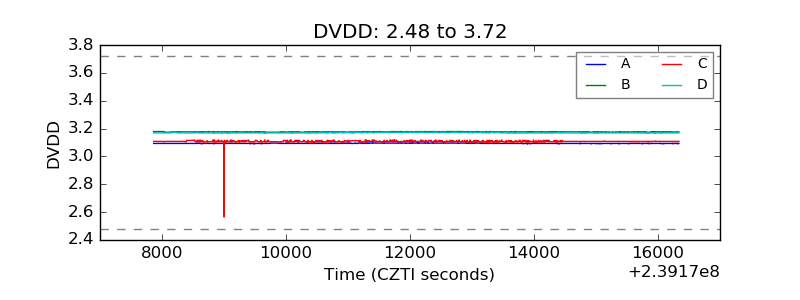 |
| Temperature 1 | 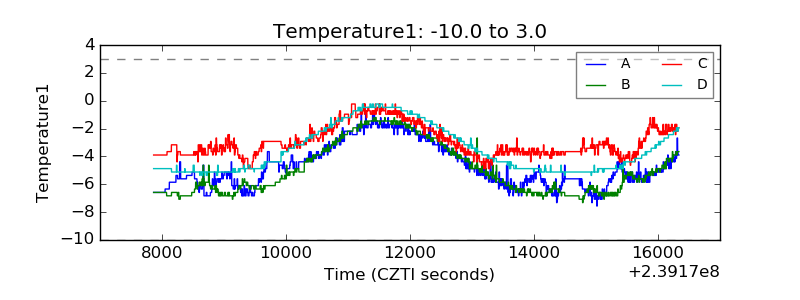 |
| Veto HV Monitor | 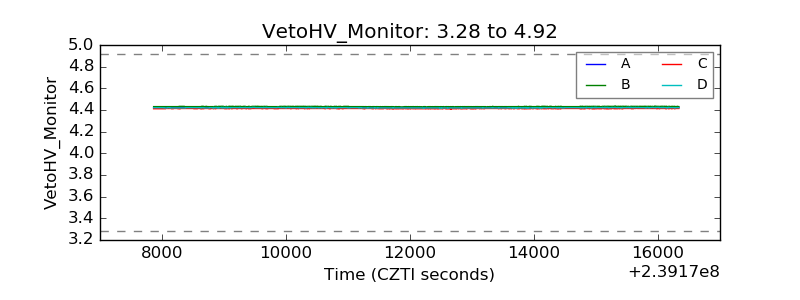 |
| Veto LLD | 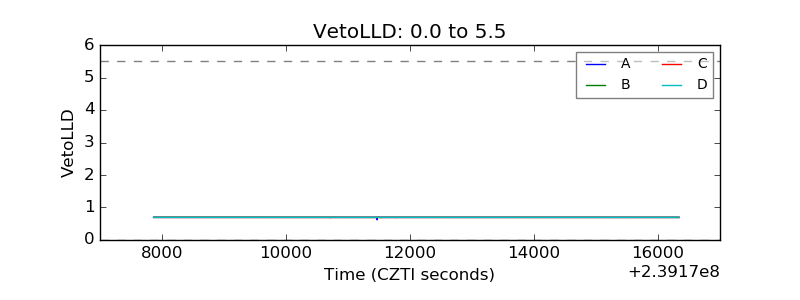 |
| Alpha Counter | 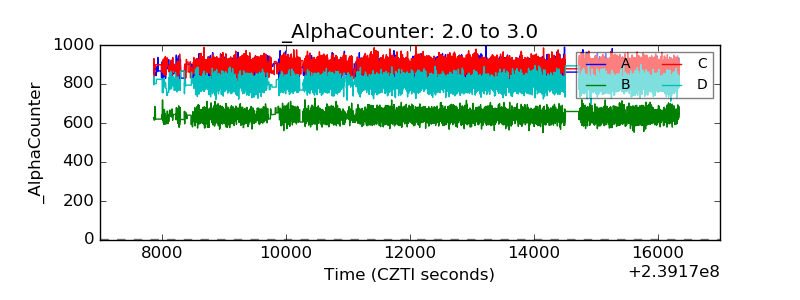 |
| _CPM_Rate | 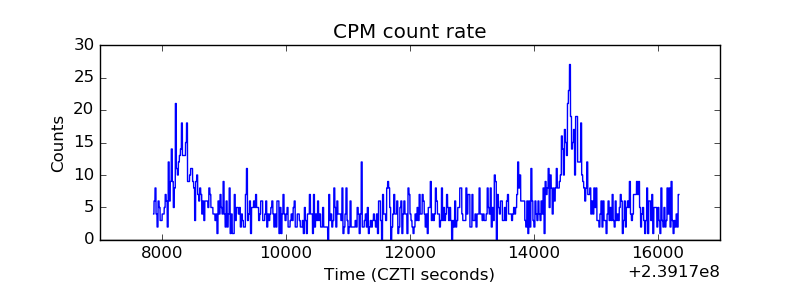 |
| CZT Counter | 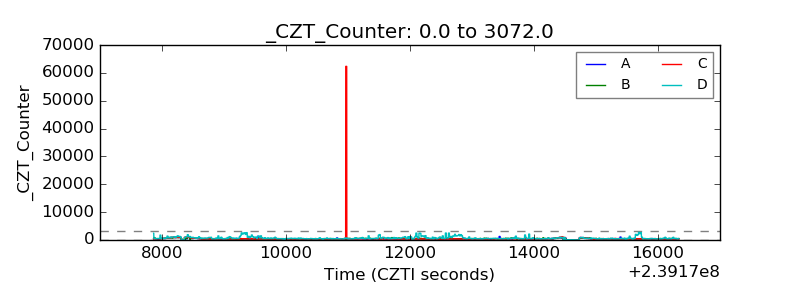 |
| +2.5 Volts monitor |  |
| +5 Volts monitor | 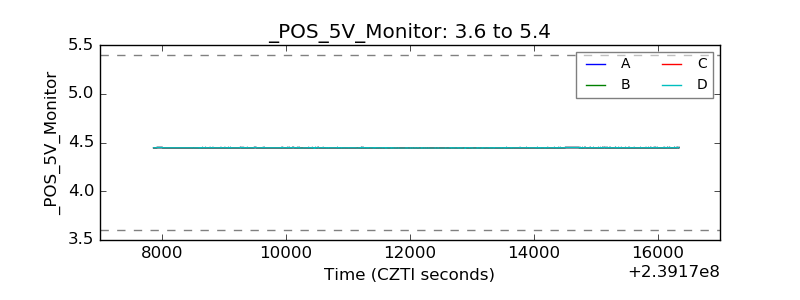 |
| _ROLL_ROT | 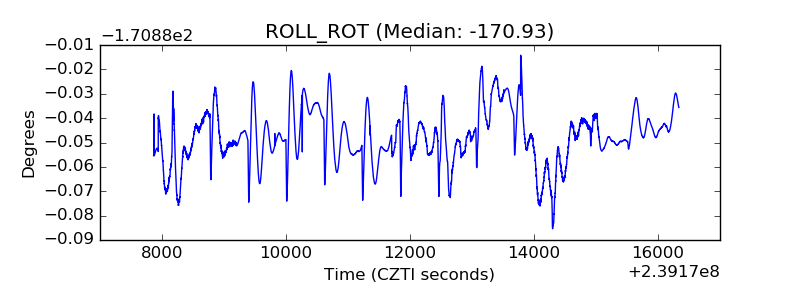 |
| _Roll_DEC | 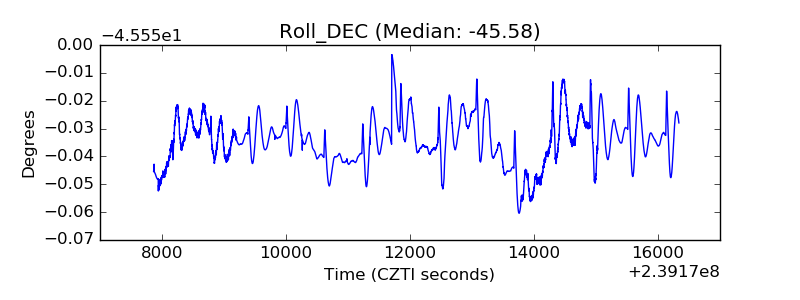 |
| _Roll_RA | 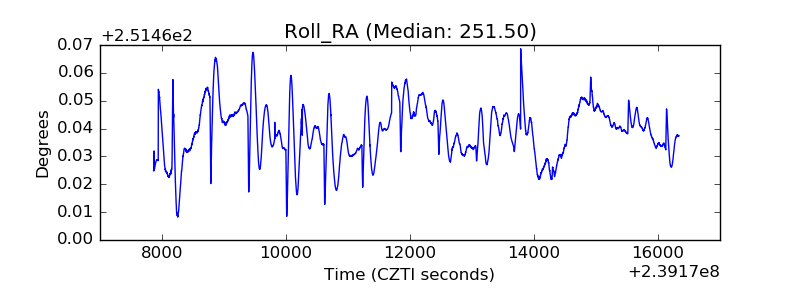 |
| Veto Counter | 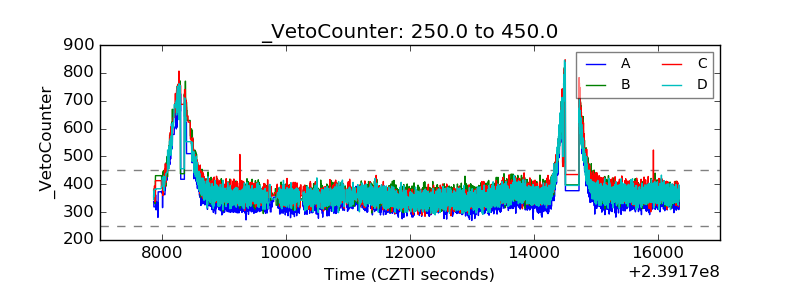 |