| Param | Original file | Final file |
|---|---|---|
| Filename | modeM0/AS1G07_016T01_9000001420_09951cztM0_level2.evt | modeM0/AS1G07_016T01_9000001420_09951cztM0_level2_quad_clean.evt |
| Size (bytes) | 830,767,680 | 152,421,120 |
| Size | 792.3 MB | 145.4 MB |
| Events in quadrant A | 5,474,302 | 962,102 |
| Events in quadrant B | 5,959,587 | 968,182 |
| Events in quadrant C | 5,167,302 | 975,428 |
| Events in quadrant D | 7,768,803 | 904,989 |
| Mode SS | |||
|---|---|---|---|
| Quadrant | BADHDUFLAG | Total packets | Discarded packets |
| A | 0 | 278 | 36 |
| B | 0 | 278 | 32 |
| C | 0 | 277 | 41 |
| D | 0 | 278 | 42 |
| Mode M0 | |||
|---|---|---|---|
| Quadrant | BADHDUFLAG | Total packets | Discarded packets |
| A | 0 | 28181 | 4073 |
| B | 0 | 29445 | 4213 |
| C | 0 | 27667 | 3906 |
| D | 0 | 35786 | 5329 |
| Mode M9 | |||
|---|---|---|---|
| Quadrant | BADHDUFLAG | Total packets | Discarded packets |
| A | 0 | 13 | 1 |
| B | 0 | 13 | 4 |
| C | 0 | 13 | 1 |
| D | 0 | 13 | 2 |
| Quadrant | Total seconds | Saturated seconds | Saturation percentage |
|---|---|---|---|
| A | 11643 | 180 | 1.545993% |
| B | 11631 | 253 | 2.175221% |
| C | 11699 | 153 | 1.307804% |
| D | 11525 | 438 | 3.800434% |
Noise dominated data is calculated using 1-second bins in cleaned event files. If a bin has >2000 counts, and if more than 50% of those come from <1% of pixels, then it is considered to be noise-dominated and hence unusable.
| Quadrant | # 1 sec bins | Bins with >0 counts | Bins with >2000 counts | High rate bins dominated by noise | Noise dominated (total time) | Noise dominated (detector-on time) | Marked lightcurve |
|---|---|---|---|---|---|---|---|
| A | 14912 | 12529 | 1 | 1 | 0.01% | 0.01% | 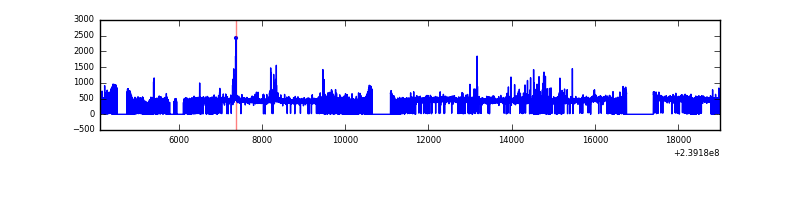 |
| B | 14912 | 12500 | 70 | 70 | 0.47% | 0.56% | 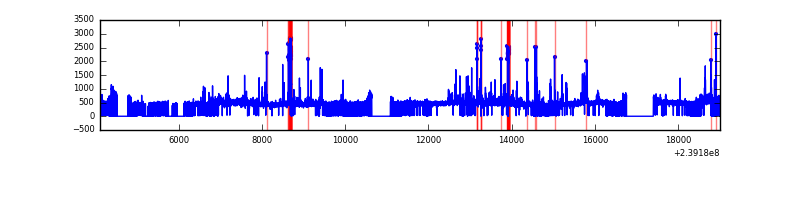 |
| C | 14912 | 12551 | 0 | 0 | 0.00% | 0.00% | 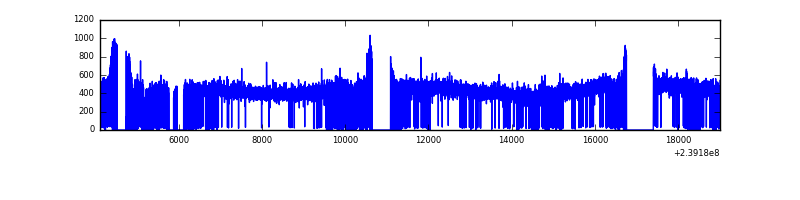 |
| D | 14910 | 12437 | 268 | 268 | 1.80% | 2.15% | 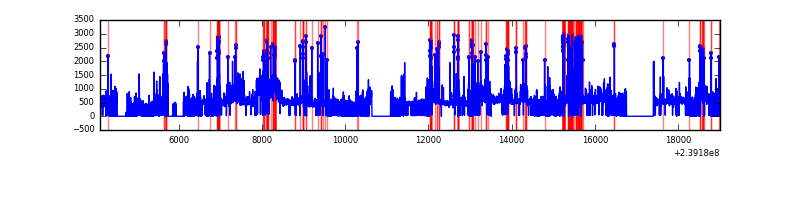 |
Top three noisy pixels from each quadrant. If the there are fewer than three noisy pixels in the level2.evt file, extra rows are filled as -1
| Pixel properties | Quadrant properties | ||||||
|---|---|---|---|---|---|---|---|
| Quadrant | DetID | PixID | Counts | Sigma | Mean | Median | Sigma |
| A | 14 | 254 | 201915 | 724.13 | 1352 | 1322 | 277.0 |
| A | 8 | 15 | 27237 | 93.55 | 1352 | 1322 | 277.0 |
| A | 15 | 174 | 20781 | 70.25 | 1352 | 1322 | 277.0 |
| B | 0 | 214 | 194442 | 751.53 | 1344 | 1311 | 257.0 |
| B | 4 | 81 | 173711 | 670.86 | 1344 | 1311 | 257.0 |
| B | 4 | 239 | 136679 | 526.76 | 1344 | 1311 | 257.0 |
| C | 13 | 61 | 9977 | 28.22 | 1319 | 1322 | 306.7 |
| C | 7 | 247 | 8563 | 23.61 | 1319 | 1322 | 306.7 |
| C | 14 | 67 | 6442 | 16.7 | 1319 | 1322 | 306.7 |
| D | 2 | 16 | 679190 | 2042.77 | 1279 | 1244 | 331.9 |
| D | 8 | 195 | 679151 | 2042.65 | 1279 | 1244 | 331.9 |
| D | 10 | 253 | 457054 | 1373.44 | 1279 | 1244 | 331.9 |
Histogram calculated using DETX and DETY for each event in the final _common_clean file
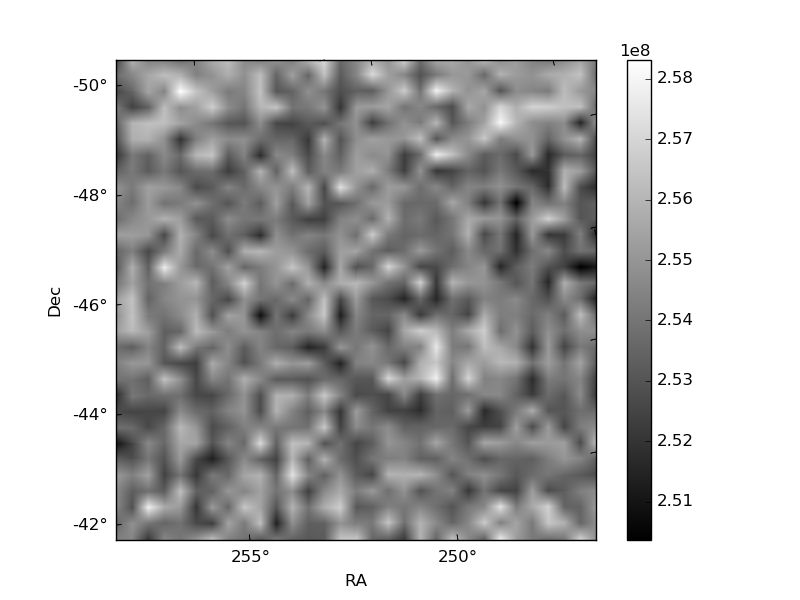
| Quadrant A | 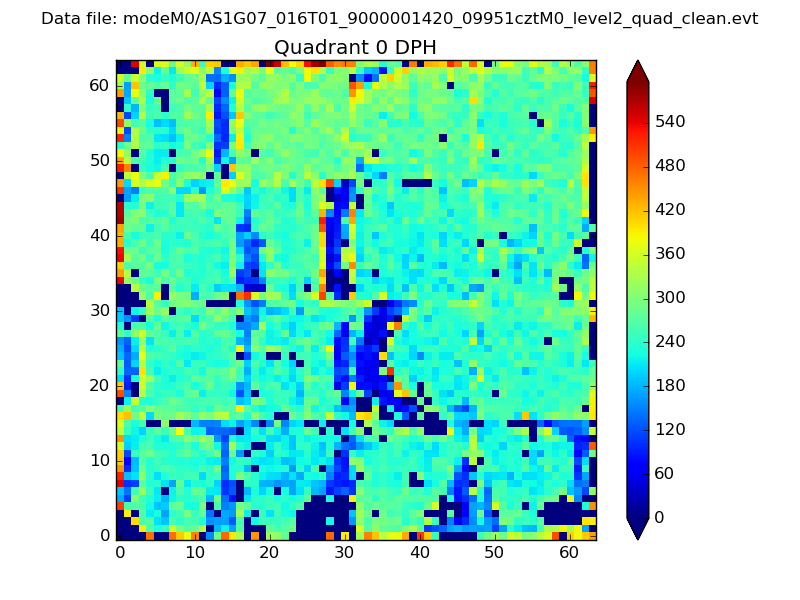 |
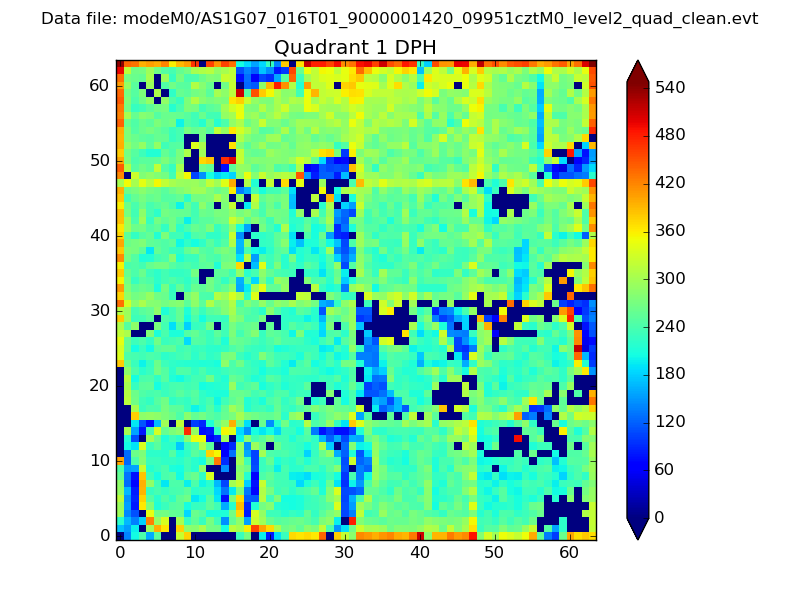 |
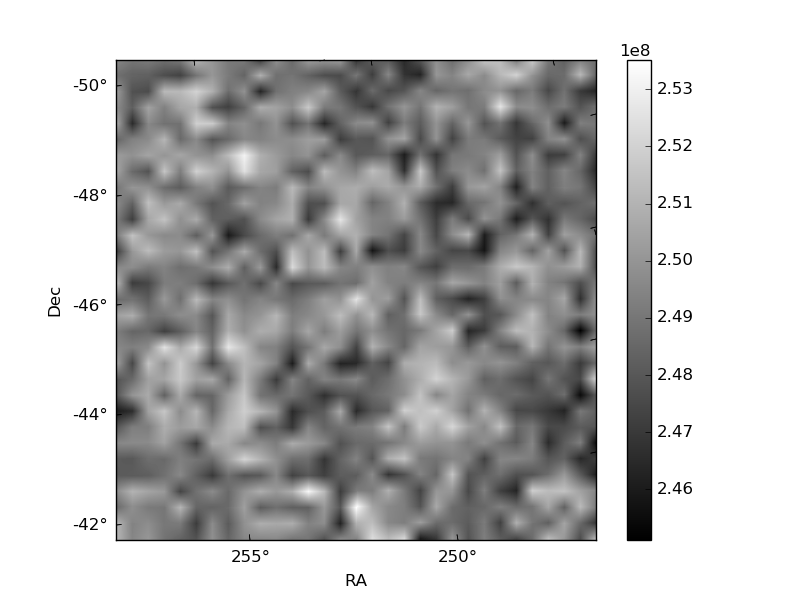
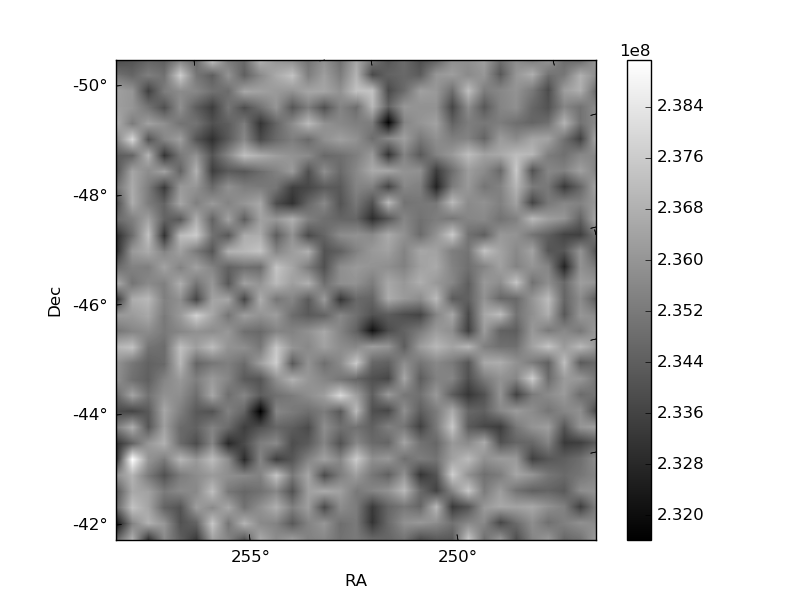
Quadrant B |
|---|---|---|---|
| Quadrant D | 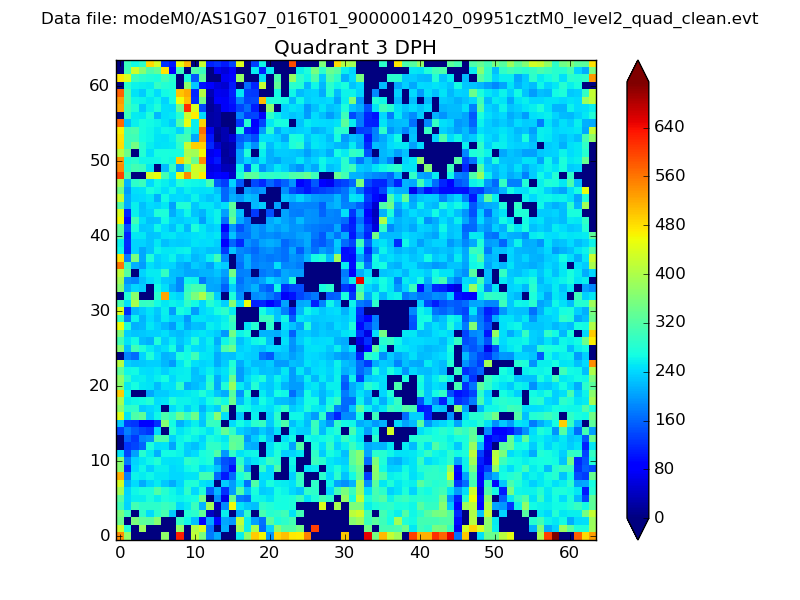 |
 |
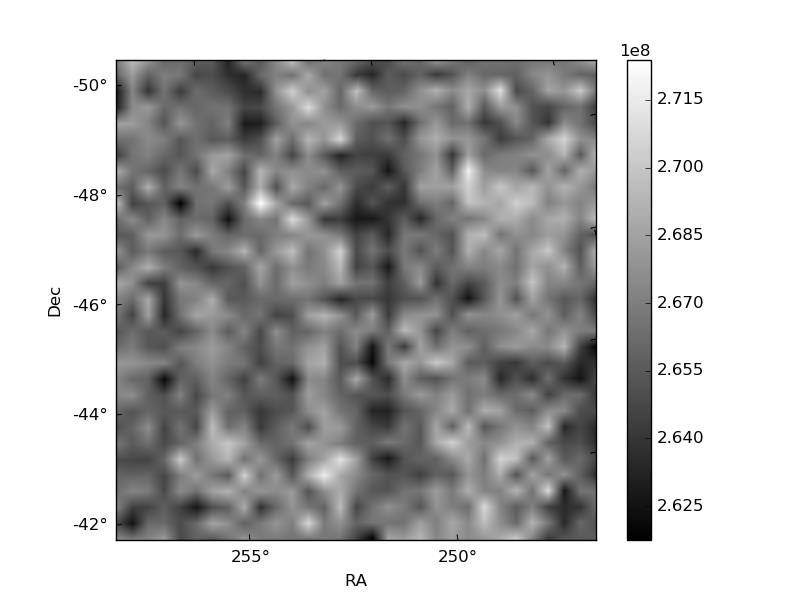
Quadrant C |
| Plot type | Count rate plots | Images |
|---|---|---|
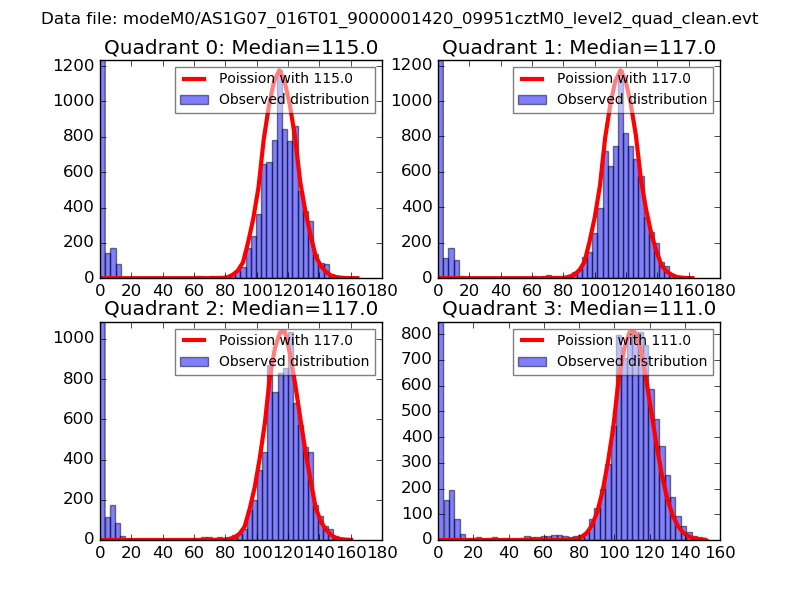
| Comparison with Poisson distribution Blue bars denote a histogram of data divided into 1 sec bins. Red curve is a Poisson curve with rate = median count rate of data. |
 |
 |
| Quadrant-wise count rates Data is divided into 100 sec bins |
 |
|
| Module-wise count rates for Quadrant A Data is divided into 100 sec bins |
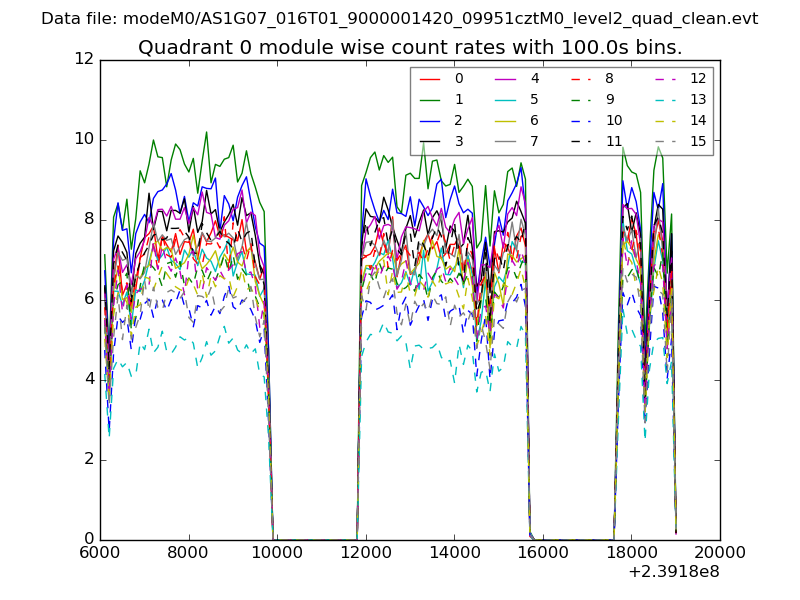 |
 |
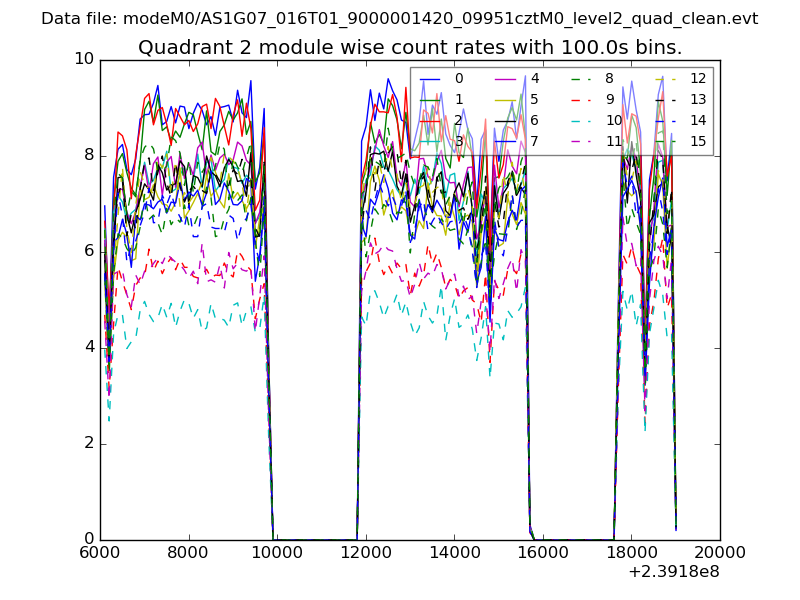
| Module-wise count rates for Quadrant B Data is divided into 100 sec bins |
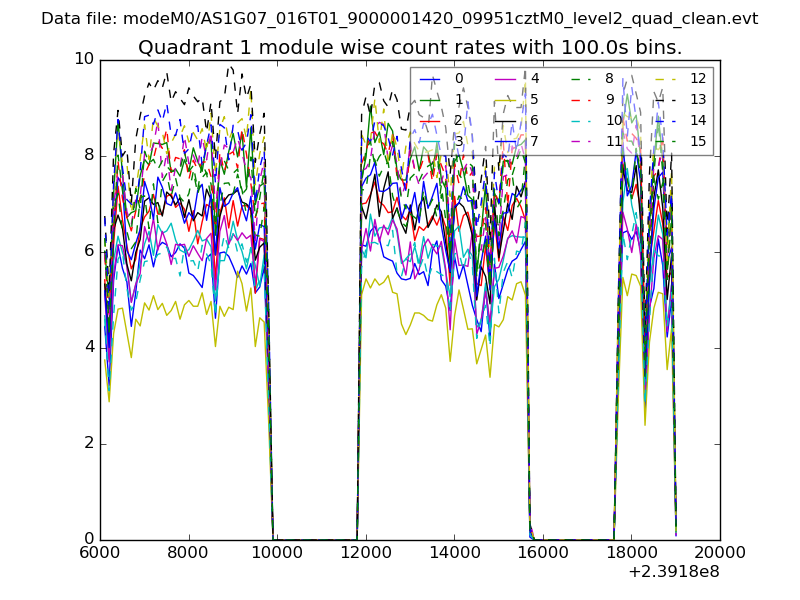 |
 |
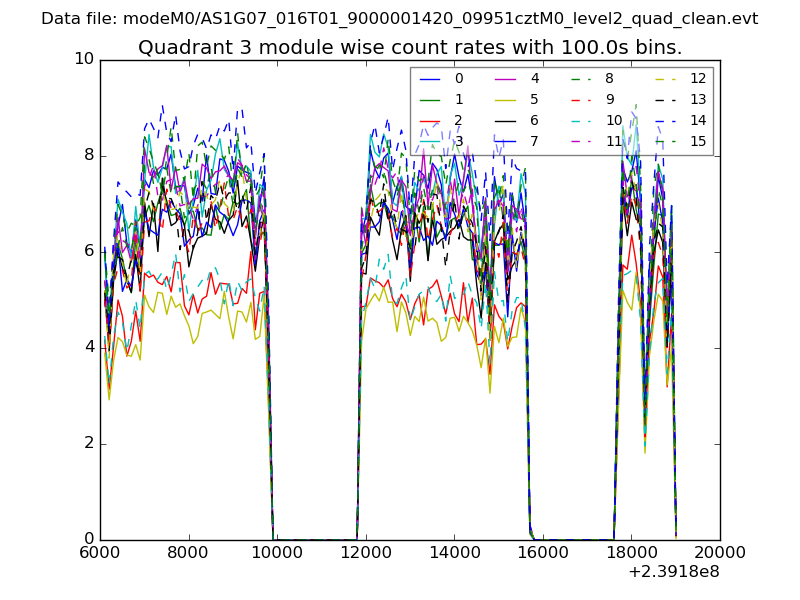
| Module-wise count rates for Quadrant C Data is divided into 100 sec bins |
 |
 |
| Module-wise count rates for Quadrant D Data is divided into 100 sec bins |
 |
 |
| Parameter | Plot |
|---|---|
| CZT HV Monitor | 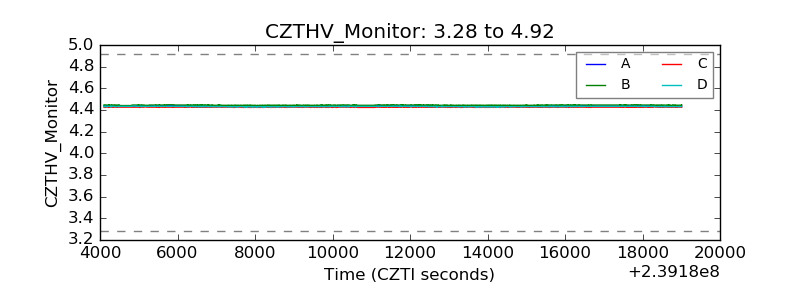 |
| D_VDD | 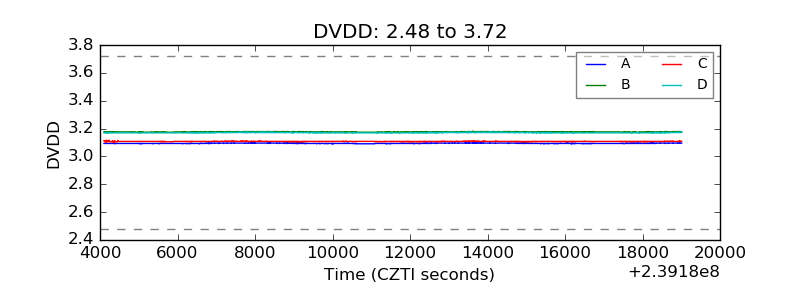 |
| Temperature 1 |  |
| Veto HV Monitor | 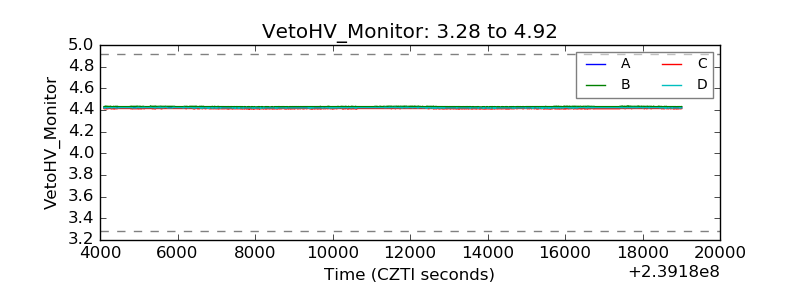 |
| Veto LLD | 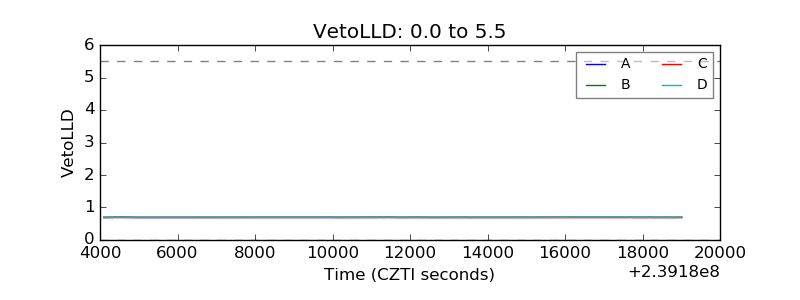 |
| Alpha Counter | 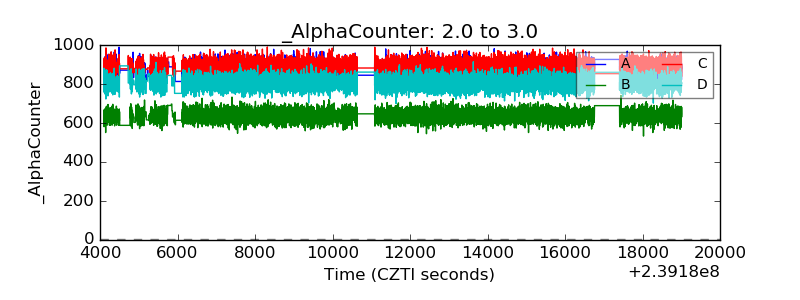 |
| _CPM_Rate |  |
| CZT Counter | 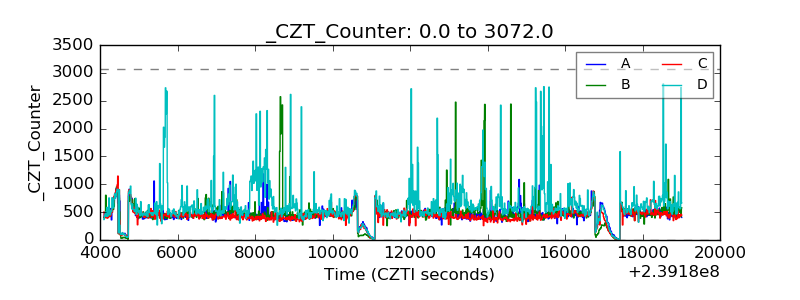 |
| +2.5 Volts monitor |  |
| +5 Volts monitor |  |
| _ROLL_ROT | 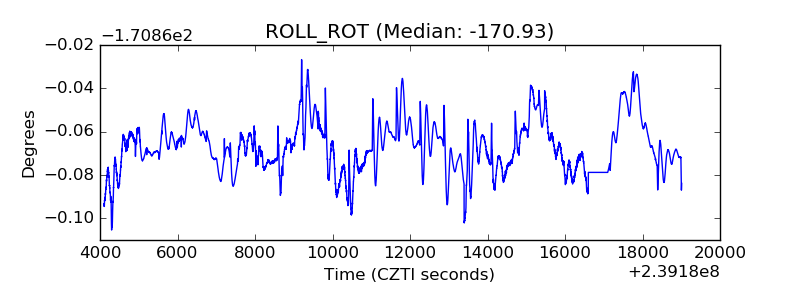 |
| _Roll_DEC | 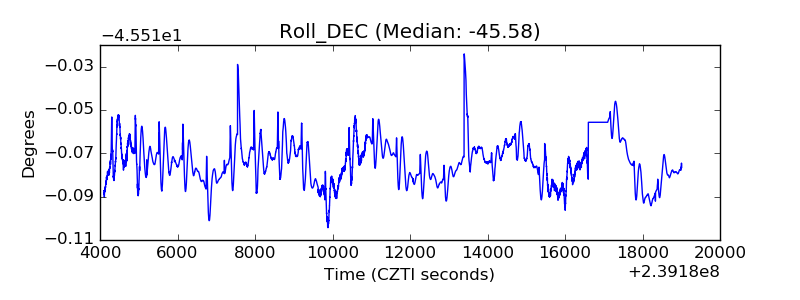 |
| _Roll_RA |  |
| Veto Counter | 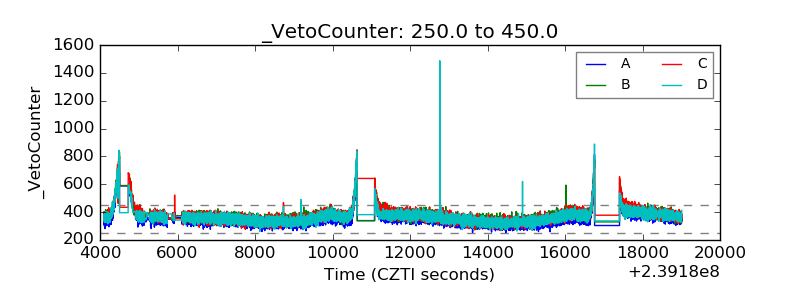 |