| Param | Original file | Final file |
|---|---|---|
| Filename | modeM0/AS1G07_016T01_9000001420_09952cztM0_level2.evt | modeM0/AS1G07_016T01_9000001420_09952cztM0_level2_quad_clean.evt |
| Size (bytes) | 431,616,960 | 81,296,640 |
| Size | 411.6 MB | 77.5 MB |
| Events in quadrant A | 2,878,117 | 525,901 |
| Events in quadrant B | 3,280,402 | 518,885 |
| Events in quadrant C | 2,631,965 | 530,667 |
| Events in quadrant D | 3,896,345 | 490,611 |
| Mode SS | |||
|---|---|---|---|
| Quadrant | BADHDUFLAG | Total packets | Discarded packets |
| A | 0 | 122 | 6 |
| B | 0 | 122 | 0 |
| C | 0 | 122 | 8 |
| D | 0 | 121 | 7 |
| Mode M0 | |||
|---|---|---|---|
| Quadrant | BADHDUFLAG | Total packets | Discarded packets |
| A | 0 | 13253 | 1026 |
| B | 0 | 14702 | 1399 |
| C | 0 | 12716 | 958 |
| D | 0 | 16993 | 1680 |
| Mode M9 | |||
|---|---|---|---|
| Quadrant | BADHDUFLAG | Total packets | Discarded packets |
| A | 0 | 9 | 0 |
| B | 0 | 9 | 0 |
| C | 0 | 9 | 1 |
| D | 0 | 9 | 1 |
| Quadrant | Total seconds | Saturated seconds | Saturation percentage |
|---|---|---|---|
| A | 5674 | 54 | 0.951710% |
| B | 5623 | 138 | 2.454206% |
| C | 5689 | 40 | 0.703111% |
| D | 5604 | 178 | 3.176303% |
Noise dominated data is calculated using 1-second bins in cleaned event files. If a bin has >2000 counts, and if more than 50% of those come from <1% of pixels, then it is considered to be noise-dominated and hence unusable.
| Quadrant | # 1 sec bins | Bins with >0 counts | Bins with >2000 counts | High rate bins dominated by noise | Noise dominated (total time) | Noise dominated (detector-on time) | Marked lightcurve |
|---|---|---|---|---|---|---|---|
| A | 6943 | 5958 | 0 | 0 | 0.00% | 0.00% | 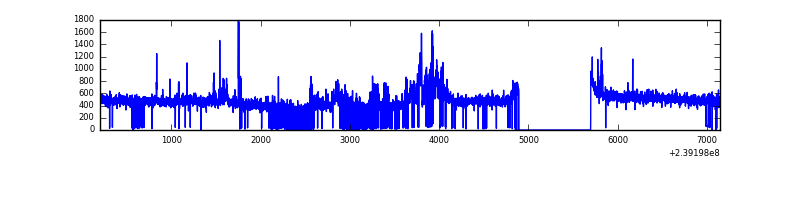 |
| B | 6942 | 5911 | 64 | 64 | 0.92% | 1.08% | 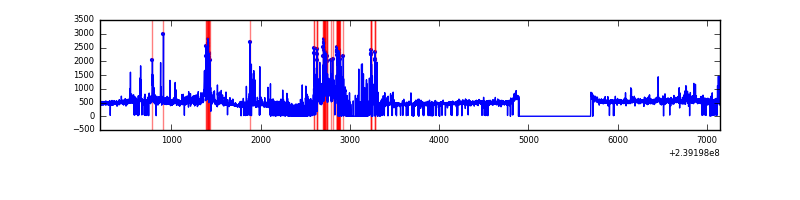 |
| C | 6943 | 5945 | 0 | 0 | 0.00% | 0.00% | 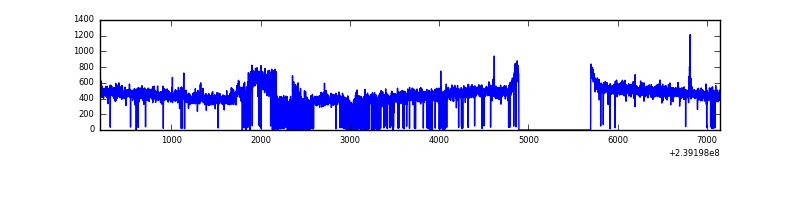 |
| D | 6941 | 5873 | 132 | 132 | 1.90% | 2.25% | 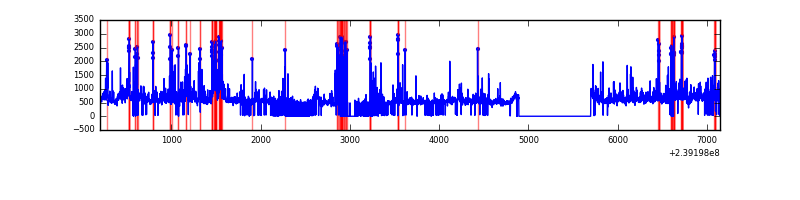 |
Top three noisy pixels from each quadrant. If the there are fewer than three noisy pixels in the level2.evt file, extra rows are filled as -1
| Pixel properties | Quadrant properties | ||||||
|---|---|---|---|---|---|---|---|
| Quadrant | DetID | PixID | Counts | Sigma | Mean | Median | Sigma |
| A | 8 | 15 | 264040 | 1902.08 | 666 | 650 | 138.5 |
| A | 14 | 254 | 19256 | 134.36 | 666 | 650 | 138.5 |
| A | 15 | 174 | 13554 | 93.19 | 666 | 650 | 138.5 |
| B | 4 | 81 | 355479 | 2787.56 | 656 | 641 | 127.3 |
| B | 4 | 239 | 133902 | 1046.88 | 656 | 641 | 127.3 |
| B | 0 | 214 | 127696 | 998.13 | 656 | 641 | 127.3 |
| C | 8 | 208 | 99036 | 651.02 | 645 | 648 | 151.1 |
| C | 7 | 247 | 7135 | 42.92 | 645 | 648 | 151.1 |
| C | 13 | 61 | 4995 | 28.76 | 645 | 648 | 151.1 |
| D | 8 | 195 | 423148 | 2495.88 | 630 | 614 | 169.3 |
| D | 10 | 253 | 230973 | 1360.71 | 630 | 614 | 169.3 |
| D | 2 | 152 | 218407 | 1286.49 | 630 | 614 | 169.3 |
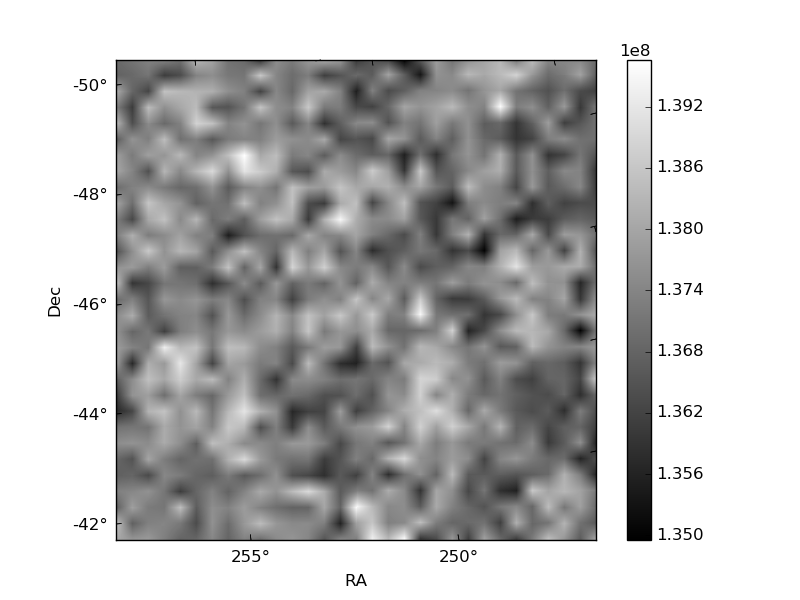
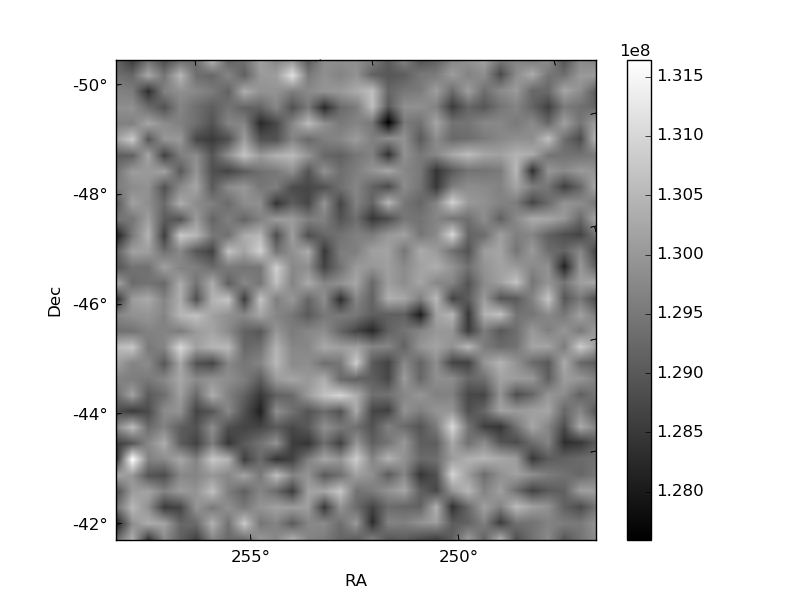
Histogram calculated using DETX and DETY for each event in the final _common_clean file
| Quadrant A | 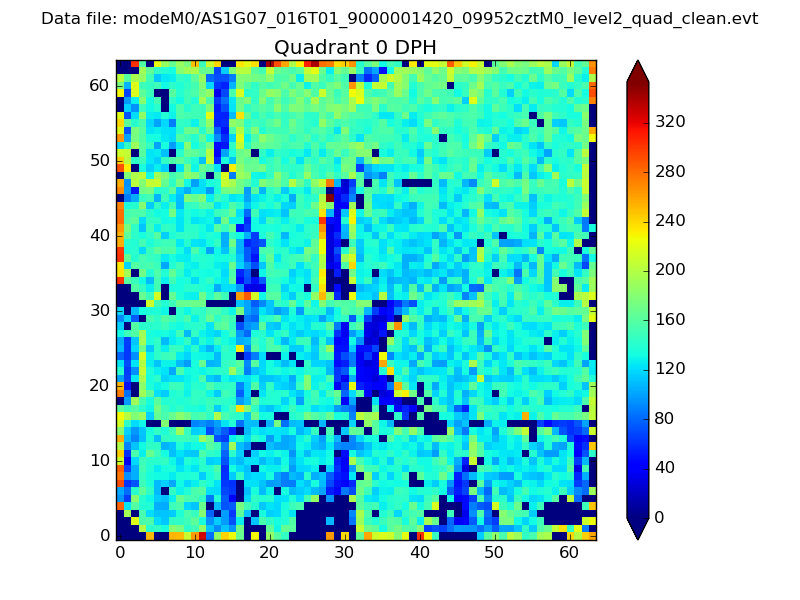 |
 |
Quadrant B |
|---|---|---|---|
| Quadrant D | 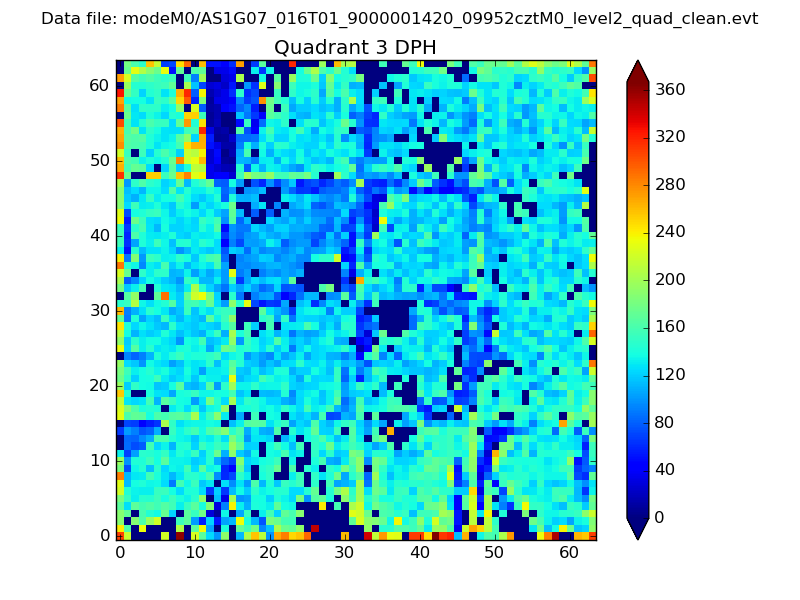 |
 |
Quadrant C |
| Plot type | Count rate plots | Images |
|---|---|---|
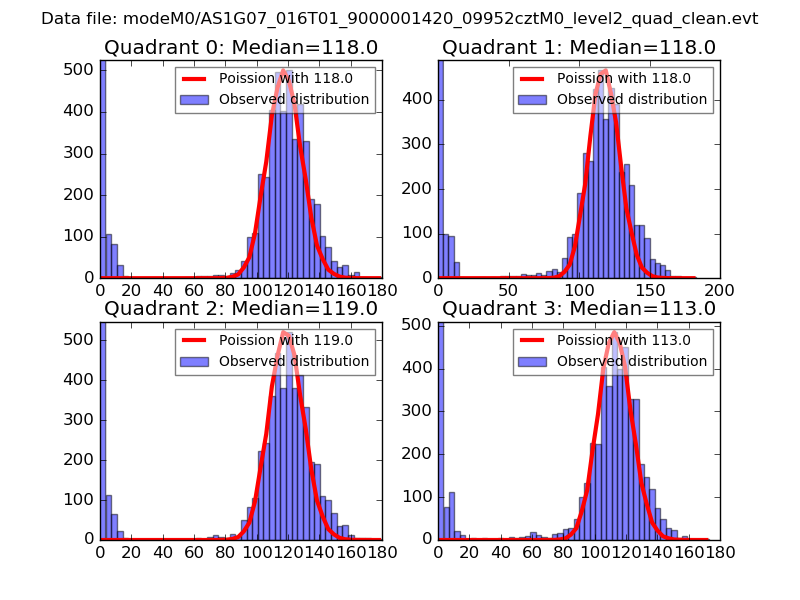
| Comparison with Poisson distribution Blue bars denote a histogram of data divided into 1 sec bins. Red curve is a Poisson curve with rate = median count rate of data. |
 |
 |
| Quadrant-wise count rates Data is divided into 100 sec bins |
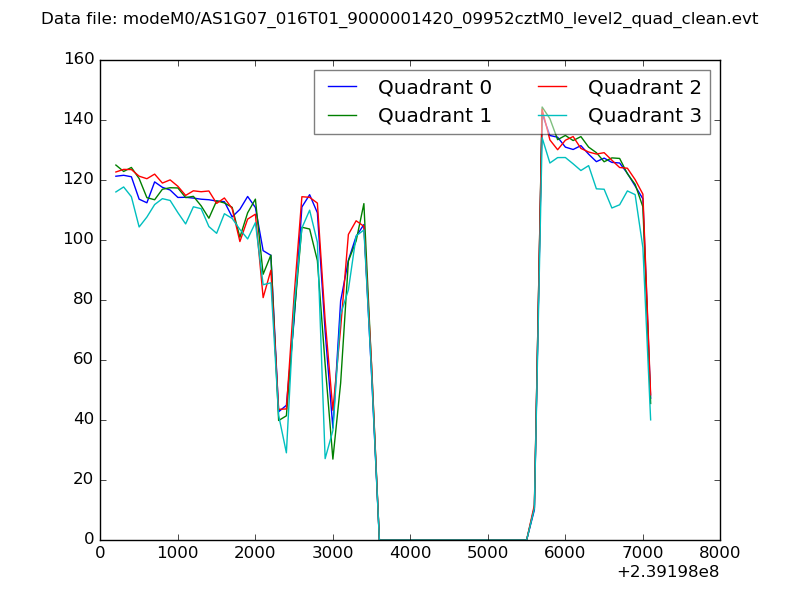 |
|
| Module-wise count rates for Quadrant A Data is divided into 100 sec bins |
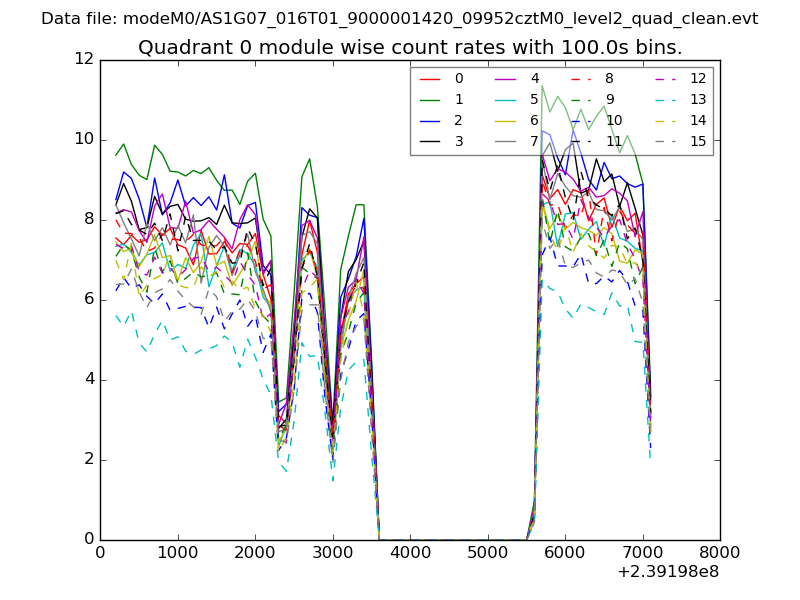 |
 |
| Module-wise count rates for Quadrant B Data is divided into 100 sec bins |
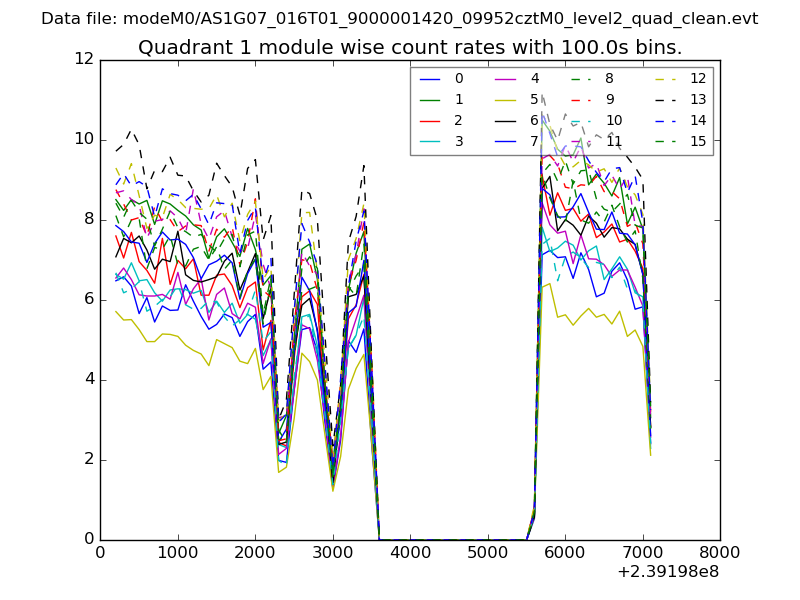 |
 |
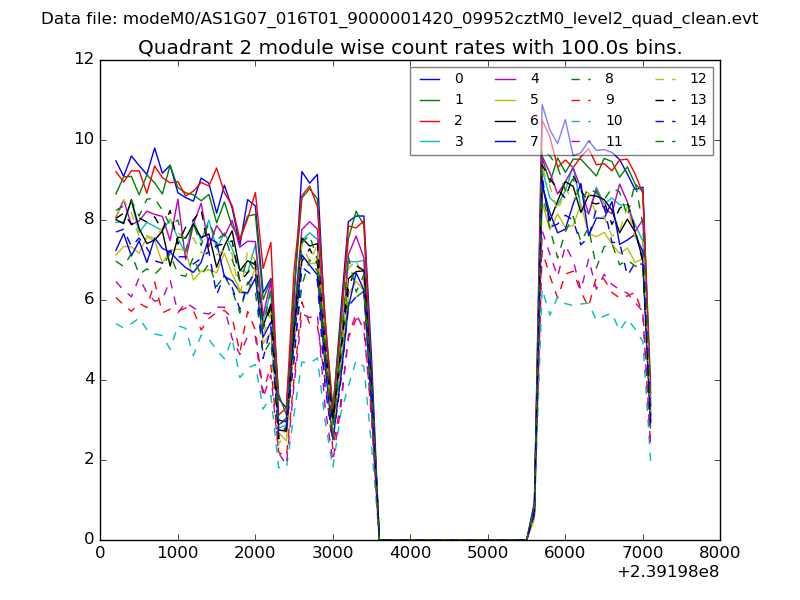
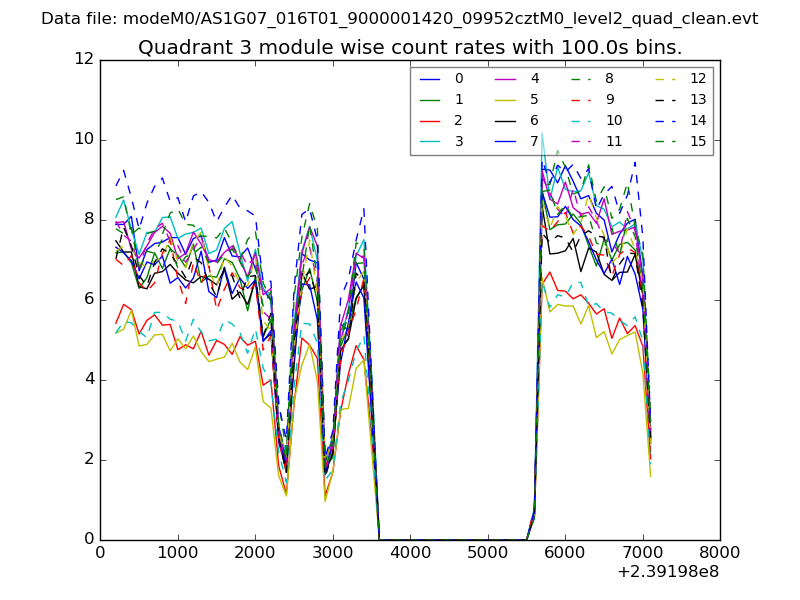
| Module-wise count rates for Quadrant C Data is divided into 100 sec bins |
 |
 |
| Module-wise count rates for Quadrant D Data is divided into 100 sec bins |
 |
 |
| Parameter | Plot |
|---|---|
| CZT HV Monitor | 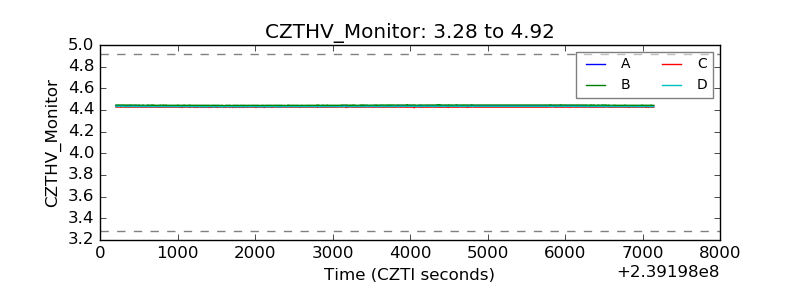 |
| D_VDD | 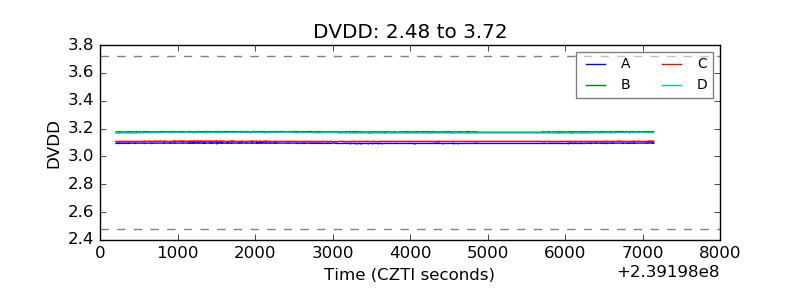 |
| Temperature 1 | 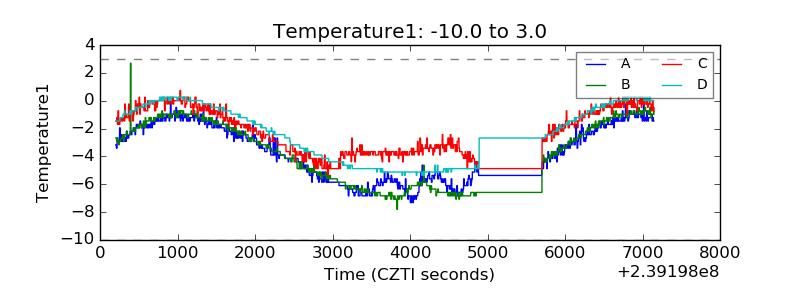 |
| Veto HV Monitor | 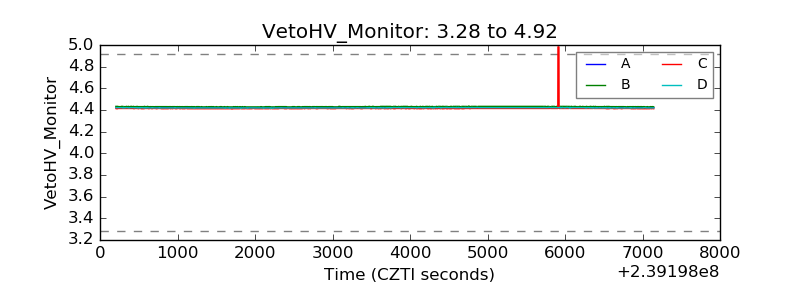 |
| Veto LLD |  |
| Alpha Counter |  |
| _CPM_Rate | 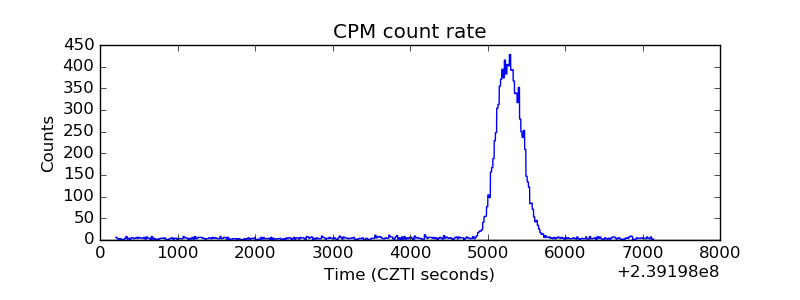 |
| CZT Counter | 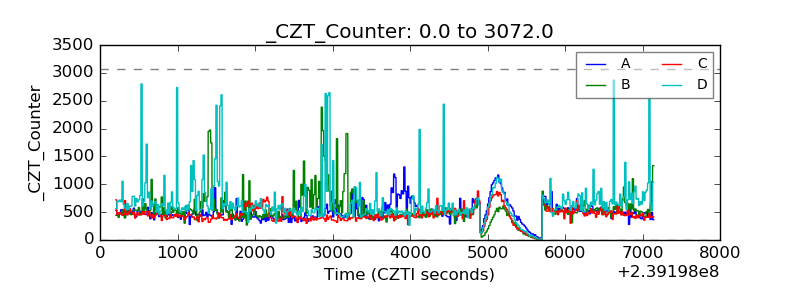 |
| +2.5 Volts monitor |  |
| +5 Volts monitor |  |
| _ROLL_ROT | 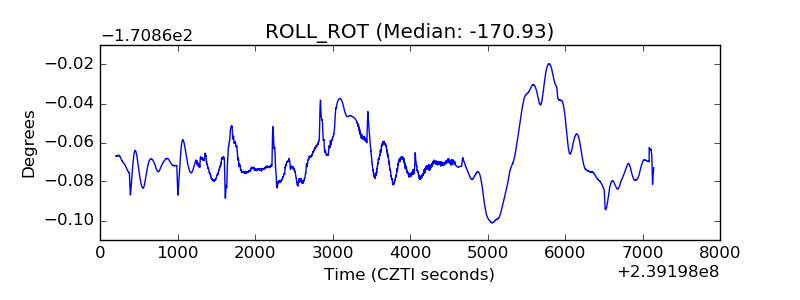 |
| _Roll_DEC | 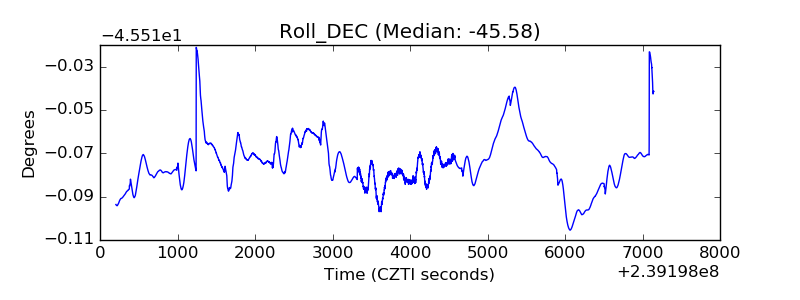 |
| _Roll_RA | 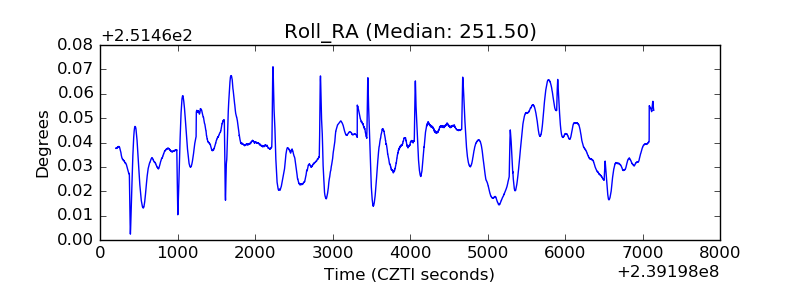 |
| Veto Counter | 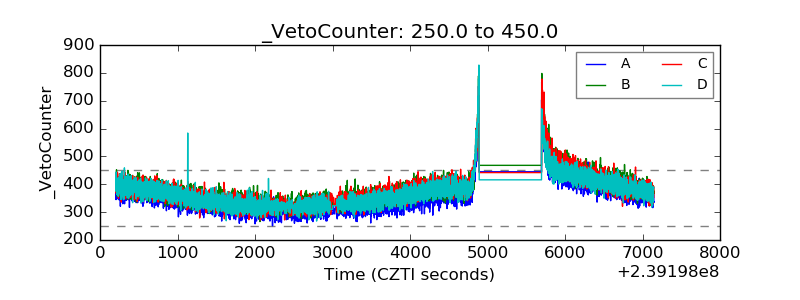 |