| Param | Original file | Final file |
|---|---|---|
| Filename | modeM0/AS1G07_016T01_9000001420_09955cztM0_level2.evt | modeM0/AS1G07_016T01_9000001420_09955cztM0_level2_quad_clean.evt |
| Size (bytes) | 510,284,160 | 89,974,080 |
| Size | 486.6 MB | 85.8 MB |
| Events in quadrant A | 3,099,454 | 584,013 |
| Events in quadrant B | 3,551,737 | 585,328 |
| Events in quadrant C | 2,868,353 | 577,191 |
| Events in quadrant D | 5,498,702 | 529,790 |
| Mode SS | |||
|---|---|---|---|
| Quadrant | BADHDUFLAG | Total packets | Discarded packets |
| A | 0 | 130 | 0 |
| B | 0 | 130 | 0 |
| C | 0 | 130 | 0 |
| D | 0 | 130 | 0 |
| Mode M0 | |||
|---|---|---|---|
| Quadrant | BADHDUFLAG | Total packets | Discarded packets |
| A | 0 | 13612 | 2 |
| B | 0 | 14980 | 1 |
| C | 0 | 13130 | 1 |
| D | 0 | 20705 | 1 |
| Mode M9 | |||
|---|---|---|---|
| Quadrant | BADHDUFLAG | Total packets | Discarded packets |
| A | 0 | 12 | 0 |
| B | 0 | 12 | 0 |
| C | 0 | 12 | 0 |
| D | 0 | 12 | 0 |
| Quadrant | Total seconds | Saturated seconds | Saturation percentage |
|---|---|---|---|
| A | 6428 | 54 | 0.840075% |
| B | 6428 | 93 | 1.446795% |
| C | 6428 | 34 | 0.528936% |
| D | 6428 | 405 | 6.300560% |
Noise dominated data is calculated using 1-second bins in cleaned event files. If a bin has >2000 counts, and if more than 50% of those come from <1% of pixels, then it is considered to be noise-dominated and hence unusable.
| Quadrant | # 1 sec bins | Bins with >0 counts | Bins with >2000 counts | High rate bins dominated by noise | Noise dominated (total time) | Noise dominated (detector-on time) | Marked lightcurve |
|---|---|---|---|---|---|---|---|
| A | 7548 | 6428 | 0 | 0 | 0.00% | 0.00% | 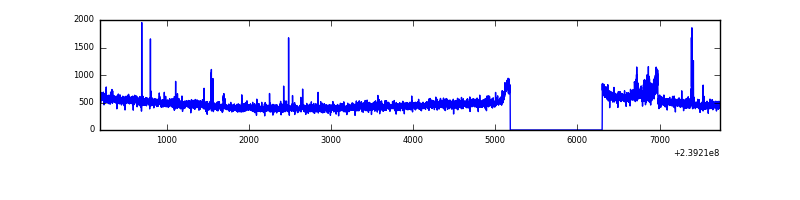 |
| B | 7548 | 6428 | 28 | 28 | 0.37% | 0.44% | 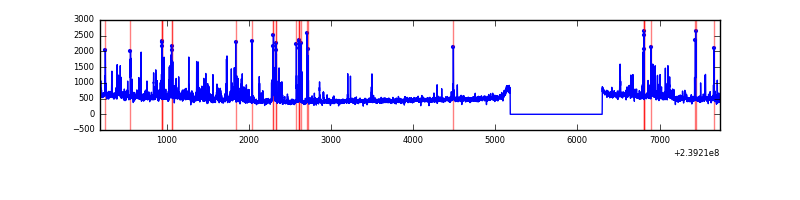 |
| C | 7548 | 6428 | 1 | 1 | 0.01% | 0.02% | 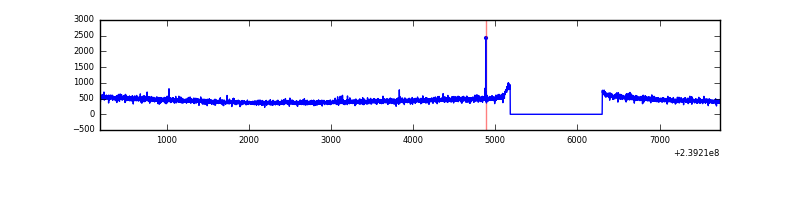 |
| D | 7548 | 6428 | 424 | 424 | 5.62% | 6.60% | 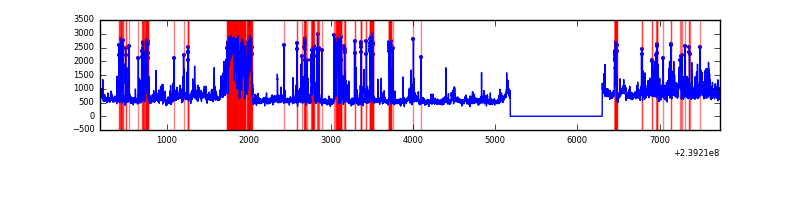 |
Top three noisy pixels from each quadrant. If the there are fewer than three noisy pixels in the level2.evt file, extra rows are filled as -1
| Pixel properties | Quadrant properties | ||||||
|---|---|---|---|---|---|---|---|
| Quadrant | DetID | PixID | Counts | Sigma | Mean | Median | Sigma |
| A | 14 | 254 | 65745 | 412.38 | 768 | 750 | 157.6 |
| A | 13 | 14 | 31954 | 197.98 | 768 | 750 | 157.6 |
| A | 15 | 174 | 21441 | 131.28 | 768 | 750 | 157.6 |
| B | 4 | 239 | 232520 | 1587.39 | 767 | 750 | 146.0 |
| B | 4 | 81 | 159735 | 1088.89 | 767 | 750 | 146.0 |
| B | 0 | 214 | 42790 | 287.93 | 767 | 750 | 146.0 |
| C | 14 | 234 | 6036 | 31.07 | 732 | 736 | 170.6 |
| C | 13 | 61 | 5522 | 28.06 | 732 | 736 | 170.6 |
| C | 14 | 67 | 3693 | 17.34 | 732 | 736 | 170.6 |
| D | 12 | 233 | 914472 | 4723.69 | 715 | 697 | 193.4 |
| D | 8 | 195 | 726852 | 3753.8 | 715 | 697 | 193.4 |
| D | 10 | 253 | 316776 | 1633.95 | 715 | 697 | 193.4 |
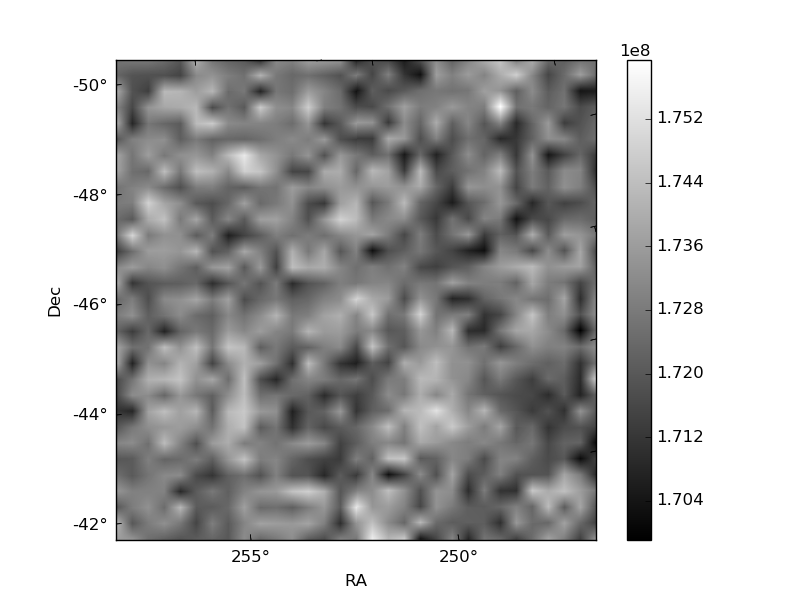
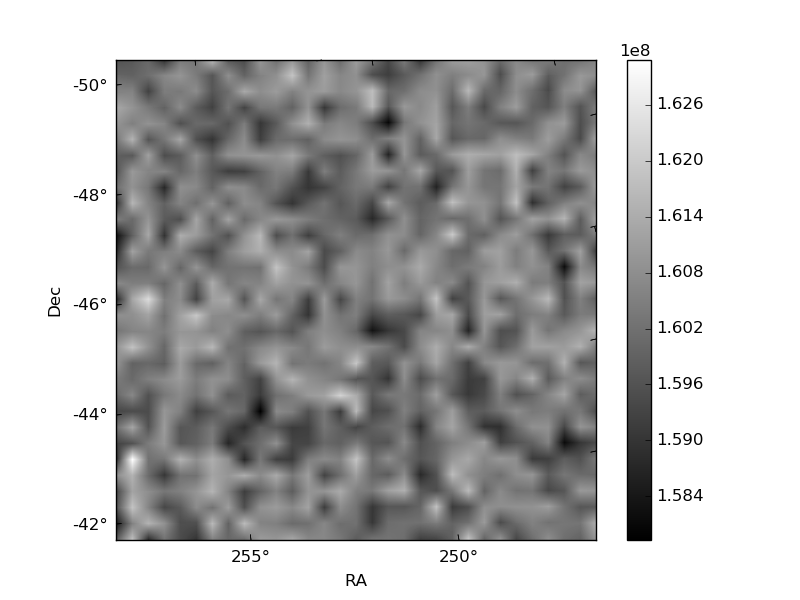
Histogram calculated using DETX and DETY for each event in the final _common_clean file
| Quadrant A |  |
 |
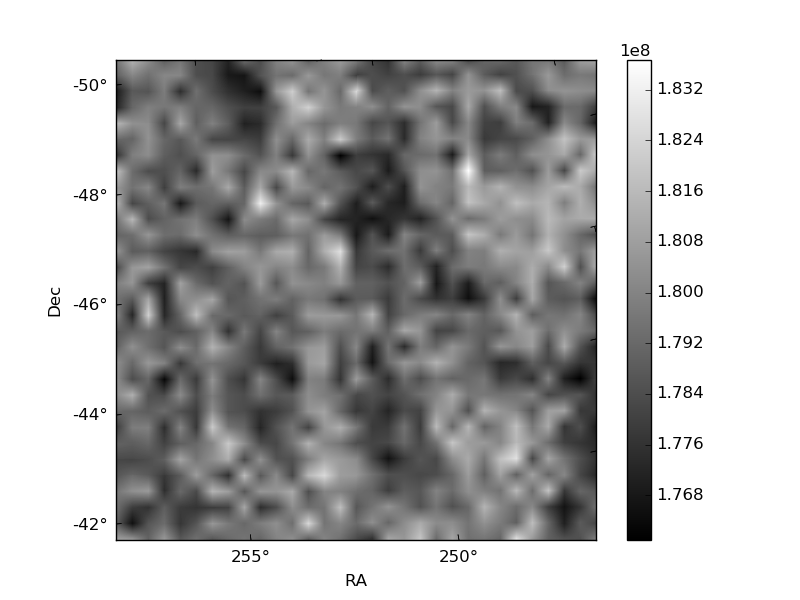
Quadrant B |
|---|---|---|---|
| Quadrant D | 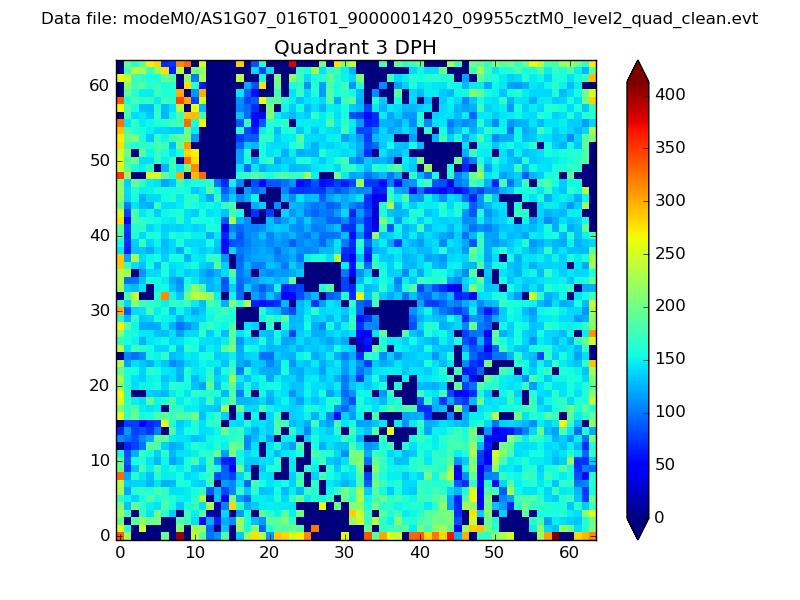 |
 |
Quadrant C |
| Plot type | Count rate plots | Images |
|---|---|---|
| Comparison with Poisson distribution Blue bars denote a histogram of data divided into 1 sec bins. Red curve is a Poisson curve with rate = median count rate of data. |
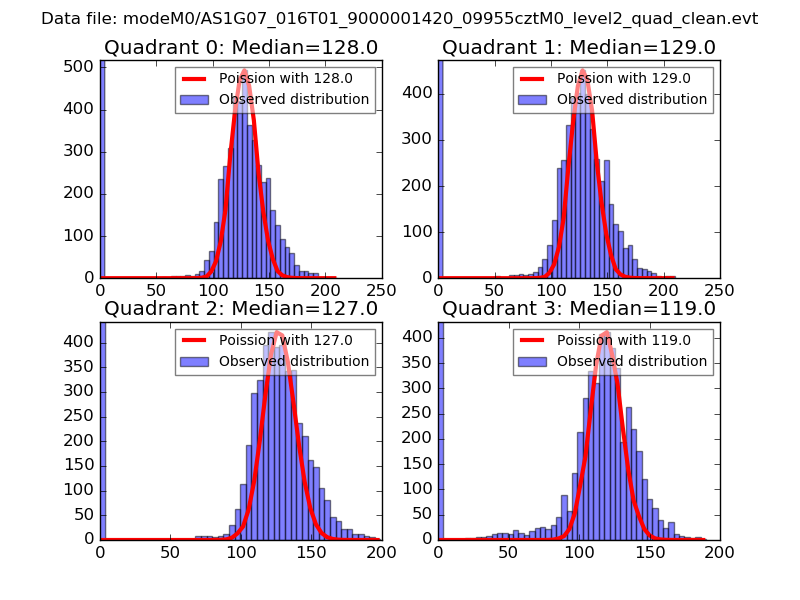 |
 |
| Quadrant-wise count rates Data is divided into 100 sec bins |
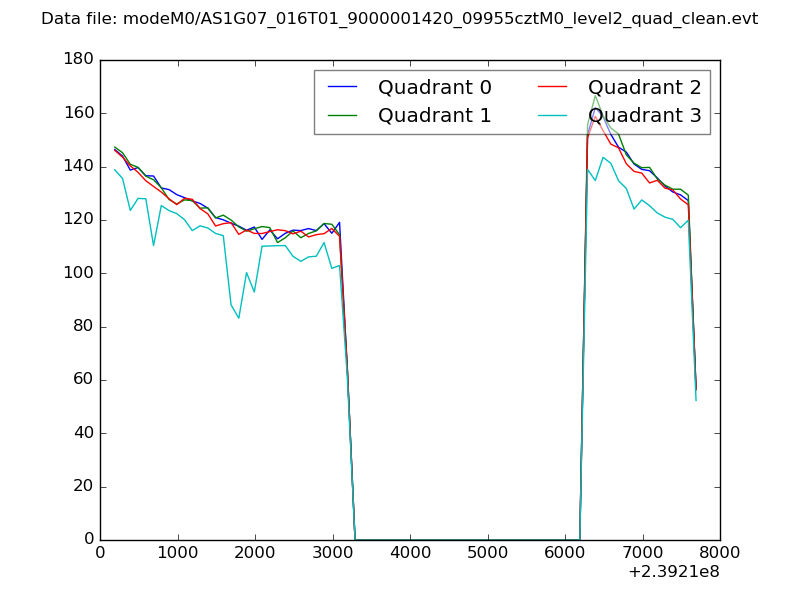 |
|
| Module-wise count rates for Quadrant A Data is divided into 100 sec bins |
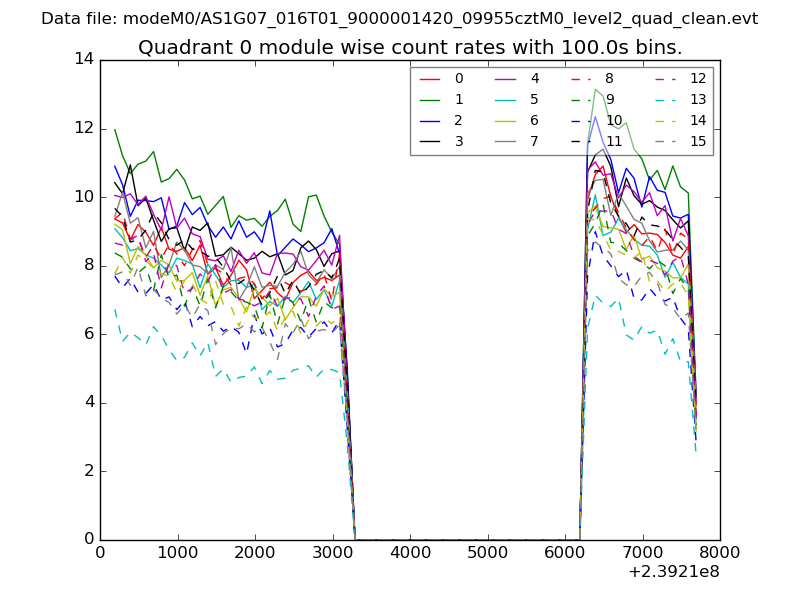 |
 |
| Module-wise count rates for Quadrant B Data is divided into 100 sec bins |
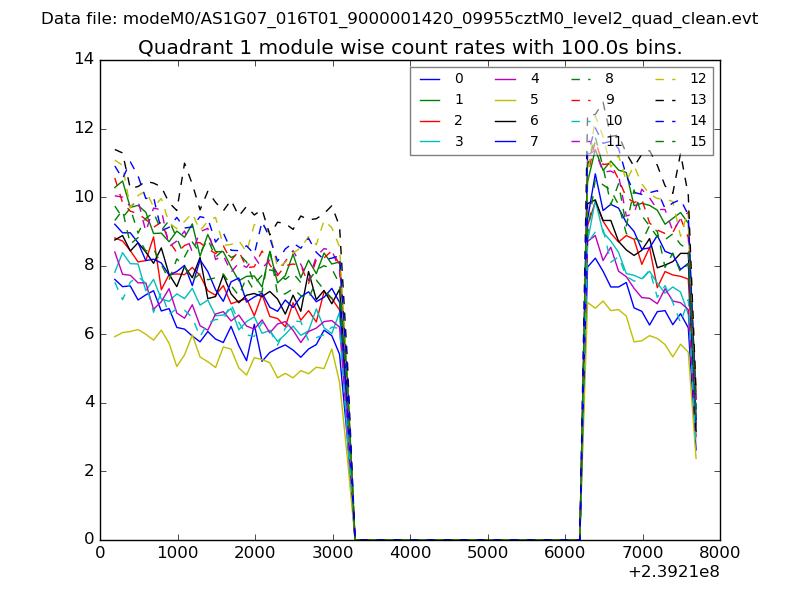 |
 |
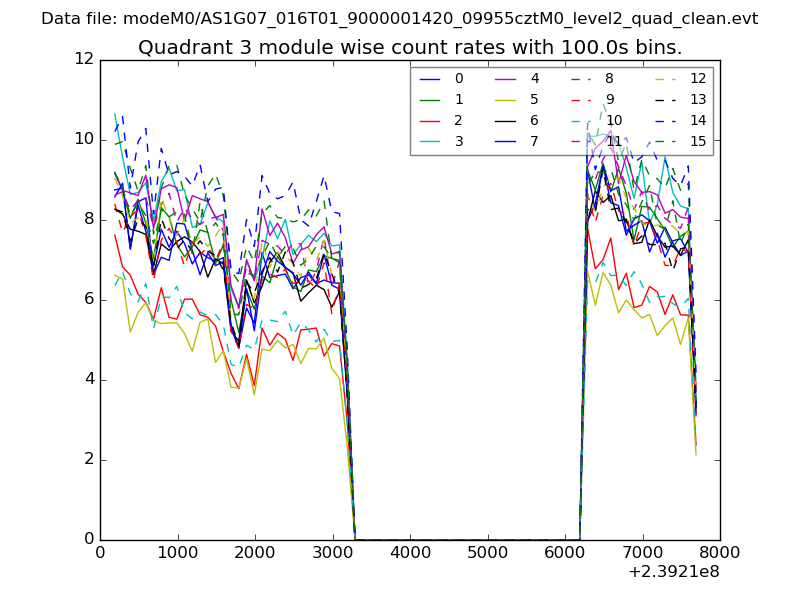
| Module-wise count rates for Quadrant C Data is divided into 100 sec bins |
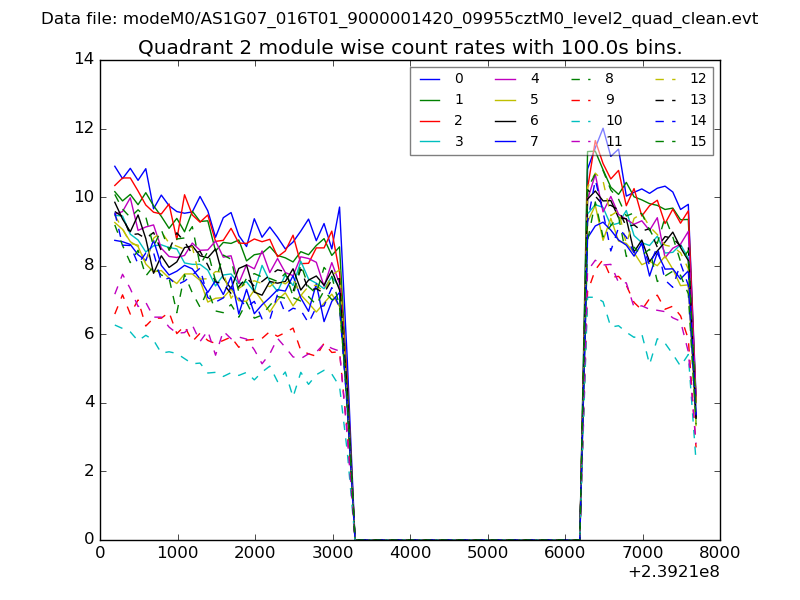 |
 |
| Module-wise count rates for Quadrant D Data is divided into 100 sec bins |
 |
 |
| Parameter | Plot |
|---|---|
| CZT HV Monitor | 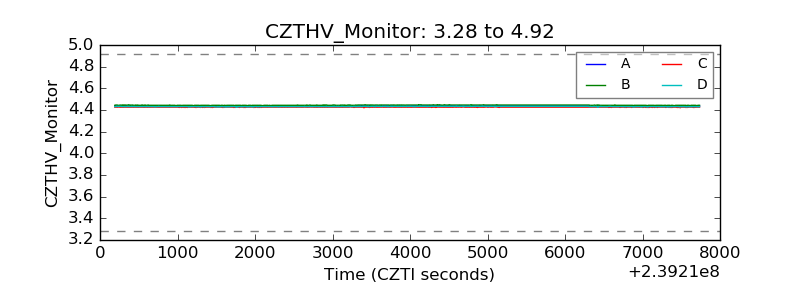 |
| D_VDD |  |
| Temperature 1 | 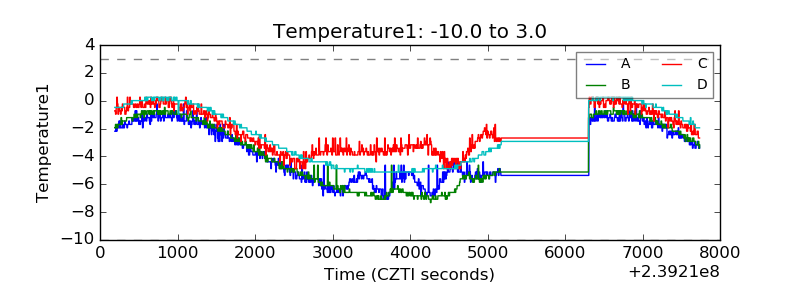 |
| Veto HV Monitor | 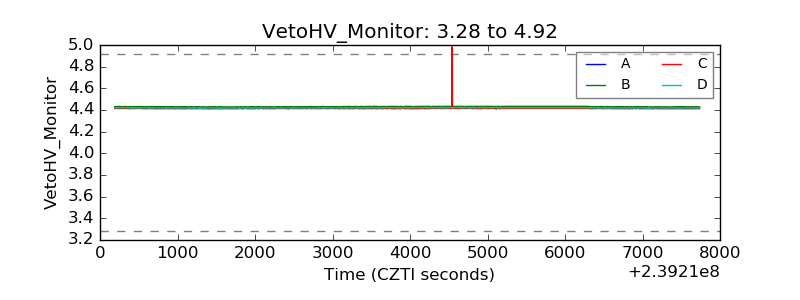 |
| Veto LLD | 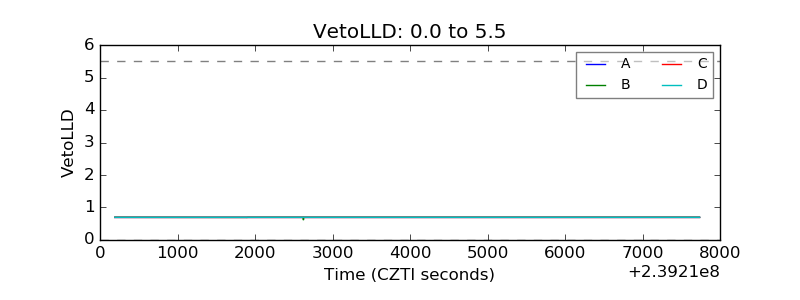 |
| Alpha Counter | 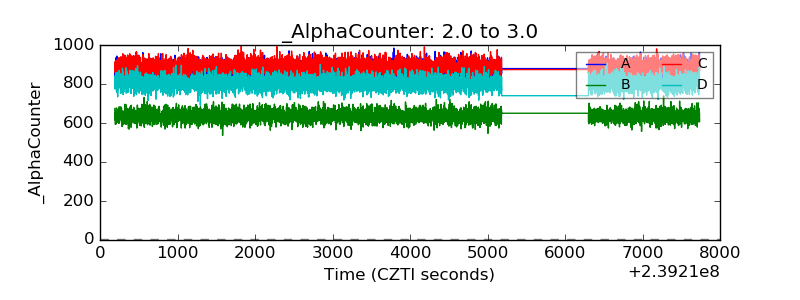 |
| _CPM_Rate | 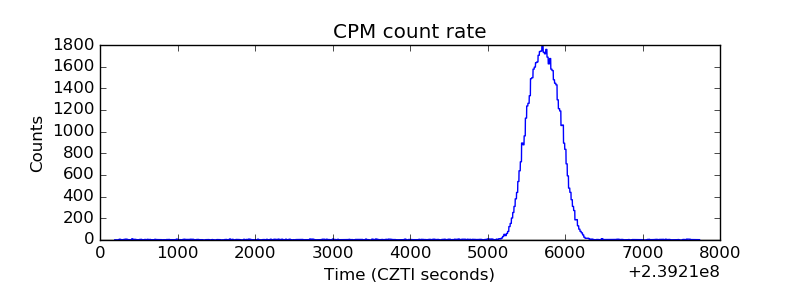 |
| CZT Counter | 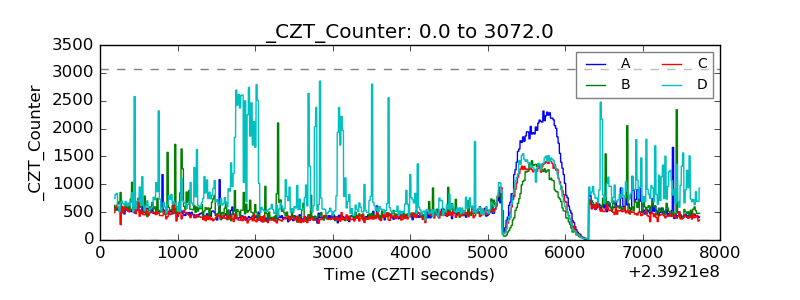 |
| +2.5 Volts monitor |  |
| +5 Volts monitor |  |
| _ROLL_ROT | 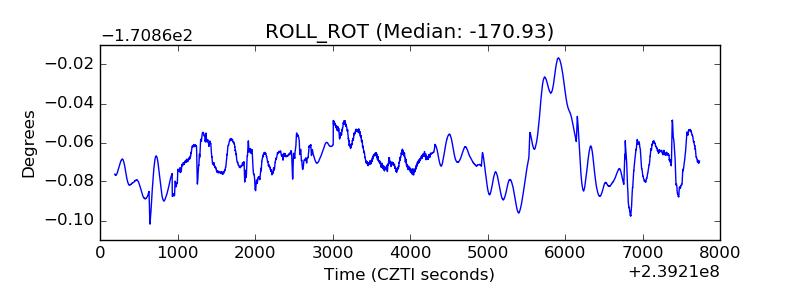 |
| _Roll_DEC | 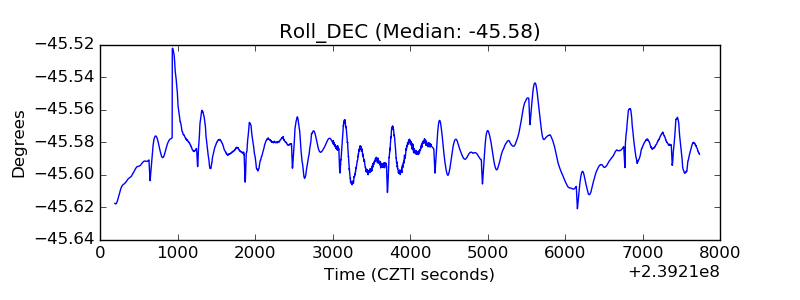 |
| _Roll_RA | 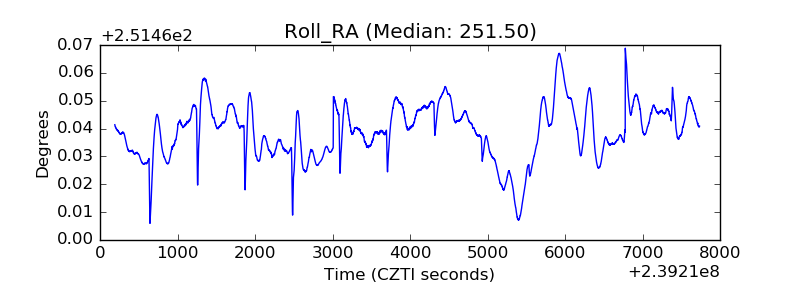 |
| Veto Counter | 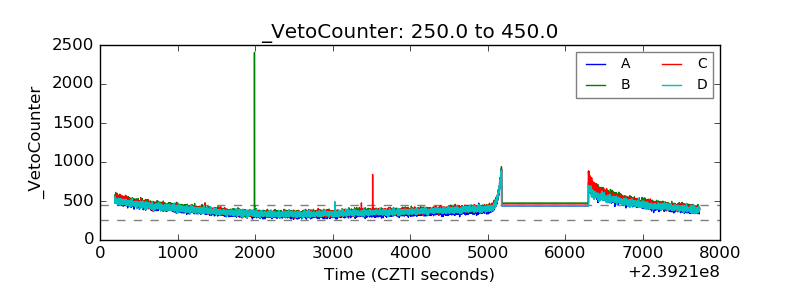 |