| Param | Original file | Final file |
|---|---|---|
| Filename | modeM0/AS1G07_016T01_9000001420_09956cztM0_level2.evt | modeM0/AS1G07_016T01_9000001420_09956cztM0_level2_quad_clean.evt |
| Size (bytes) | 114,459,840 | 27,478,080 |
| Size | 109.2 MB | 26.2 MB |
| Events in quadrant A | 732,368 | 186,613 |
| Events in quadrant B | 776,228 | 189,115 |
| Events in quadrant C | 612,103 | 184,413 |
| Events in quadrant D | 1,248,362 | 167,660 |
| Mode SS | |||
|---|---|---|---|
| Quadrant | BADHDUFLAG | Total packets | Discarded packets |
| A | 0 | 28 | 0 |
| B | 0 | 28 | 0 |
| C | 0 | 28 | 0 |
| D | 0 | 28 | 4 |
| Mode M0 | |||
|---|---|---|---|
| Quadrant | BADHDUFLAG | Total packets | Discarded packets |
| A | 0 | 3207 | 75 |
| B | 0 | 3297 | 58 |
| C | 0 | 2871 | 59 |
| D | 0 | 4900 | 194 |
| Quadrant | Total seconds | Saturated seconds | Saturation percentage |
|---|---|---|---|
| A | 1399 | 2 | 0.142959% |
| B | 1406 | 9 | 0.640114% |
| C | 1402 | 0 | 0.000000% |
| D | 1376 | 28 | 2.034884% |
Noise dominated data is calculated using 1-second bins in cleaned event files. If a bin has >2000 counts, and if more than 50% of those come from <1% of pixels, then it is considered to be noise-dominated and hence unusable.
| Quadrant | # 1 sec bins | Bins with >0 counts | Bins with >2000 counts | High rate bins dominated by noise | Noise dominated (total time) | Noise dominated (detector-on time) | Marked lightcurve |
|---|---|---|---|---|---|---|---|
| A | 1431 | 1430 | 1 | 1 | 0.07% | 0.07% | 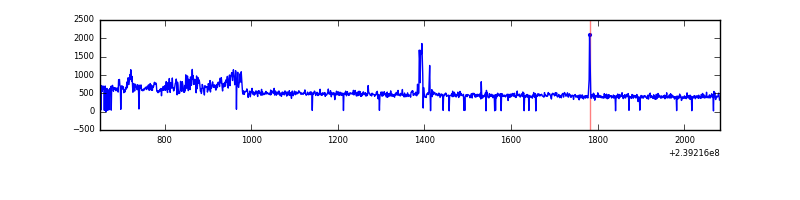 |
| B | 1431 | 1429 | 7 | 7 | 0.49% | 0.49% | 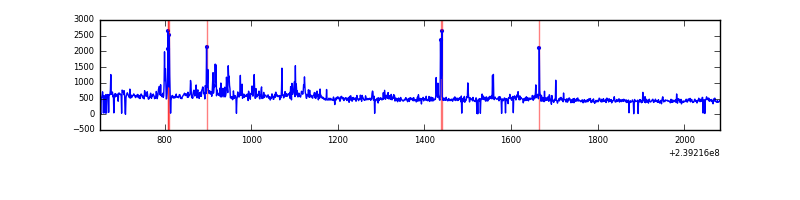 |
| C | 1431 | 1430 | 0 | 0 | 0.00% | 0.00% | 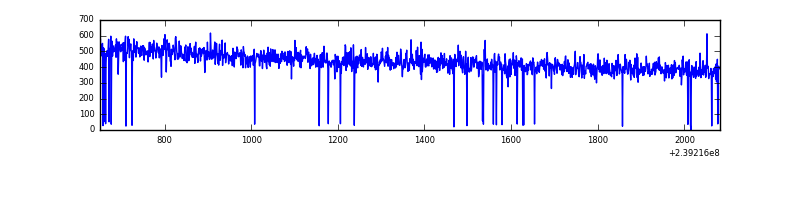 |
| D | 1430 | 1426 | 28 | 28 | 1.96% | 1.96% | 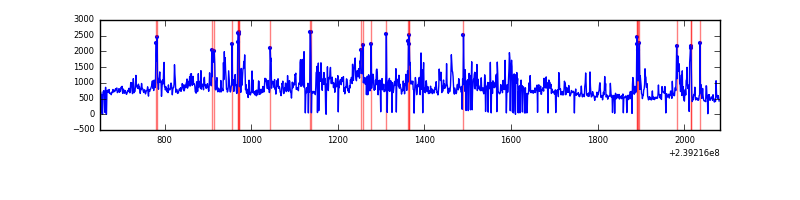 |
Top three noisy pixels from each quadrant. If the there are fewer than three noisy pixels in the level2.evt file, extra rows are filled as -1
| Pixel properties | Quadrant properties | ||||||
|---|---|---|---|---|---|---|---|
| Quadrant | DetID | PixID | Counts | Sigma | Mean | Median | Sigma |
| A | 14 | 254 | 59894 | 1642.28 | 168 | 164 | 36.4 |
| A | 15 | 174 | 17353 | 472.61 | 168 | 164 | 36.4 |
| A | 13 | 14 | 6509 | 174.46 | 168 | 164 | 36.4 |
| B | 4 | 239 | 47087 | 1362.62 | 168 | 164 | 34.4 |
| B | 4 | 81 | 39058 | 1129.47 | 168 | 164 | 34.4 |
| B | 0 | 229 | 19331 | 556.6 | 168 | 164 | 34.4 |
| C | 13 | 61 | 1160 | 26.67 | 156 | 157 | 37.6 |
| C | 8 | 222 | 572 | 11.04 | 156 | 157 | 37.6 |
| C | 14 | 67 | 512 | 9.44 | 156 | 157 | 37.6 |
| D | 8 | 195 | 200055 | 5015.78 | 154 | 149 | 39.9 |
| D | 2 | 152 | 181467 | 4549.39 | 154 | 149 | 39.9 |
| D | 12 | 233 | 99357 | 2489.2 | 154 | 149 | 39.9 |
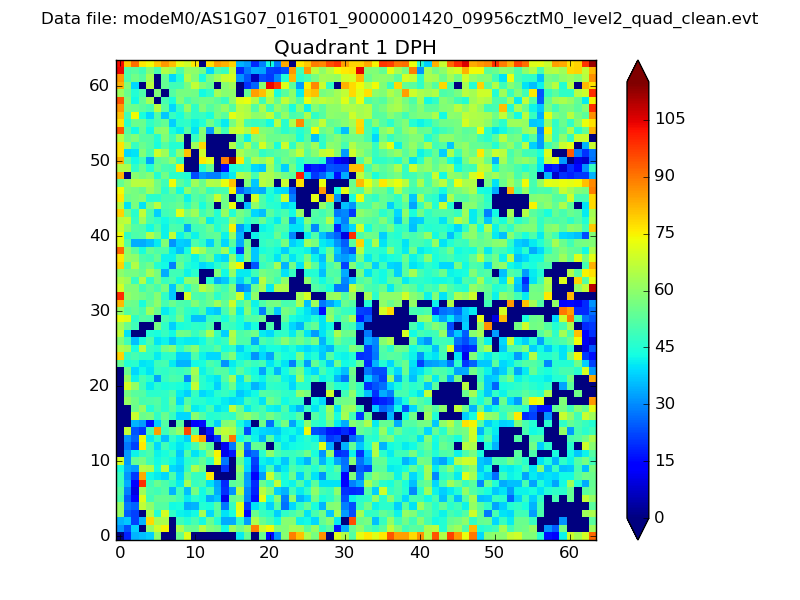
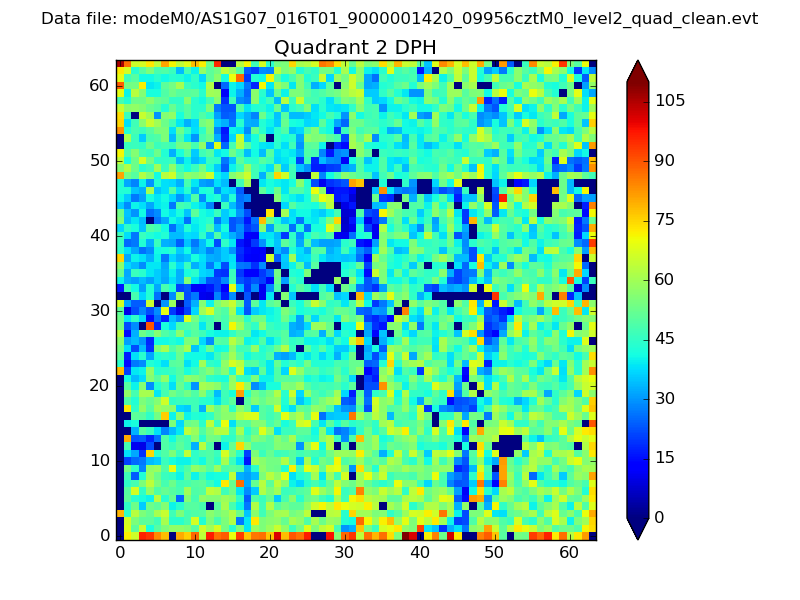
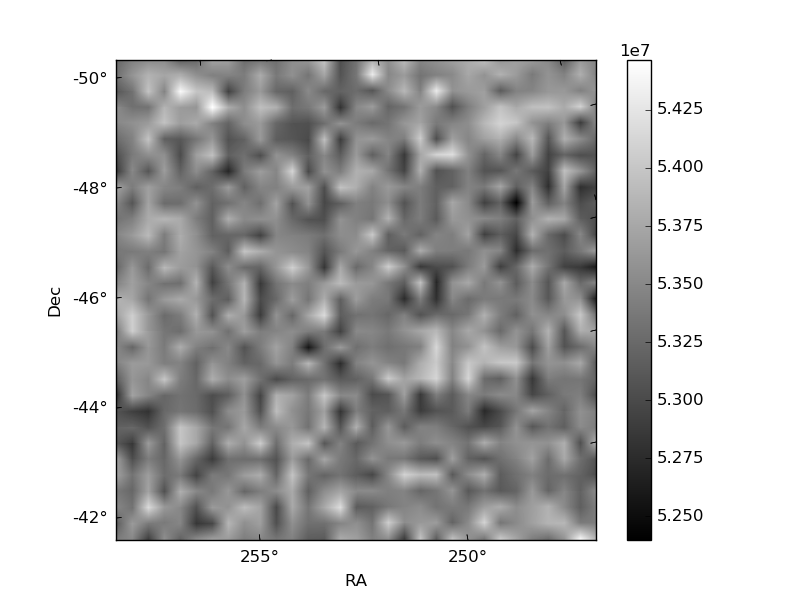
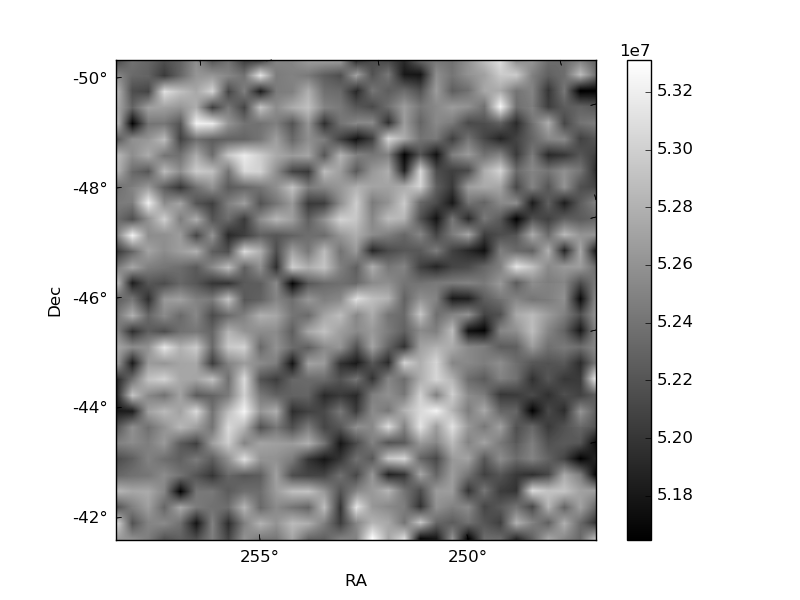
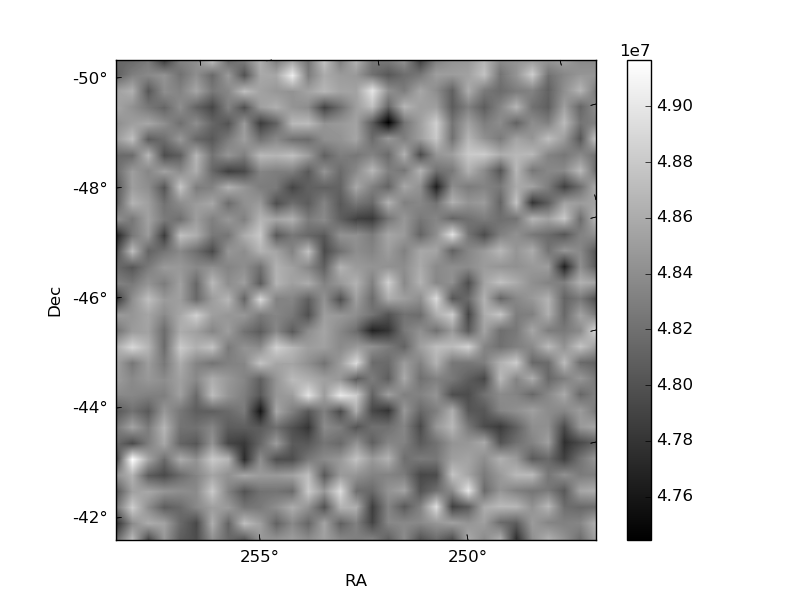
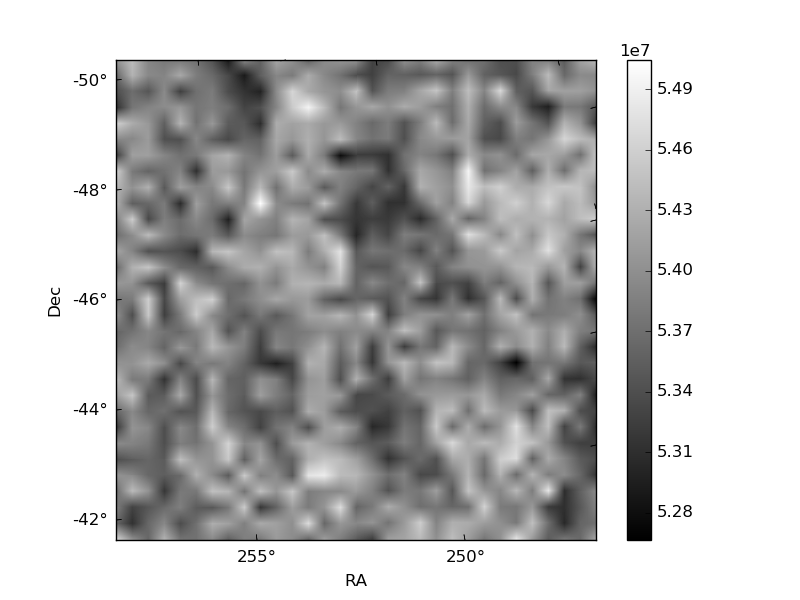
Histogram calculated using DETX and DETY for each event in the final _common_clean file
| Quadrant A |  |
 |
Quadrant B |
|---|---|---|---|
| Quadrant D |  |
 |
Quadrant C |
| Plot type | Count rate plots | Images |
|---|---|---|
| Comparison with Poisson distribution Blue bars denote a histogram of data divided into 1 sec bins. Red curve is a Poisson curve with rate = median count rate of data. |
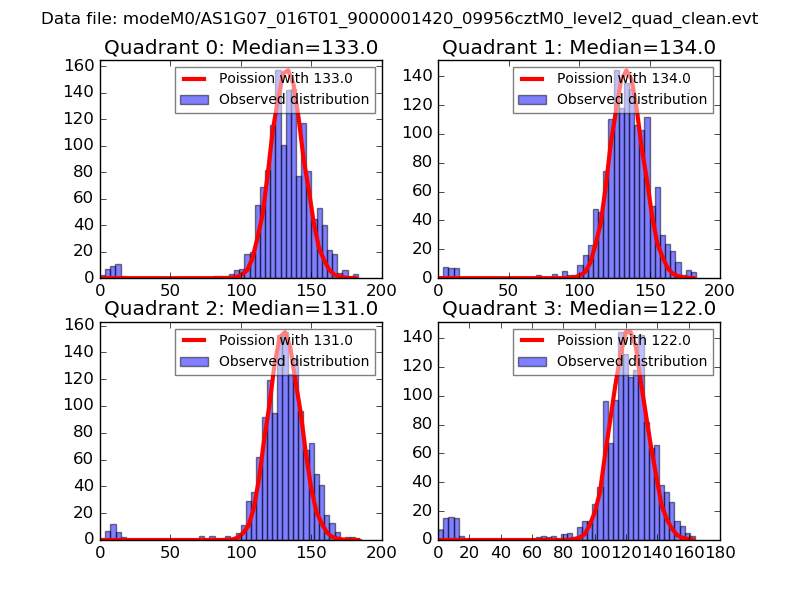 |
 |
| Quadrant-wise count rates Data is divided into 100 sec bins |
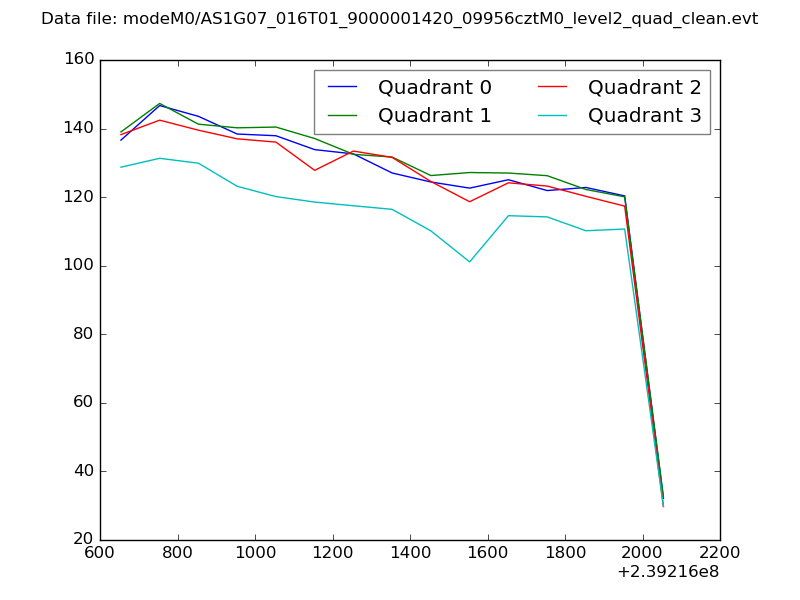 |
|
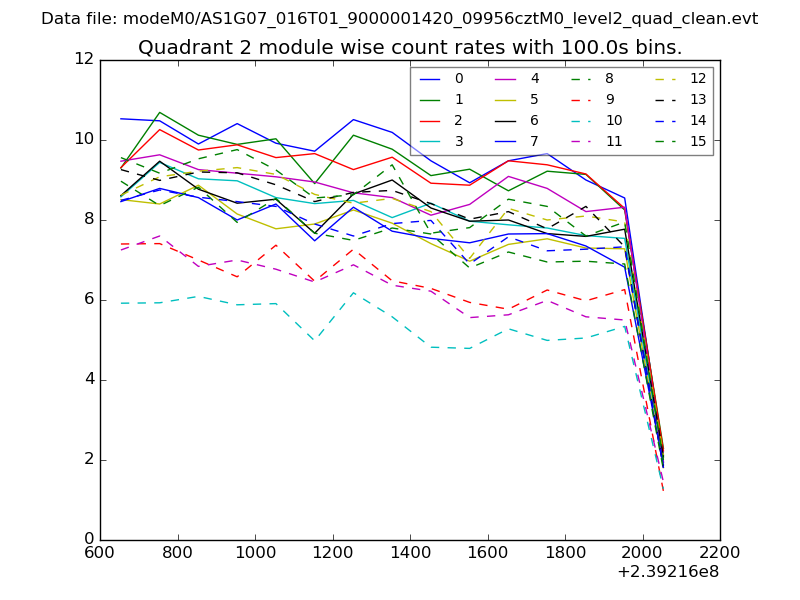
| Module-wise count rates for Quadrant A Data is divided into 100 sec bins |
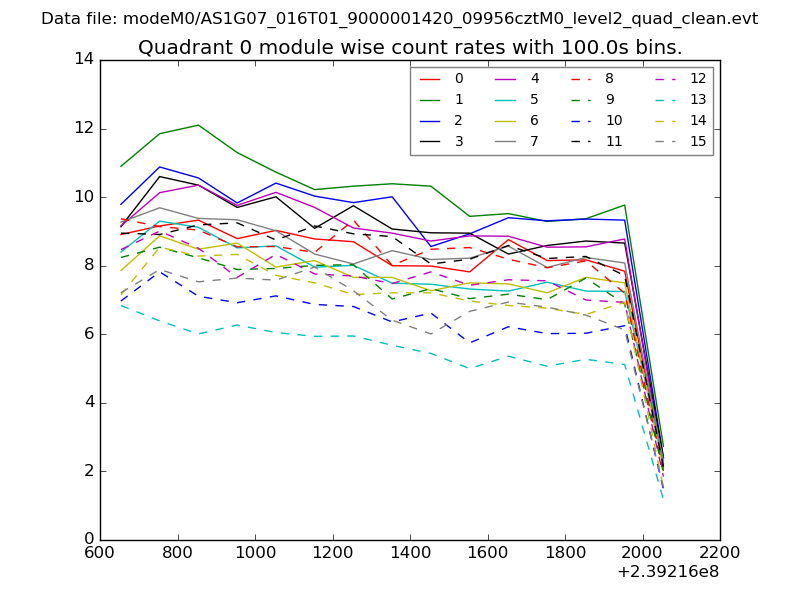 |
 |
| Module-wise count rates for Quadrant B Data is divided into 100 sec bins |
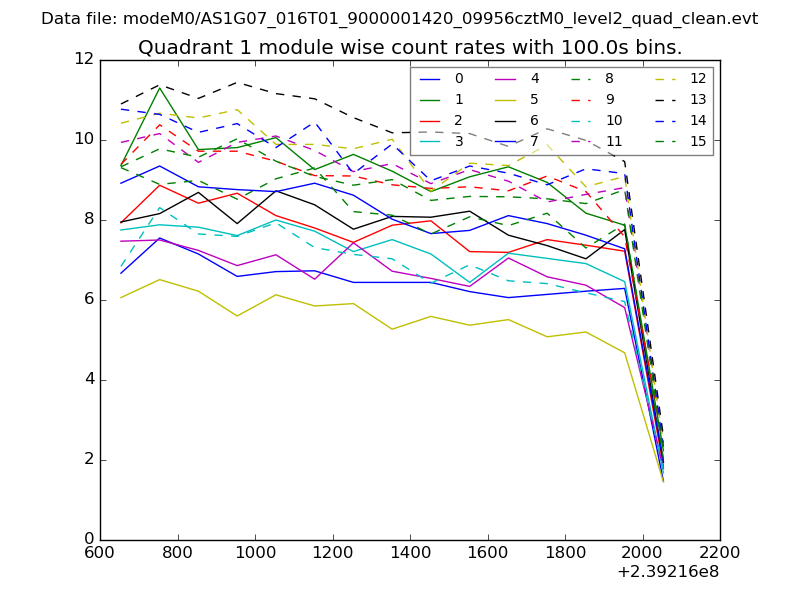 |
 |
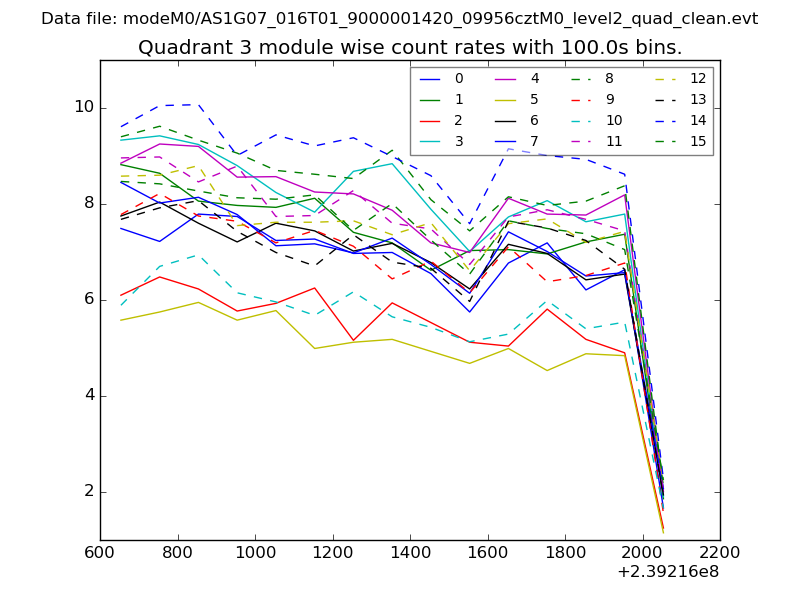
| Module-wise count rates for Quadrant C Data is divided into 100 sec bins |
 |
 |
| Module-wise count rates for Quadrant D Data is divided into 100 sec bins |
 |
 |
| Parameter | Plot |
|---|---|
| CZT HV Monitor | 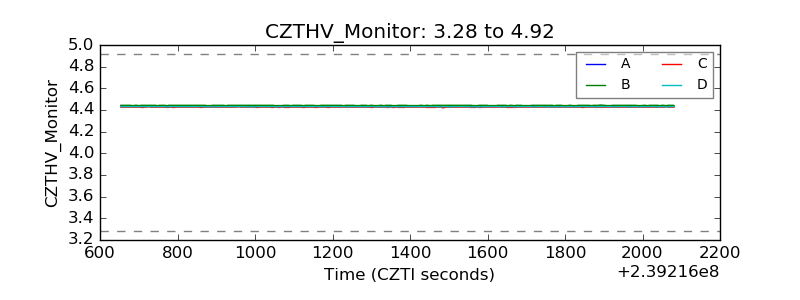 |
| D_VDD | 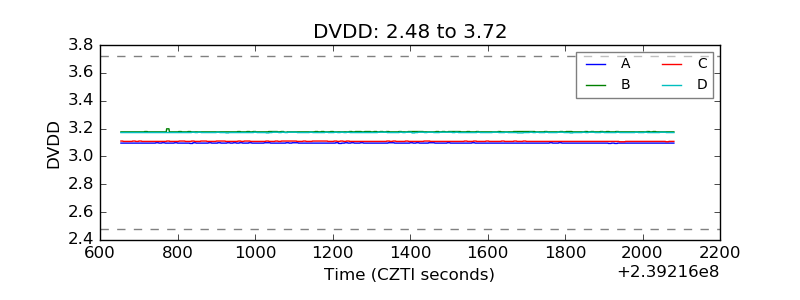 |
| Temperature 1 | 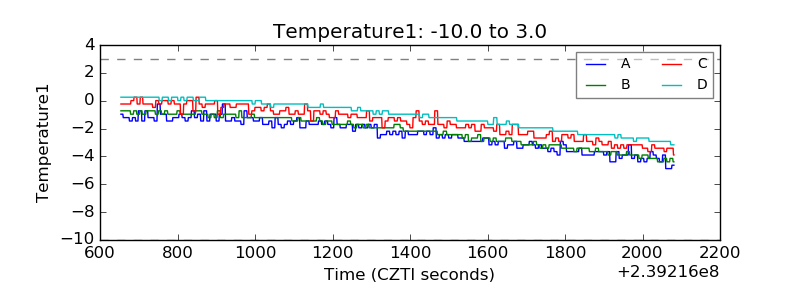 |
| Veto HV Monitor | 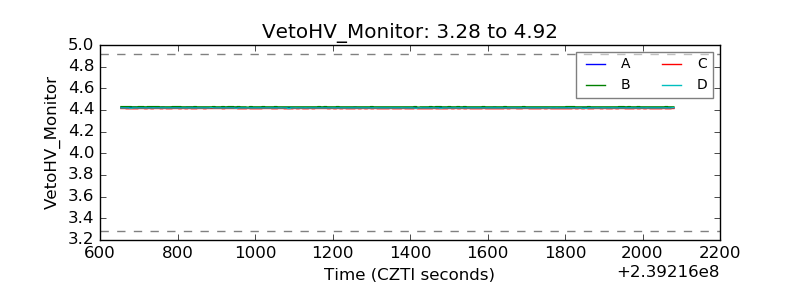 |
| Veto LLD | 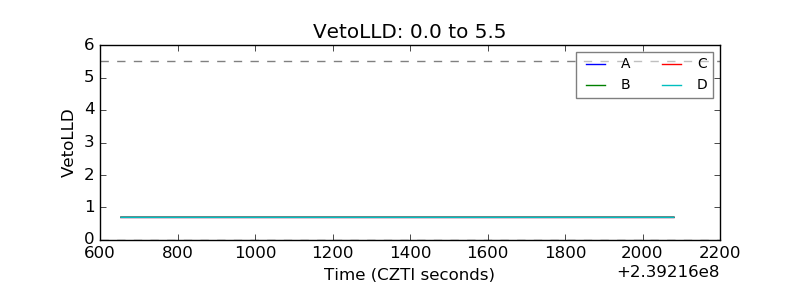 |
| Alpha Counter | 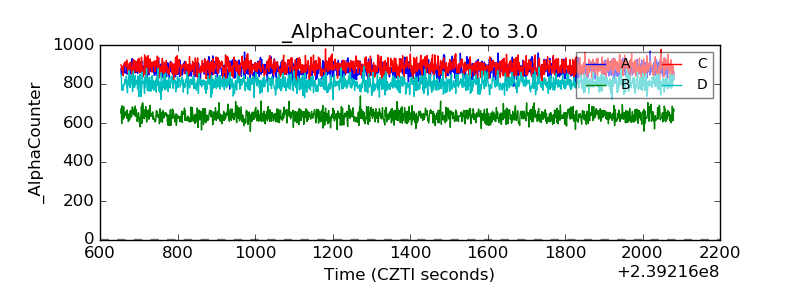 |
| _CPM_Rate | 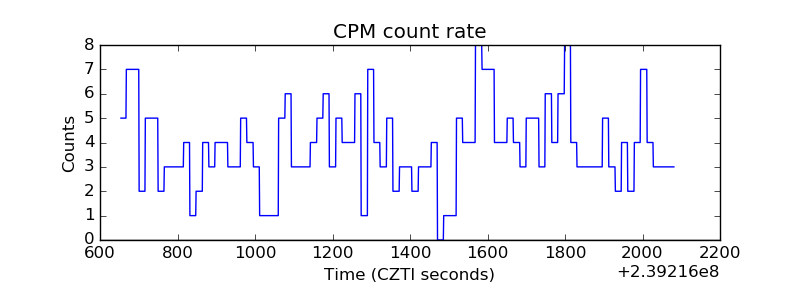 |
| CZT Counter | 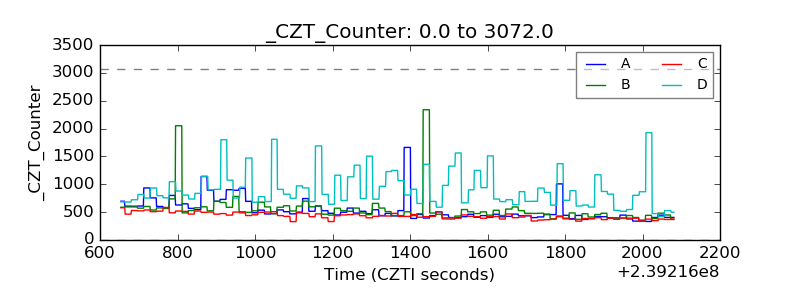 |
| +2.5 Volts monitor |  |
| +5 Volts monitor |  |
| _ROLL_ROT | 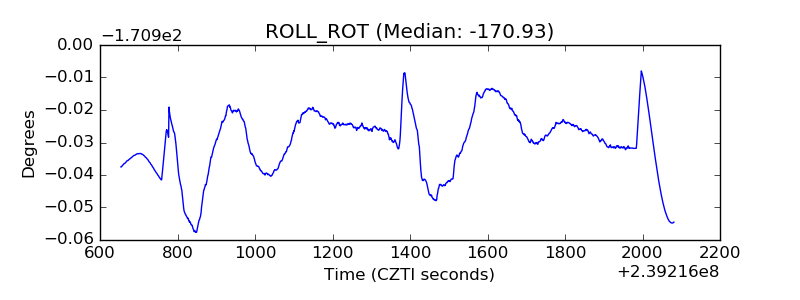 |
| _Roll_DEC | 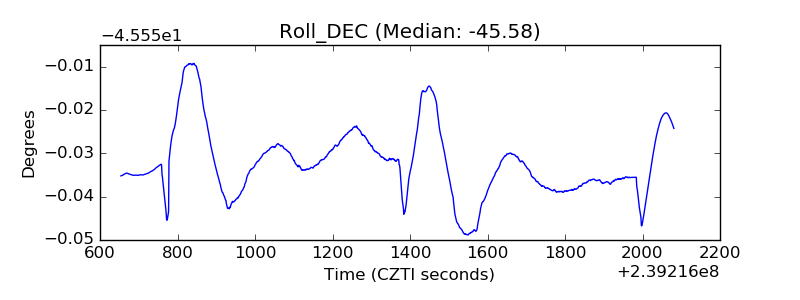 |
| _Roll_RA | 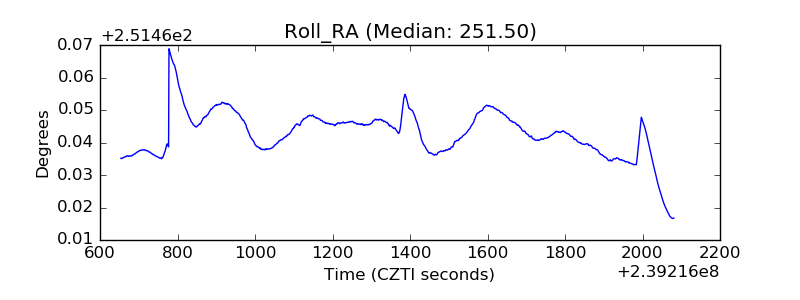 |
| Veto Counter | 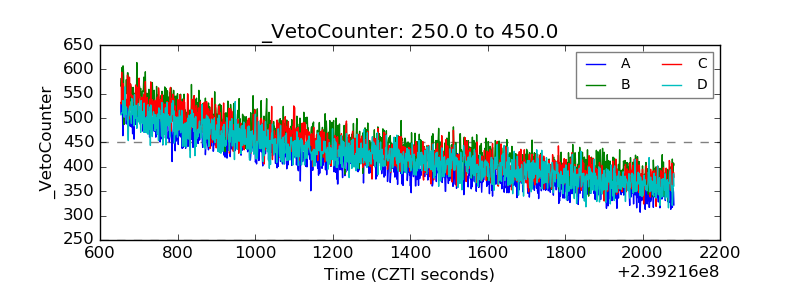 |