| Param | Original file | Final file |
|---|---|---|
| Filename | modeM0/AS1G07_016T01_9000001420_09959cztM0_level2.evt | modeM0/AS1G07_016T01_9000001420_09959cztM0_level2_quad_clean.evt |
| Size (bytes) | 117,449,280 | 28,091,520 |
| Size | 112.0 MB | 26.8 MB |
| Events in quadrant A | 748,878 | 190,435 |
| Events in quadrant B | 787,477 | 191,747 |
| Events in quadrant C | 623,168 | 187,843 |
| Events in quadrant D | 1,297,779 | 174,015 |
| Mode SS | |||
|---|---|---|---|
| Quadrant | BADHDUFLAG | Total packets | Discarded packets |
| A | 0 | 28 | 0 |
| B | 0 | 28 | 0 |
| C | 0 | 28 | 0 |
| D | 0 | 28 | 0 |
| Mode M0 | |||
|---|---|---|---|
| Quadrant | BADHDUFLAG | Total packets | Discarded packets |
| A | 0 | 3207 | 6 |
| B | 0 | 3297 | 9 |
| C | 0 | 2871 | 6 |
| D | 0 | 4900 | 3 |
| Quadrant | Total seconds | Saturated seconds | Saturation percentage |
|---|---|---|---|
| A | 1428 | 2 | 0.140056% |
| B | 1427 | 9 | 0.630694% |
| C | 1428 | 0 | 0.000000% |
| D | 1430 | 28 | 1.958042% |
Noise dominated data is calculated using 1-second bins in cleaned event files. If a bin has >2000 counts, and if more than 50% of those come from <1% of pixels, then it is considered to be noise-dominated and hence unusable.
| Quadrant | # 1 sec bins | Bins with >0 counts | Bins with >2000 counts | High rate bins dominated by noise | Noise dominated (total time) | Noise dominated (detector-on time) | Marked lightcurve |
|---|---|---|---|---|---|---|---|
| A | 1431 | 1431 | 1 | 1 | 0.07% | 0.07% | 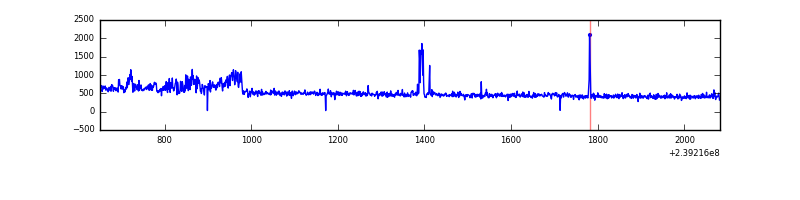 |
| B | 1431 | 1431 | 7 | 7 | 0.49% | 0.49% | 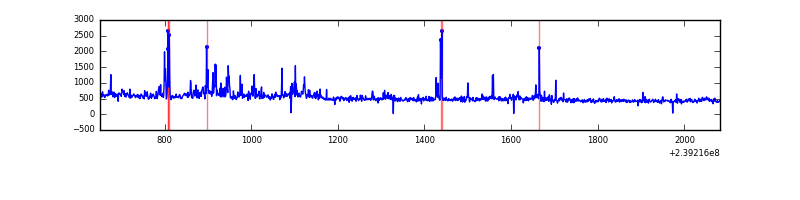 |
| C | 1431 | 1431 | 0 | 0 | 0.00% | 0.00% | 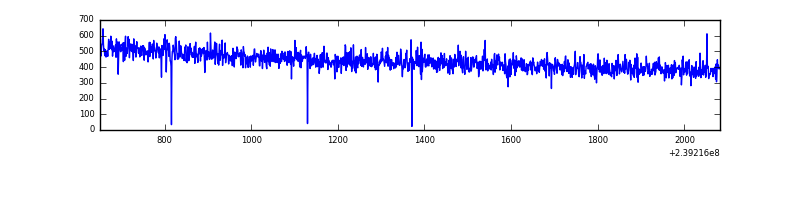 |
| D | 1431 | 1431 | 28 | 28 | 1.96% | 1.96% | 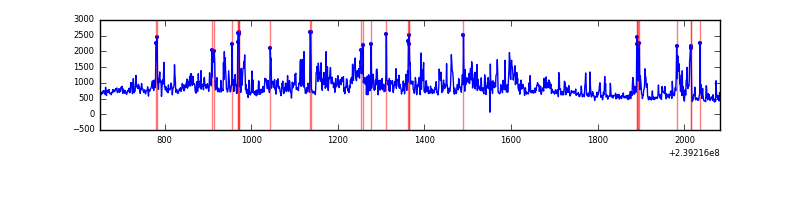 |
Top three noisy pixels from each quadrant. If the there are fewer than three noisy pixels in the level2.evt file, extra rows are filled as -1
| Pixel properties | Quadrant properties | ||||||
|---|---|---|---|---|---|---|---|
| Quadrant | DetID | PixID | Counts | Sigma | Mean | Median | Sigma |
| A | 14 | 254 | 61075 | 1641.45 | 171 | 168 | 37.1 |
| A | 15 | 174 | 18667 | 498.55 | 171 | 168 | 37.1 |
| A | 13 | 14 | 6631 | 174.18 | 171 | 168 | 37.1 |
| B | 4 | 239 | 47039 | 1341.02 | 171 | 167 | 35.0 |
| B | 4 | 81 | 38937 | 1109.22 | 171 | 167 | 35.0 |
| B | 0 | 229 | 19652 | 557.47 | 171 | 167 | 35.0 |
| C | 13 | 61 | 1194 | 27.08 | 159 | 160 | 38.2 |
| C | 8 | 222 | 575 | 10.87 | 159 | 160 | 38.2 |
| C | 14 | 67 | 518 | 9.38 | 159 | 160 | 38.2 |
| D | 8 | 195 | 208151 | 5030.96 | 160 | 155 | 41.3 |
| D | 2 | 152 | 186144 | 4498.66 | 160 | 155 | 41.3 |
| D | 12 | 233 | 108703 | 2625.53 | 160 | 155 | 41.3 |
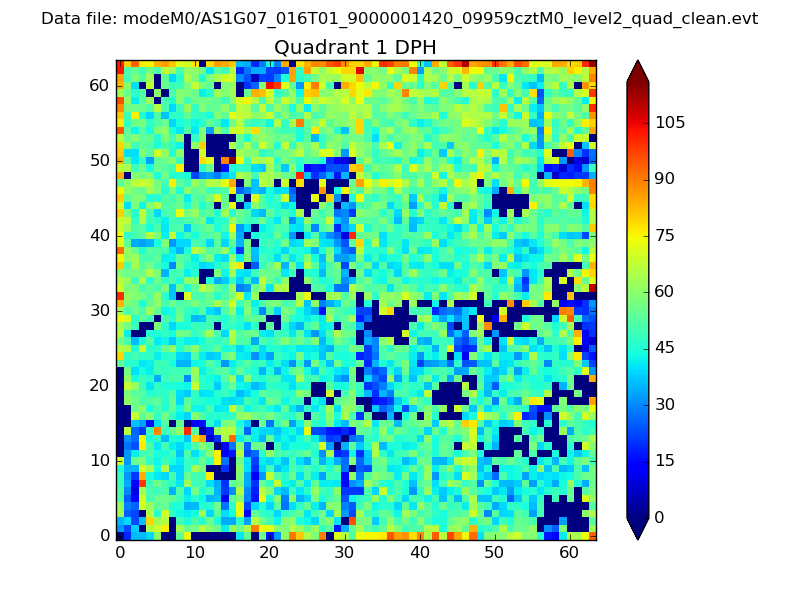
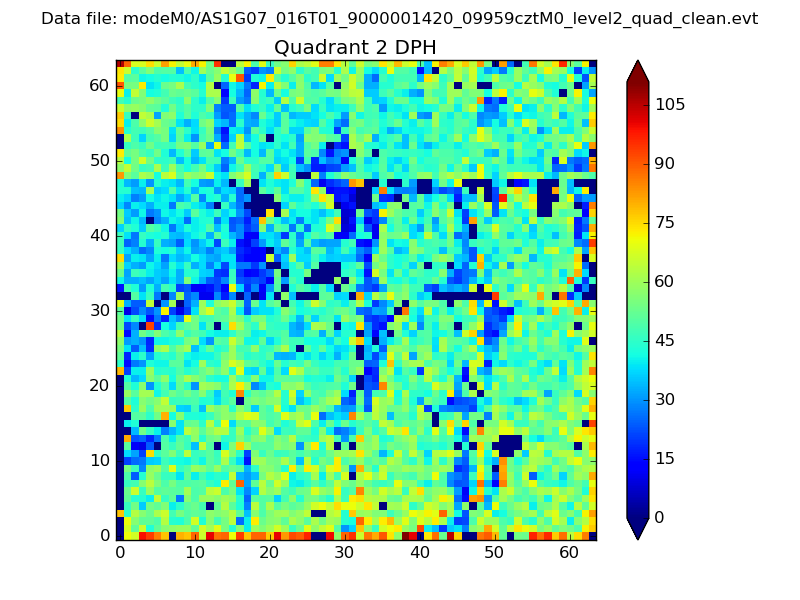
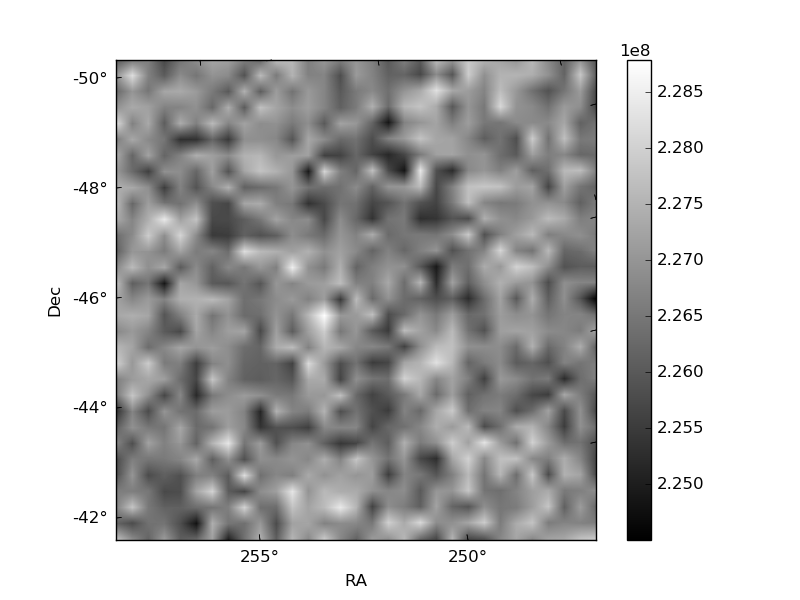
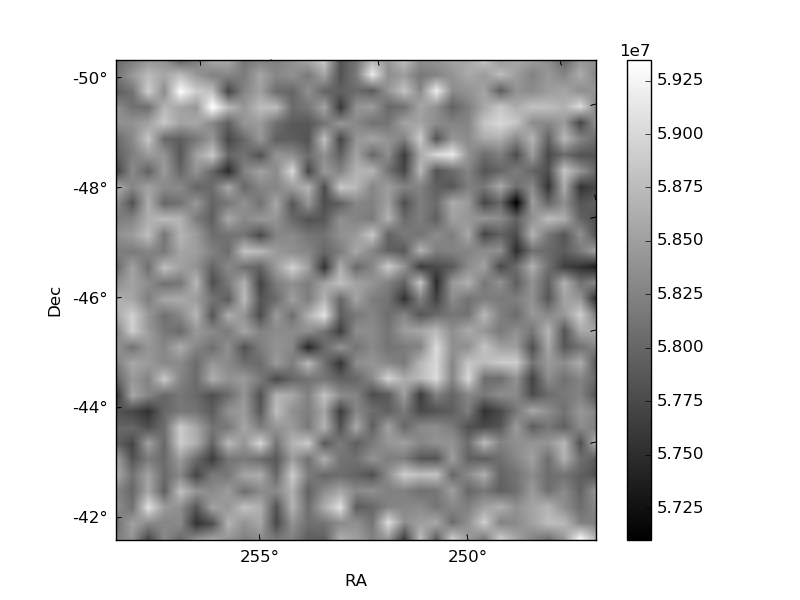
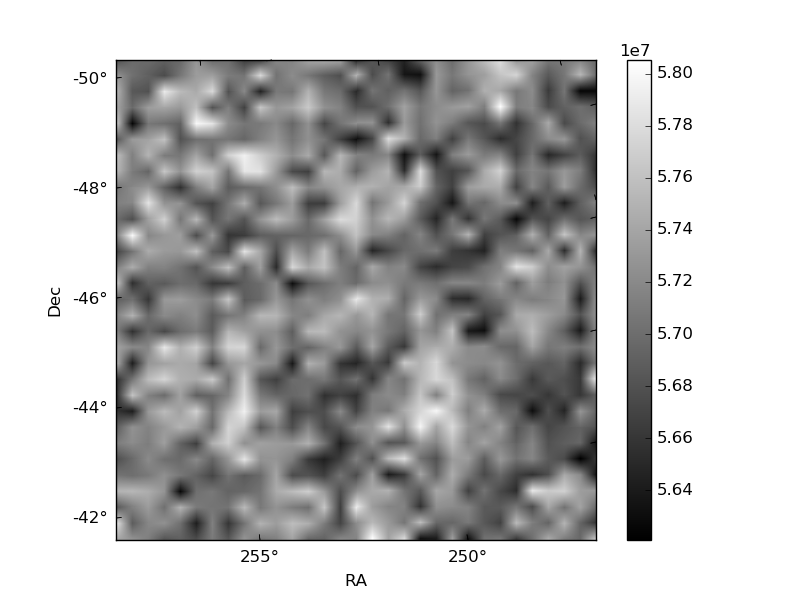
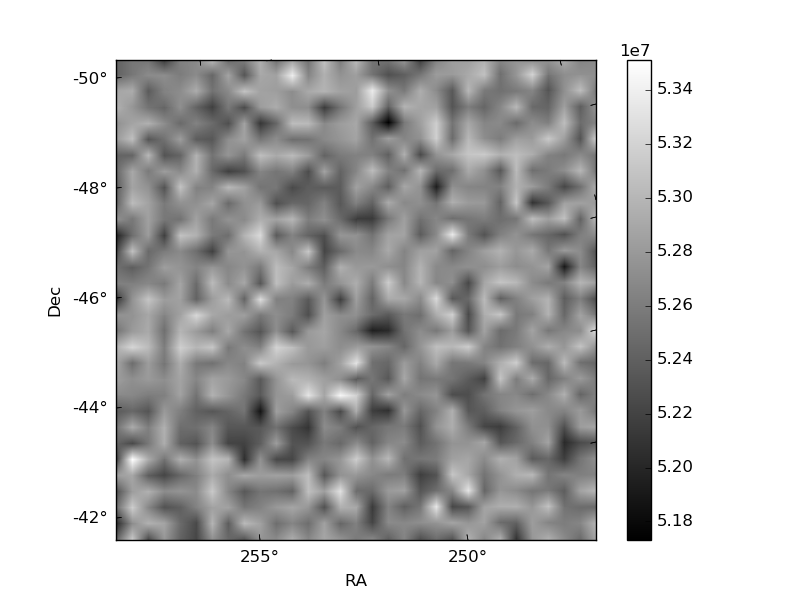
Histogram calculated using DETX and DETY for each event in the final _common_clean file
| Quadrant A |  |
 |
Quadrant B |
|---|---|---|---|
| Quadrant D | 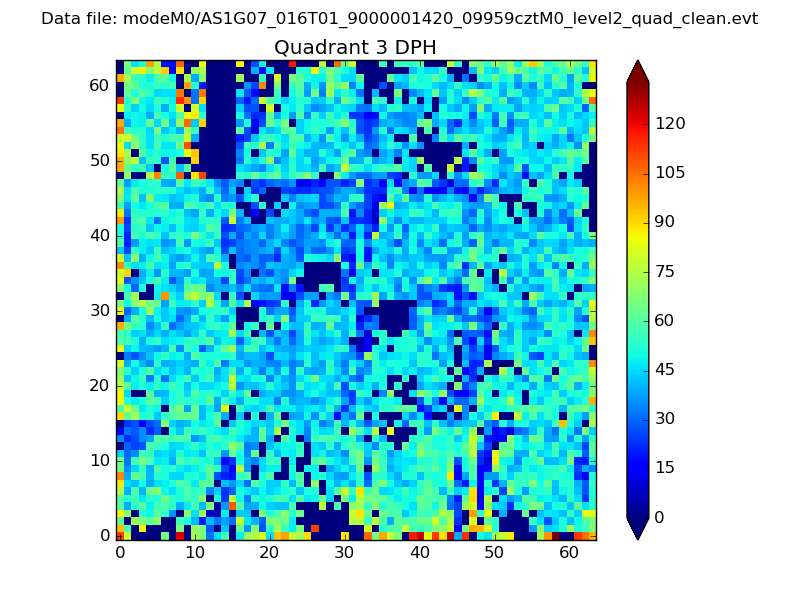 |
 |
Quadrant C |
| Plot type | Count rate plots | Images |
|---|---|---|
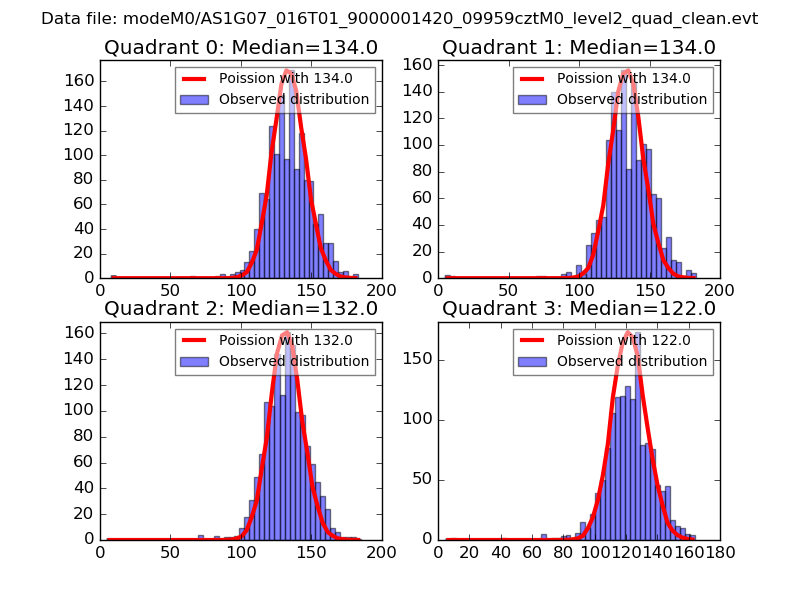
| Comparison with Poisson distribution Blue bars denote a histogram of data divided into 1 sec bins. Red curve is a Poisson curve with rate = median count rate of data. |
 |
 |
| Quadrant-wise count rates Data is divided into 100 sec bins |
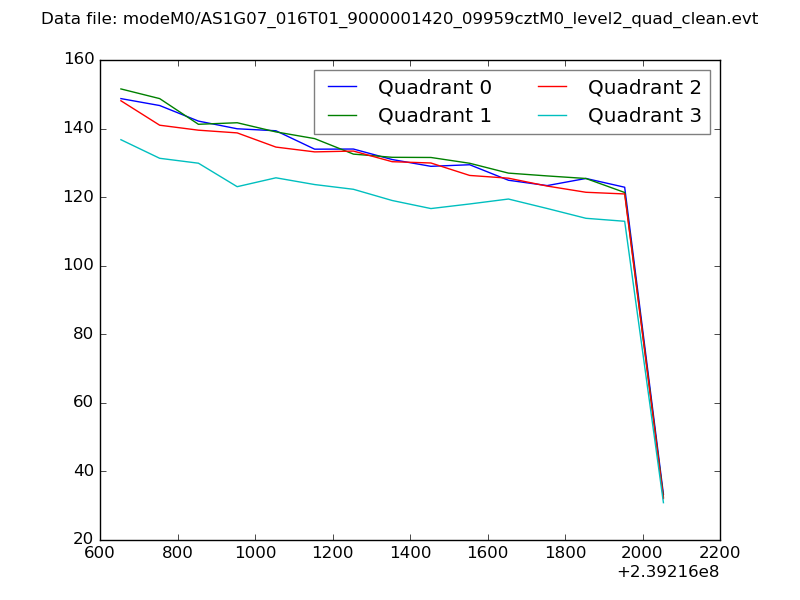 |
|
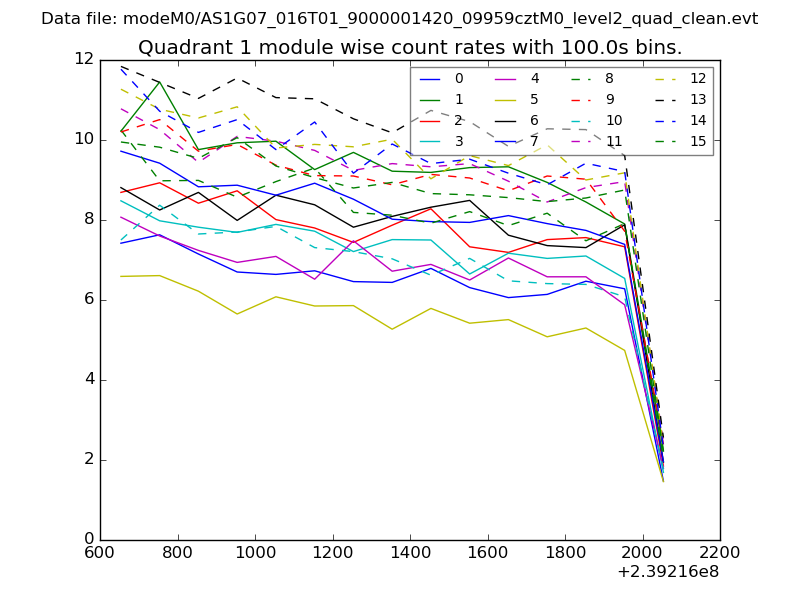
| Module-wise count rates for Quadrant A Data is divided into 100 sec bins |
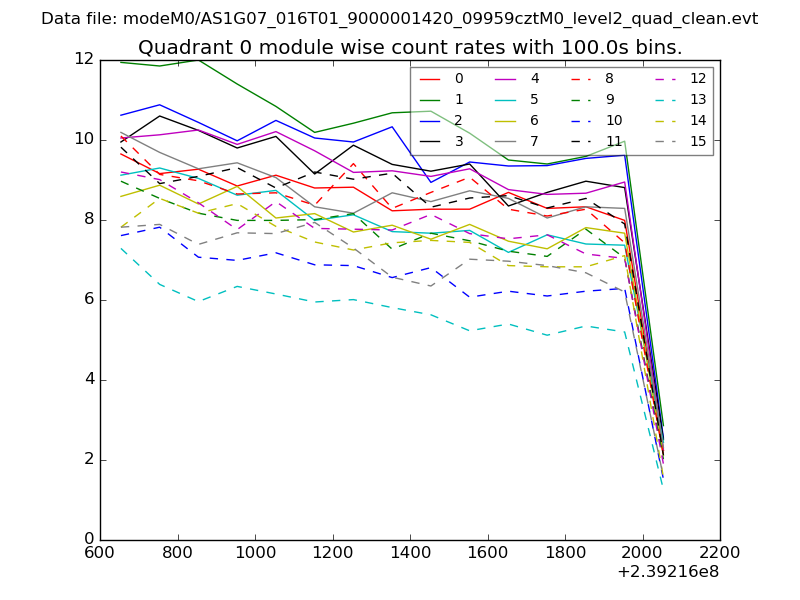 |
 |
| Module-wise count rates for Quadrant B Data is divided into 100 sec bins |
 |
 |
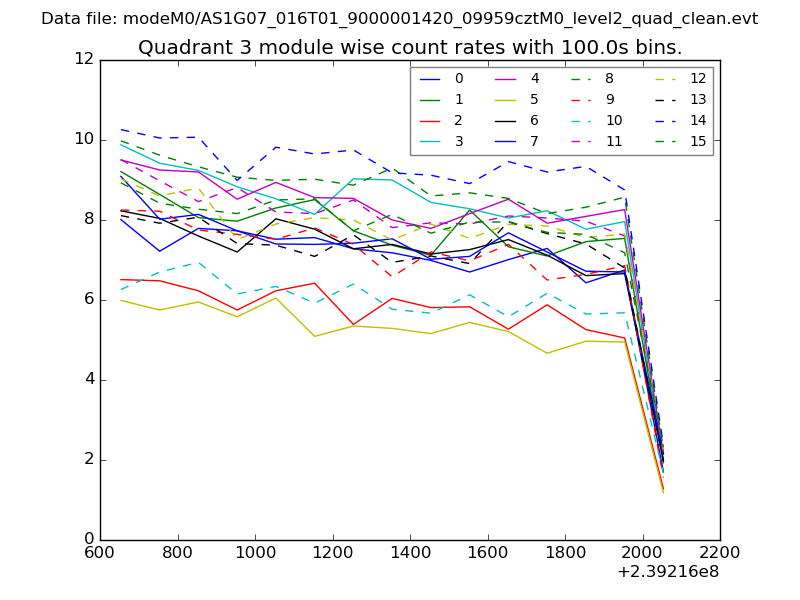
| Module-wise count rates for Quadrant C Data is divided into 100 sec bins |
 |
 |
| Module-wise count rates for Quadrant D Data is divided into 100 sec bins |
 |
 |
| Parameter | Plot |
|---|---|
| CZT HV Monitor |  |
| D_VDD | 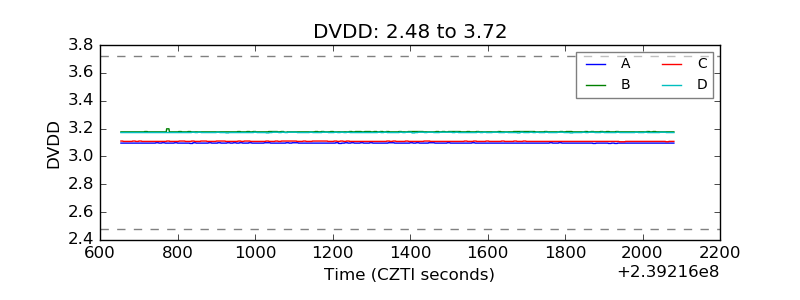 |
| Temperature 1 | 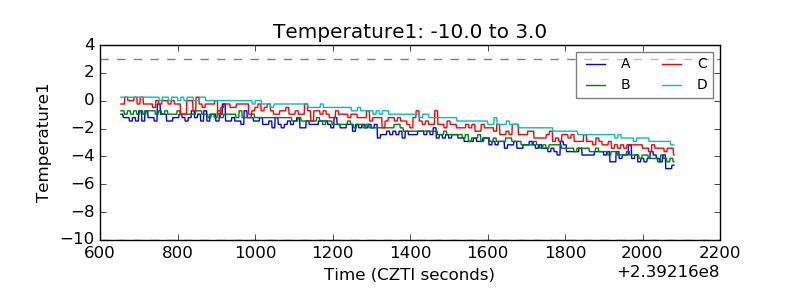 |
| Veto HV Monitor | 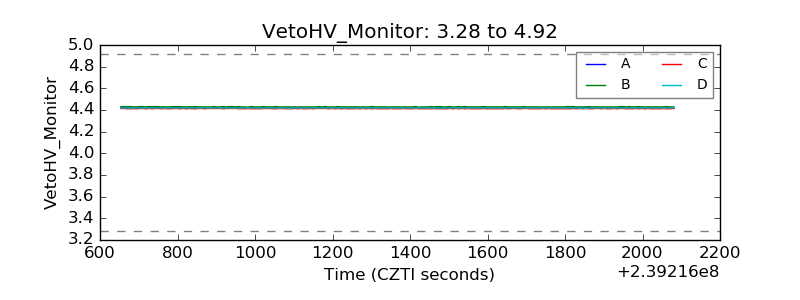 |
| Veto LLD | 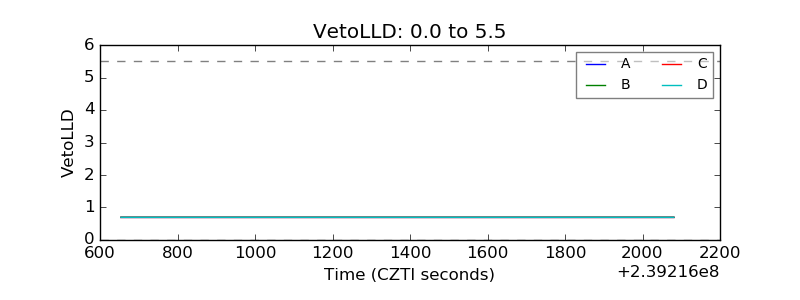 |
| Alpha Counter | 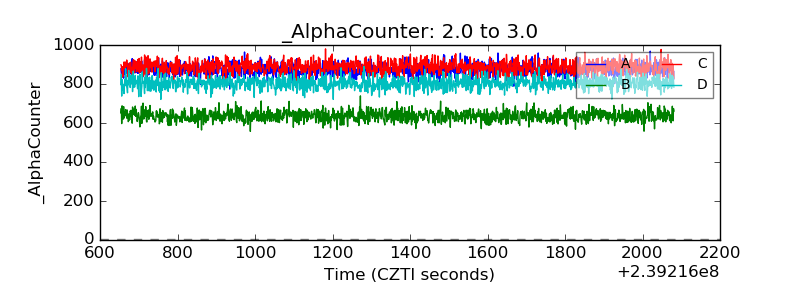 |
| _CPM_Rate | 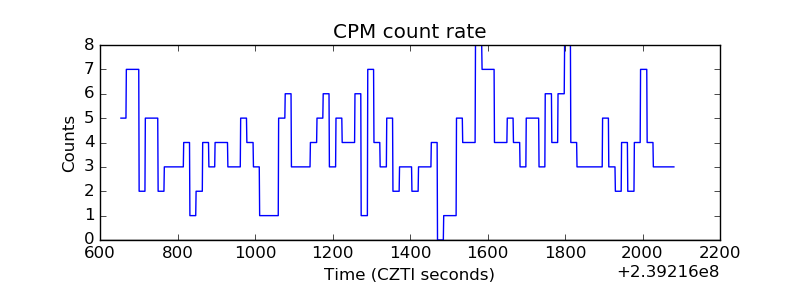 |
| CZT Counter | 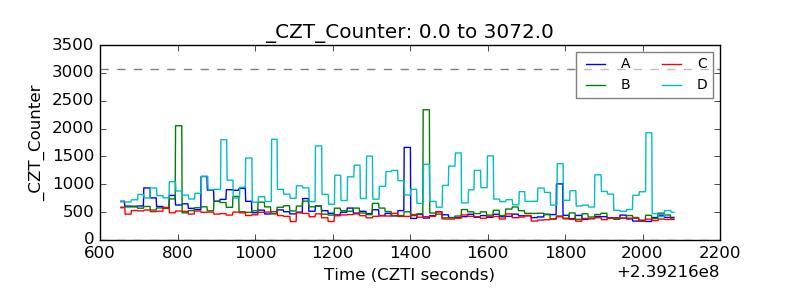 |
| +2.5 Volts monitor |  |
| +5 Volts monitor | 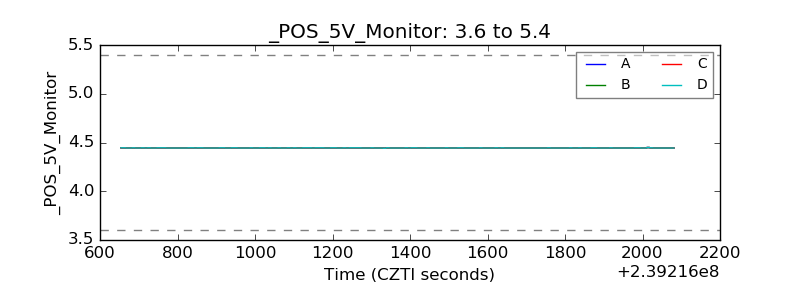 |
| _ROLL_ROT | 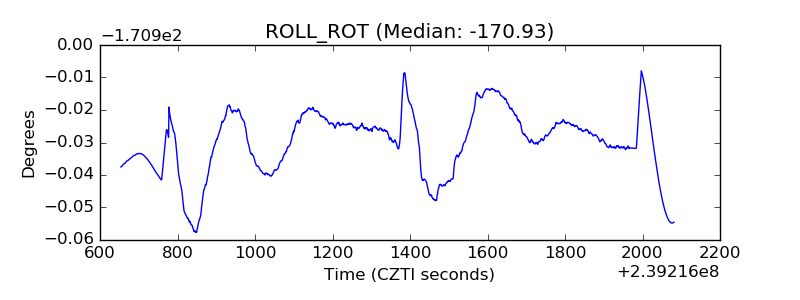 |
| _Roll_DEC | 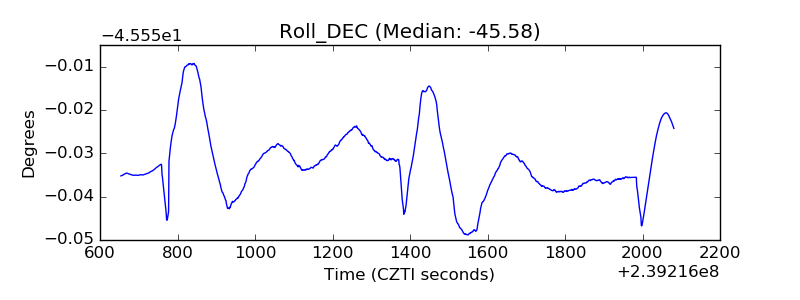 |
| _Roll_RA | 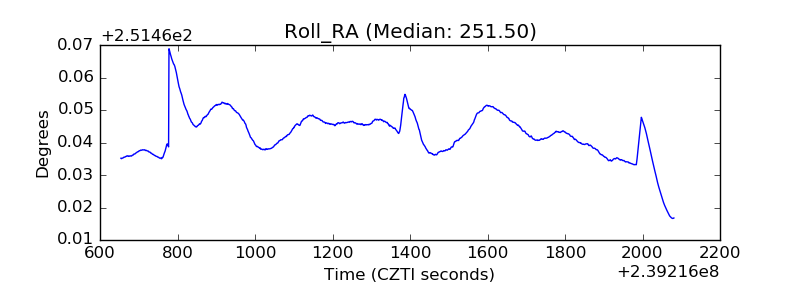 |
| Veto Counter | 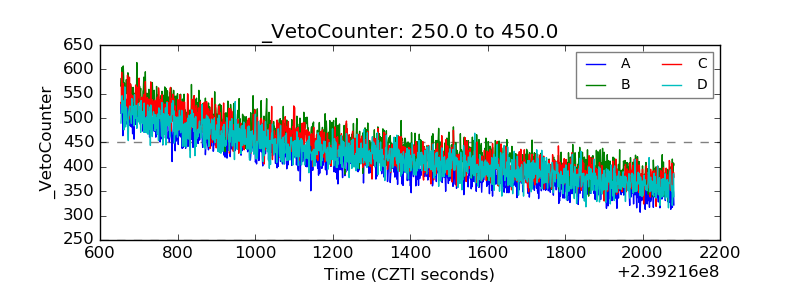 |